

Abstract
The nature of the control of glycolytic flux is one of the central, as-yet-uncharacterized issues in cellular metabolism. We developed a molecular genetic tool that specifically induces ATP hydrolysis in living cells without interfering with other aspects of metabolism. Genes encoding the F1 part of the membrane-bound (F1F0) H+-ATP synthase were expressed in steadily growing Escherichia coli cells, which lowered the intracellular [ATP]/[ADP] ratio. This resulted in a strong stimulation of the specific glycolytic flux concomitant with a smaller decrease in the growth rate of the cells. By optimizing additional ATP hydrolysis, we increased the flux through glycolysis to 1.7 times that of the wild-type flux. The results demonstrate why attempts in the past to increase the glycolytic flux through overexpression of glycolytic enzymes have been unsuccessful: the majority of flux control (>75%) resides not inside but outside the pathway, i.e., with the enzymes that hydrolyze ATP. These data further allowed us to answer the question of whether catabolic or anabolic reactions control the growth of E. coli. We show that the majority of the control of growth rate resides in the anabolic reactions, i.e., the cells are mostly “carbon” limited. Ways to increase the efficiency and productivity of industrial fermentation processes are discussed.
The glycolytic pathway of various organisms has been exploited for thousands of years for the production of alcohol and organic acids and has been the most important metabolic process known to humans. In 1897 this process was opened to scientific scrutiny when Büchner (3) disrupted yeast cells and observed the enzymatic conversion of glucose to ethanol and carbon dioxide. Many studies have addressed the fundamental question of what controls the flux through glycolysis, and much work has focused on analyzing the control by enzymes of the glycolytic pathway. Surprisingly, none of the glycolytic enzymes exerted significant control on the pathway flux in yeast (25) and, in Escherichia coli, overexpression of the proteins that catalyze the uptake and phosphorylation of the glucose did not increase the flux (23).
How is the flux through this major metabolic pathway controlled? According to metabolic control theory (9, 19), the sum of control exerted on the glycolytic flux should add up to 1. However, metabolic control theory also postulates that flux control can be shared by many enzymes in a pathway and that control could also reside outside the pathway, for instance, in the processes that consume the ATP generated in glycolysis (the ATP demand). To address the issue of whether ATP consumption by cellular processes determines the steady-state flux through glycolysis, one could augment the existing cellular ATP consumption. However, virtually all ATP-consuming processes are coupled to useful reactions, such as biosynthesis and substrate uptake. Consequently, such a manipulation will affect other processes than ATP consumption.
A way to circumvent this problem would be to introduce an ATP-consuming process that does not interfere with other aspects of metabolism. An ATPase that would simply hydrolyze ATP to ADP and Pi, without coupling to any energy-conserving reaction, would be ideal for this purpose. The (F1F0) H+-ATP synthase complex consists of two parts, the membrane integral part, F0, which forms a proton channel, and the cytoplasmic part, F1, which contains the catalytic site for interconversion of the proton motive force and the free-energy level in the form of ATP. Importantly, the soluble F1 part of the H+-ATP synthase can hydrolyze ATP in vitro (5) independently of the F0 part. Expression of the F1 part without F0 therefore provides a way to hydrolyze ATP in living cells.
Here we show that expression of F1 subunits from the H+-ATP synthase results in uncoupled ATPase activity in the E. coli cytoplasm. The added ATPase activity resulted in up to 70% increase in the rate of glycolysis and, by using a modular approach (29), we estimate that the majority of control (>75%) resides outside the glycolytic pathway, i.e., in enzymes that consume ATP.
MATERIALS AND METHODS
Bacterial strains and plasmids.
Cloning, plasmid propagation, and growth experiments were performed with E. coli K-12 BOE270 kindly provided by Lars Boe (2), derived from MT102, which is an hsdR derivative of strain MC1000 [araD139 Δ(ara-leu)7679 galU galK lac 174 rpsL thi-1] (4). E. coli K-12 strain LM3115 [F+ asnB thi-1 relA1 spoT1 lacUV5 lacYΔatpIBEFHAGDC750] is a derivative of LM2800 (15, 16) in which the native atp operon has been deleted. The strain was used to identify ATPase activity and to investigate the effect of uncoupled ATPase activity in the absence of functional (F1F0) H+-ATP synthase. The strains and plasmids used are listed in Table 1.
TABLE 1.
Bacterial strains and plasmids
| Strain or plasmid | Relevant genotype or characteristica | Reference or source |
|---|---|---|
| E. coli strains | ||
| BOE270 | Derived from strain MT102, which is an hsdR derivative of MC1000 [araD139 Δ(ara-leu)7679 galU galKlac-174 rpsL thi-1] | 2 |
| LM3115b | F+asnB32 thi-1 relA1 lacUV5 lacY spoT1ΔatpIBEFHAGDC750 | 16 |
| PJ4454 | BOE270 transformed with pCP44, Ermr | 14 |
| BK1017 | BOE270 transformed with pCP34::atpAGD, Ermr | This study |
| BK1032 | BOE270 transformed with pCP41::atpAGD, Ermr | This study |
| BK1036 | BOE270 transformed with pCP44::atpAGD, Ermr | This study |
| BK1168 | LM3115 transformed with pCP41, Ermr | This study |
| BK1169 | LM3115 transformed with pCP44, Ermr | This study |
| BK1171 | LM3115 transformed with pCP34::atpAGD, Ermr | This study |
| BK1172 | LM3115 transformed with pCP41::atpAGD, Ermr | This study |
| BK1173 | LM3115 transformed with pCP44::atpAGD, Ermr | This study |
| Plasmids | ||
| pTAC-AGD | pTTQ18 KpnI-XbaI::atpAGD KpnI-XbaI, 4.1-kb fragment, Ampr | Jensen et al.c |
| pAK80 | Promoter probe vector, promoterless lacLM encoding the reporter enzyme β-galactosidase, Ermr | 13 |
| PCP34 | PAK80 derivative carrying constitutive promoter CP34-lacLM, Ermr | 14 |
| pCP41 | PAK80 derivative carrying constitutive promoter CP41-lacLM, Ermr | 14 |
| pCP44 | PAK80 derivative carrying constitutive promoter CP44-lacLM, Ermr | 14 |
| pCP34::atpAGD | PCP34 BamHI-BamHI::atpAGD BamHI-BamHI, 4.5 kb, Ermr | This study |
| pCP41::atpAGD | PCP41 BamHI-BamHI::atpAGD BamHI-BamHI, 4.5 kb, Ermr | This study |
| pCP44::atpAGD | PCP44 BamHI-BamHI::atpAGD BamHI-BamHI, 4.5 kb, Ermr | This study |
The feature of a plasmid is indicated first by the vector ligated “::” to the insert. The restriction endonuclease used for digestion is shown. Kilobases refer to the size of an insert. Ampr, ampicillin resistance gene; Ermr, erythromycin resistance gene.
The lacUV5 and lacY mutations have no effect on the growth of the strains, i.e., on the growth rates, growth yields, and respiration rates of the strains (15).
Jensen et al., patent application.
Growth of cultures, media, and calculation of fluxes.
E. coli was routinely cultivated with agitation at 30°C in Luria-Bertani broth (24). Antibiotics were used at the following concentrations: ampicillin, 100 μg/ml (selection of pTAC-AGD); and erythromycin, 200 μg/ml (selection of pAK80 derivatives).
Growth experiments were performed with strains in which the atpAGD genes were expressed from a series of synthetic promoters: CP34, CP41, and CP44 (14). Strains with the expression vectors were used as references. The strains were inoculated from overnight cultures at 30°C (E. coli BOE270) or 37°C (E. coli LM3115) into 100 ml of agitated MOPS (morpholinepropanesulfonic acid) (21) supplemented with 5 μg of thiamine per ml; 50 μg each of isoleucine, leucine, and valine per ml; 0.4 g of glucose/liter (E. coli BOE270) or 0.8 g of glucose/liter (E. coli LM3115); and 200 μg of erythromycin per ml (pCP-vectors) to an optical density at 450 nm (OD450) of 0.005. Regular measurements of the OD450 were made, and samples were taken for measuring the [ATP]/[ADP] ratio, the specific β-galactosidase activity, and glucose consumption by high-pressure liquid chromatography (HPLC). The cell density was correlated to the cell mass of E. coli to be 0.19 g (dry weight)/liter for an OD450 of 1. The glycolytic flux was routinely calculated from the specific growth rate (μ) and the biomass yield on glycose (Yg) using the equation “μ/Yg,” assuming steady-state conditions, and was validated by HPLC. The fluxes measured by HPLC matched the fluxes deduced from μ/Yg within <3% error.
DNA techniques.
Plasmid DNA was isolated from E. coli cells by using Qiagen columns (Hilden, Germany). Cutting with restriction enzymes (obtained from Gibco-BRL, Pharmacia, and New England Biolabs) and treatment with T4 DNA ligase (Gibco-BRL) and calf intestine alkaline phosphatase (Pharmacia) were carried out as described by the manufacturers. DNA fragments were purified from agarose gels by using a Geneclean Kit (Bio 101, Inc., La Jolla, Calif.) or a High Pure PCR product purification kit (Boehringer Mannheim). Linearized cloning vectors were treated with calf intestine alkaline phosphatase to avoid religation of the vector.
Transformation.
E. coli strains were made competent by CaCl2 treatment (24). After transformation the cells were regenerated in Luria-Bertani medium (24) and subsequently transferred to Luria-Bertani agar plates supplemented with the appropriate antibiotic. Histochemical screening of lacLM was performed with X-Gal (5-bromo-4-chloro-3-indolyl-β-d-galactopyranoside; Sigma) at final concentrations of 100 μg/ml.
Construction of pCP-atp plasmids.
The E. coli atpAGD genes encoding the α, γ, and β subunits, respectively, were cloned in three different vectors containing synthetic constitutive promoters of different strengths (14). A 5-kb atpAGD fragment from the plasmid pTAC-AGD (P.R. Jensen, J. L. Snoep, and H. V. Westerhoff, 1998 international patent application PCT/DK97/00373 [publication number WO 98/10089]) was cloned by KpnI and ApaI in a pUC19 polylinker in order to have the atpAGD fragment flanked by two BamHI sites. Subsequently, this 4.5-kb BamHI fragment was cloned into the unique BamHI site downstream of the synthetic constitutive promoters on the plasmids pCP34, pCP41, and pCP44 (14), yielding plasmids pCP34::atpAGD, pCP41::atpAGD, and pCP44::atpAGD, respectively, which express the atpAGD genes constitutively to moderate but different extents (Fig. 1).
FIG. 1.

Plasmid for expression of F1-ATPase in E. coli. The boxes indicate the specific genes or origin of replication. The arrow indicates the promoters. The plasmid is not drawn to scale. “CPX” indicates synthetic promoters (14). In the current study CP34, CP41, and CP44 were employed. lacLM, β-galactosidase; erm, erythromycin resistance; ori, orgin of replication.
Measurement of ATPase activity.
Derivatives of E. coli LM3115 containing ATPase plasmids were grown aerobically in Luria-Bertani broth at 37°C. The cultures were harvested (40 ml) at an OD450 of 1 and centrifuged at 10,000 × g for 20 min at 4°C. The cells were resuspended in 2 ml of ATP buffer (0.1 M Tris-acetate [pH 7.75], 10 mM potassium acetate, 2 mM EDTA) supplemented with 10 μg of MgCl2 per ml. A volume of 0.6 ml of the resuspended culture was sonicated three times for 45 s and with a 30-s pause. The cell debris was removed by centrifugation for 30 min at 20,000 × g. The supernatant was preheated at 30°C for 5 min before the assay. The ATPase activities were then measured by using the luciferin-luciferase ATP monitoring kit (LKB) as follows: 150 μl of ATP buffer and 20 μl of ATP monitoring reagent were added to the column, and the background signal was measured. Then, 5 μl of standard ATP (10 μM) was added, and the signal was measured again. Finally, 50 μl of sonicated sample was added, and the signal was measured every 10 s. After the addition of cellular extracts, a log drop in ATP concentration occurred over time. The protein concentration of the cell extract was determined at OD280 and calculated by correlating an OD280 of 1 to 1 mg of protein per ml. Strain BK1169 with the cloning vector pCP44 was used as a reference strain. The ATPase activities were estimated from the slopes of ATP concentration as a function of time after subtraction of the background ATPase signal.
Measurements of the intracellular ATP and ADP concentrations
To measure the [ATP]/[ADP] ratio, 0.6 ml of cell culture was mixed with 0.6 ml of 80°C phenol (equilibrated with 10 mM Tris-1 mM EDTA [pH 8]) supplemented with 0.6-g glass beads (106 μm in diameter; Sigma) and immediately vortexed vigorously for 20 s. After 30 to 60 min at room temperature the samples were vortexed again for 20 s. The two phases were separated by centrifugation at 14,000 rpm for 15 min. The water phase was subsequently treated two times with 1 volume of chloroform to extract residual phenol. The ATP and ADP concentrations were then measured by using a luciferin-luciferase ATP monitoring kit (LKB) as recommended by the manufacturer. The concentration of ATP was measured first. Subsequently, the ADP content in the same sample was converted to ATP by adding 1 U of pyruvate kinase and 1 mM phosphoenolpyruvate (PEP) and then recorded as the concomitant increase in luminescence. Finally, a standard ATP concentration (1 μM) was added in order to quantify [ATP] and [ADP]. The results were corrected for quenching of the ATP signal by the pyruvate kinase preparation.
Measurement of β-galactosidase activity.
The sampling was performed by pipetting aliquots of culture into ice-cooled Eppendorf tubes containing 12.5 μl of 0.1% sodium dodecyl sulfate and 25 μl of chloroform to permeabilize the cells. After vortexing for 10 s, the samples were placed on ice until the enzyme activities were measured. The measurements were carried out by diluting the extracts with a suitable volume of Z buffer (0.06 M Na2HPO4, 0.04 M NaH2PO4, 0.01 M KCl, 0.001 M MgSO4; pH 7.0) into a total volume of 1 ml. The diluted sample was preheated at 30°C for 5 min, and the enzyme activity was determined according to the standard procedure described by Miller (20).
Quantification of glucose by HPLC.
Samples of 2 ml were withdrawn from the cultures at different time intervals and quickly filtered through a 0.22-μm (pore-size) filter and stored at −20°C. The HPLC equipment used was from Shimadza Corporation and was controlled by the system program Class VP 5.0. The separation was performed as described earlier (1).
RESULTS
Expression of ATPase activity from constitutive promoters in E. coli.
The cytoplasmic F1 part of the membrane-bound (F1F0) H+-ATP synthase possesses the catalytic site for ATP synthesis and/or hydrolysis. By expressing different combinations of F1 genes from an inducible lac-type promoter, we found that the combination of the α, γ, and β subunits exerted the strongest ATPase activity (data not shown). These results were in good accordance with in vitro reconstitution experiments (5). We therefore cloned the E. coli genes atpAGD encoding the α, γ, and β subunits in vectors containing synthetic constitutive promoters of different strengths (14). The atp genes were inserted between the constitutive promoters and a reporter gene encoding β-galactosidase, which allowed us to estimate the transcription through the atp genes. The resulting plasmids pCP34::atpAGD, pCP41::atpAGD, and pCP44::atpAGD (Fig. 1), which express the atpAGD genes constitutively and to different extents (Table 2), were introduced into wild-type E. coli BOE270 and Δatp E. coli LM3115. We also cloned the genes downstream of a stronger promoter, but the resulting strain appeared to be unstable.
TABLE 2.
Physiology of derivatives of strain E. coli BOE270 and E. coli LM3115 with uncoupled F1-ATPase activity (α, γ, and β subunits)
| Original strain and derived strainb | Plasmid | Specific β-galactosidase activity (Miller units)a | Biomass yield (Yg)c | Growth rate (μ [h−1]) | Glucose flux (Jgluc)d | Biomass yield (%) | Growth rate (%) | Glucose flux (%) |
|---|---|---|---|---|---|---|---|---|
| BOE270 | ||||||||
| PJ4454 | pCP44 | ND | 0.075 | 0.48 | 6.5 | 100 | 100 | 100 |
| BK1032 | pCP41::atpAGD | 7.5 | 0.050 | 0.45 | 8.9 | 67 | 93 | 137 |
| BK1017 | pCP34::atpAGD | 22 | 0.041 | 0.40 | 9.9 | 55 | 83 | 153 |
| BK1036 | pCP44::atpAGD | 44 | 0.033 | 0.37 | 11.0 | 45 | 76 | 170 |
| LM3115 | ||||||||
| BK1168 | pCP41 | ND | 0.051 | 0.59 | 12.4 | 100 | 100 | 100 |
| BK1172 | pCP41::atpAGD | ND | 0.028 | 0.44 | 16.5 | 55 | 76 | 133 |
The expression of the lacLM genes in operons with atpAGD are given in the table as specific β-galactosidase activities (in Miller units) (20) and can be related to the expression of atpAGD. The ATPase activity increases from top to bottom in the table. The specific β-galactosidase activities were measured three times each on exponentially growing cultures in minimal MOPS medium (21) supplemented with 0.4 g of glucose/liter. ND, not determined.
E. coli strains were grown at 30°C (BOE270 derivatives) or at 37°C (LM3115 derivatives) in minimal MOPS medium (21) supplemented with 0.4 g of glucose (BOE270 derivatives) or 0.8 g of glucose (LM3115 derivatives)/liter; 50 μg of isoleucine, leucine, and valine/ml; 5 μg of thiamine/ml; and 200 μg of erythromycin/ml.
As measured in grams (dry weight)/millimoles of glucose.
As measured in millimoles of glucose/h/grams (dry weight).
Direct evidence for expression of F1-ATPase activity in E. coli.
The presence of uncoupled ATPase activity was analyzed by measuring soluble ATPase activity in extracts from cells, which expressed the atpAGD genes. To avoid a high background signal from resident H+-ATP synthase, the ATPase activity was measured in E. coli LM3115, in which the chromosomal atp operon has been deleted. When F1-ATPase was expressed in the cells, an increase in the cytoplasmic ATPase activity was seen, which corresponded with the activity expected from the measured β-galactosidase activity (Fig. 2B). These data show that cytoplasmic ATPase activity had been increased in the cells and that measurements of specific β-galactosidase can be used indirectly to estimate the expression of ATPase activity.
FIG. 2.

Introduction of ATPase activity by overexpression of F1 genes. (A) Direct measurements of ATPase activities in E. coli LM3115 derivatives. The change in ATP concentration related to the total protein level is shown as a function of time after the addition of cellular extracts. The plasmid contents in strains BK1169(pCP44), BK1171(pCP34::atpAGD), BK1172(pCP41::atpAGD), and BK1173(pCP44::atpAGD), respectively, are indicated in the box. (B) Correlation between specific ATPase activity and specific β-galactosidase activity. (C) Correlation between specific ATPase activity with ATP, ADP, ATP+ADP pools and [ATP]/[ADP] ratios. The experimental data for the ATP, ADP, and ATP+ADP pools are fitted to linear curves shown by dotted lines, and the [ATP]/[ADP] ratio is fitted by a curve shown by a full line. Error bars indicate the standard deviations of the measurements. The data represent the average of four to six measurements.
Uncoupled ATPase activity results in a reduced intracellular energy state.
The central question is whether the added ATPase activity affects the energy state of the cells, as reflected by the intracellular [ATP]/[ADP] ratio, or whether the cells can compensate for the increased rate of ATP consumption. We found that the concentration of ATP decreased slightly in E. coli BOE270 with increased ATPase expression and was 25% lower at the highest ATPase expression. The concentration of ADP was relatively more affected and increased by 65%. The total concentration of ATP plus ADP was found to decrease slightly with higher ATPase activity and was 18% lower at the highest ATPase level (Fig. 2C). The [ATP]/[ADP] ratio dropped from 11 to 5 as the expression of ATPase increased (Fig. 2C).
We also measured the [ATP]/[ADP] ratio in the cells devoid of H+-ATP synthase, and here also the [ATP]/[ADP] ratio dropped gradually as the expression of ATPase increased.
Uncoupled ATPase activity results in increased glycolytic flux.
We then studied how the ATPase activity affected the growth of E. coli. Wild-type E. coli BOE270 strains containing one of the three ATPase plasmids were grown in minimal medium supplemented with a limited concentration of glucose (Fig. 3).
FIG. 3.

Growth curves of E. coli BOE270 derivatives with F1-ATPase activities. Cell density (i.e., the OD450 value) is shown as a function of time of the cultures. The strains were grown under aerobic conditions in minimal MOPS medium (21), supplemented with thiamine (5 mg/liter); isoleucine, leucine, and valine (50 mg of each/liter); erythromycin (200 mg/liter); and limited amounts of glucose (0.4 g/liter). The plasmids and generation times of strains PJ4454(pCP44), BK1032(pCP41::atpAGD), BK1017(pCP34::atpAGD), and BK1036(pCP44::atpAGD), respectively, are indicated.
Expression of the F1-ATPase subunits in wild-type E. coli had a slight negative effect on the growth rate, which decreased gradually with increased ATPase expression. At the highest expression level the growth rate was decreased to 76% relative to the reference strain (Table 2). The effect on the growth yield (in terms of biomass per mole of glucose), Yg, was stronger, and at the highest expression level the growth yield dropped to 45% of the reference value. The glycolytic fluxes were then measured as the steady-state consumption rate of glucose during exponential growth (Fig. 4). The specific glycolytic fluxes were calculated from the slopes of glucose consumptions plotted against the ODs multiplied by the specific growth rates. Importantly, the glycolytic flux was found to increase gradually with increased ATPase expression, until it reached 170% at the highest expression level (Table 2).
FIG. 4.

Glucose consumptions in E. coli BOE270 derivatives with F1-ATPase activities. The consumption of glucose as measured by HPLC is shown as a function of cell density. The respective plasmid contents are indicated.
When the uncoupled ATPase was expressed from pCP41::atpAGD in the H+-ATPase-negative E. coli mutant LM3115, the biomass yield was reduced to 55%, whereas the growth rate was reduced to 76%. This resulted in stimulation of the glycolytic flux by 33%, relative to the reference strain of LM3115(pCP41) (Table 2). The higher ATPase activities conferred by plasmids pCP34::atpAGD and pCP44::atpAGD reduced the growth of E. coli LM3115 in MOPS medium to such an extent that the strains were genetically unstable and difficult to analyze.
How much of the control of glycolysis is in the ATP-consuming processes?
It is clear from the primary data that by introducing an uncoupled ATP-consuming reaction into E. coli cells, the glycolytic flux can be increased significantly, which demonstrates that there is an excess capacity of the glycolytic reactions in these cells. In terms of flux control, the implication of this result is that the ATP-consuming reactions in the cell exert some control (9, 19) on the glycolytic flux. But how much of the control of the glycolytic flux is in the ATP-consuming processes? Is it 10% or perhaps 90%?
In order to obtain a quantitative answer as to how strong the control is, we split the energy metabolism into a block of enzymatic reactions that synthesize ATP (i.e., e1 [catabolism]) and a block of reactions that consume ATP (i.e., e2 [anabolism]):
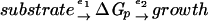 |
where ΔGp is the cellular energy state.
Under the assumption that anabolism and catabolism is only linked via ATP, this block elasticity approach is independent of the complexity of the components in the blocks (11, 29). The control of flux in this simple system can be calculated from the “elasticities” (the metabolic control analysis word for sensitivities [J. A. Burns, A. Cornish-Bowden, A. K. Groen, R. Heinrich, H. Kacser, J. W. Porteous, S. M. Rapoport, T. A. Rapoport, J.W. Stucki, J. M. Tager, R. J. A. Wanders, and H. V. Westerhoff, Letter, Trends Biochem. Sci. 10:16, 1985]) of the two blocks, i.e.:
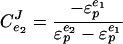 |
(1) |
where CeJ2 is the flux control coefficient and ɛpe1 and ɛpe2 are the elasticities of the blocks. This equation states that the control by the ATP-consuming reactions on the glycolytic flux can be calculated if we know how “elastic” the two blocks are toward changes in the cellular energy state, ΔGp. A high elasticity value means that the block is highly sensitive. A value of zero would indicate that the block is completely insensitive.
Figure 5 illustrates the relations between the glycolytic flux and the growth rate on the [ATP]/[ADP] ratio. Figure 5B shows a log-log plot of the glycolytic flux and the growth rate as a function of the intracellular [ATP]/[ADP] ratio in strains with different expressions of uncoupled ATPase activity. The elasticities of the two blocks are shown in Fig. 5C and are simply the slopes of the two curves in Fig. 5B, based on a fitted curve with a polynomium. The elasticity of the catabolic block is quite high (i.e., −0.89) in the absence of added ATPase and drops to −0.42 at the highest ATPase expression. In contrast, the elasticity of the anabolic block (growth rate) is rather low (i.e., 0.04) in the absence of ATPase and increases gradually to 0.65 at the highest ATPase expression.
FIG. 5.

Dependence of glycolytic flux and growth rate on the [ATP]/[ADP] ratio, and calculation of elasticity and flux control coefficients. Cultures of E. coli BOE270 derivatives were grown as described in legend of Fig. 3. (A) The relative glycolytic fluxes (□) and growth rates (▵) are plotted as functions of the [ATP]/[ADP] ratio for derivatives of E. coli BOE270 in which F1-ATPase is expressed from three synthetic promoters of different strengths. (B) Logarithmic (scaled) relative fluxes as a function of logarithmic [ATP]/[ADP] ratios. The experimental data points are fitted to curves shown by penetrating lines. The equations and R2 values are indicated above or below the plots. (C) Elasticities of glycolytic flux and growth rate toward the intracellular [ATP]/[ADP] ratio. The elasticities are the slopes of the scaled fluxes toward the [ATP]/[ADP] ratio in panel B as calculated from the fitted equations. (D) Flux control by the demand for ATP on the glycolytic flux as a function of [ATP]/[ADP] ratio as calculated from equation 1. The full line represents Ce2J1 based on the fitted polynomium for the relative growth rates in Fig. 5B, whereas the dotted line represents Ce2J1 based on a linear fit for the relative growth rates (not shown).
The control exerted by the ATP-consuming processes was then calculated from equation 1. Figure 5D shows the control by the two blocks on the glycolytic flux, as a function of the intracellular [ATP]/[ADP] ratio. The calculation shows that in the wild-type cells without added ATPase, the ATP-consuming reactions together had all (Ce2J1 = 1) of the control on the glycolytic flux. With increased expression of ATPase, the [ATP]/[ADP] ratio drops and the control by the ATP-consuming reactions decrease gradually, and in strain BK1036 containing plasmid pCP44::atpAGD, the control is reduced to Ce2J1 = 0.4.
Even if the slope of the anabolic flux in Fig. 5B is based on a fit by a linear equation, which might result in overestimation of the small change in anabolic flux at wild-type level, the control by the ATP-consuming processes is still Ce2J1 = 0.75 (Fig. 5D). Here the control remains high with increased expression of ATPase, whereafter it falls dramatically toward zero at an [ATP]/[ADP] ratio of <5.
The sum of flux control should always add up to 1, which means that in the wild-type cell there is relatively little flux control in the catabolic reactions. In contrast, in the cells with high ATPase expression, most of the control is in the catabolic reactions.
When ATPase activity was introduced into the E. coli strain with a deleted chromosomal atp operon, the control by demand on the glycolytic flux was still found to be 0.58, even though the glycolytic flux in this strain was already increased by ca. 30% relative to the parental strain with a functional atp operon (18).
DISCUSSION
Uncoupled ATPase activity by the F1 domain.
In this study we show that overexpression of the catalytic portion of the (F1F0) H+-ATP synthase in E. coli introduces ATPase activity in vivo. The introduction of ATPase activity by concomitant overexpression of the α, γ, and β subunits was measured directly by in vitro assay, and it was found that the increase in ATPase activity corresponded well with the decrease in the [ATP]/[ADP] ratio. If we assume a constant yield of ATP, the amount of biomass formed correlates directly to the amount of ATP that is formed. Thus, the biomass yield is a measure for the activity of the uncoupled ATPase, i.e., the more ATP that is hydrolyzed via the uncoupled ATPase the less ATP is available for biomass formation. The decrease in yield at higher expression levels of the uncoupled ATPase is the most direct evidence to show that the uncoupled ATPase is active in vivo. Together with the increase in in vitro ATPase activities, these data show the introduction of uncoupled ATPase activity. These results are also in good agreement with reconstitution experiments, where complexes of α, β, and γ subunits reconstituted from isolated individual subunits of E. coli (6, 7), Bacillus sp. strain PS3 (30) and Salmonella enterica serovar Typhimurium (12) were found to have high ATPase activity. The δ and ɛ subunits of the F1 attach the latter to the membrane (F0) part of the H+-ATP synthase in such a manner that the coupling with proton translocation can take place, but they are not involved in the ATP hydrolysis per se (5, 26).
The glycolytic flux was controlled by the demand for ATP.
We have demonstrated experimentally that the glycolytic pathway of E. coli seems to be controlled by the hydrolysis of one of its products, namely, ATP. This resolves the enigma of not finding much control of the glycolytic flux in the enzymes of glycolysis itself: most of the control resides in the ATP demand. This result is in accordance with data obtained from computer modeling of glycolysis in erythrocytes (8, 22). A difference between the effect on yield and on growth rate is not surprising. Upon increased activity of the ATPase, the yield is directly affected; this process is dependent on the amount of ATP that is hydrolyzed. The growth rate, however, is not dependent on the flux through the ATPase but on the [ATP]/[ADP] ratio that is present in the cell.
Whether, and to what extent, the glycolytic flux will increase when the [ATP]/[ADP] ratio decreases depends on (i) the elasticity of the catabolic module toward changes in the [ATP]/[ADP] ratio and (ii) the capacity of the catabolic system. We found that glycolysis in E. coli has a relatively high (negative) elasticity and anabolism has a low elasticity toward the [ATP]/[ADP] ratio. Together, these two elasticities explain the high flux control exerted on glycolysis by the ATP-consuming processes.
The phenomenon of control by demand has been associated with homeostasis in the sense of having little change in concentrations of intermediates upon substantial acceleration of the output flux (10, 27). Indeed, the increase in glycolytic flux should lead to a dynamic buffering of the cellular ATP levels. A similar increase was observed when the cellular ATP levels were compromised by reduced expression of the H+-ATPase (17). That increase seemed to be successful in maintaining the ATP levels to the extent that growth rate was almost not affected, until >50% of the H+-ATPase had been removed. However, in the present experiments we did observe a substantial drop both of the [ATP]/[ADP] ratio and of growth rate upon addition of the ATPase activity; here, the homeostasis seemed to be incomplete. This may reflect the much stronger compromising of the cellular energy state by the substantial expression of ATPase we brought about or perhaps mediation of the homeostasis by an intermediate other than the [ATP]/[ADP] ratio, such as the proton motive force.
The results of this study may also rationalize another surprising finding: that the phosphotransferase systems of Salmonella serovar Typhimurium and E. coli responsible for both uptake and phosphorylation of glucose had no control whatever on glycolytic flux or growth rate (23, 28). Since total control must be 100%, at least 75% control in the ATP hydrolyzing reactions leaves relatively little control to the supply reactions, including the uptake step of glucose.
The data presented here also allow us to answer the related question of what controls the growth rate of E. coli in minimal growth medium: the control of growth rate is shared between the catabolic and anabolic blocks of reactions, but the majority is in the anabolic block, which amounts mostly to carbon limitation. As the ATPase expression increases, the control shifts into the catabolic block and at the highest expression level the cells are probably truly energy limited, i.e., limited by the rate of catabolic reactions.
Perhaps the most telling aspect of these findings is that a central metabolic pathway can easily be controlled by processes outside the pathway. This also suggests that much of the regulation of mainstream physiological processes may involve factors outside these processes. Besides contributing to the fundamental understanding of cell function, this result may pay off when brought to bear on the many biotechnological processes where glycolysis by living cells is the dominant process, e.g., bioethanol, lactic acid, and amino acid production. Whereas previously biotechnologists have looked within the glycolytic pathways for ways to enhance the glycolytic flux, they may now be better advised to also look outside the pathway, perhaps at the processes that hydrolyze the ATP. We developed a technology here which had the capacity in a “clean” way to introduce uncoupled ATPase activity into the cell by overexpressing F1 genes from the universal (F1F0) H+-ATPase (Jensen et al., patent application). The technology is likely to work also in other systems with regard to the optimization of the yield of end products such as ethanol and lactate and with regard to the productivity of the bioprocessing equipment.
Acknowledgments
This work was supported by The Danish Academy of Technical Sciences (ATV), The Danish Research Agency, and Chr. Hansen A/S.
We thank Regina Schürmann for expert technical assistance and Martin B. Pedersen, Ole Michelsen, Jannie Hofmeyr, David Fell, and Reinhardt Heinrich for helpful discussions.
REFERENCES
- 1.Andersen, H., C. Solem, K. Hammer, and P. R. Jensen. 2001. Twofold reduction of phosphofructokinase activity in Lactococcus lactis results in strong decreases in growth rate and in glycolytic flux. J. Bacteriol. 183:3458-3467. [DOI] [PMC free article] [PubMed] [Google Scholar]
- 2.Boogerd, F. C., L. Boe, O. Michelsen, and P. R. Jensen. 1998. atp mutants of Escherichia coli fail to grow on succinate due to a transport deficiency. J. Bacteriol. 180:5855-5859. [DOI] [PMC free article] [PubMed] [Google Scholar]
- 3.Büchner, E. 1897. Alkoholische gahrung ohne hefezellen. Ber. Dtsch. Chem. Ges. 30:117-124. [Google Scholar]
- 4.Casabadan, M. J., and S. N. Cohen. 1980. Analysis of gene control signals by DNA fusion and cloning in Escherichia coli. J. Mol. Biol. 138:179-207. [DOI] [PubMed] [Google Scholar]
- 5.Dunn, S. D., and L. A. Heppel. 1981. Properties and functions of the subunits of the Escherichia coli coupling factor ATPase. Arch. Biochem. Biophys. 210:421-436. [DOI] [PubMed] [Google Scholar]
- 6.Dunn, S. D., and M. Futai. 1980. Reconstitution of a functional coupling factor from the isolated subunits of Escherichia coli F1 ATPase. J. Biol. Chem. 255:113-118. [PubMed] [Google Scholar]
- 7.Futai, M. 1977. Reconstitution of ATPase activity from the isolated α, β, and γ subunits of the coupling factor, F1, of Escherichia coli. Biochem. Biophys. Res. Commun. 79:1231-1237. [DOI] [PubMed] [Google Scholar]
- 8.Heinrich, R., and S. Schuster. 1996. The regulation of cellular systems, p. 177-188. Chapman & Hall, New York, N.Y.
- 9.Heinrich, R., and T. A. Rapoport. 1974. A linear steady-state treatment of enzymatic chains: general properties, control, and effector strength. Eur. J. Biochem. 42:89-95. [DOI] [PubMed] [Google Scholar]
- 10.Hofmeyr, J.-H. S. 1997. Anaerobic energy metabolism in yeast as a supply-demand system, p. 225-242. In A. Cornish-Bowden (ed.), New beer in an old bottle. Universidad de Valencia, Valencia, Spain.
- 11.Hofmeyr, J.-H. S., and A. Cornish-Bowden. 2000. Regulating the cellular economy of supply and demand. FEBS Lett. 467:47-51. [DOI] [PubMed] [Google Scholar]
- 12.Hsu, S.-Y., M. Senda, H. Kanazawa, T. Tsuchiya, and M. Futai. 1984. Comparison of F1′s of oxidative phosphorylation from Escherichia coli and Salmonella typhimurium and demonstration of interchangeability of their subunits. Biochemistry 23:988-993. [DOI] [PubMed] [Google Scholar]
- 13.Israelsen, H., S. M. Madsen, A. Vrang, E. B. Hansen, and E. Johansen. 1995. Cloning and partial characterization of regulated promoters from Lactococcus lactis Tn917-lacZ integrants with the new promoter probe vector, pAK80. Appl. Environ. Microbiol. 61:2540-2547. [DOI] [PMC free article] [PubMed] [Google Scholar]
- 14.Jensen, P. R., and K. Hammer. 1998. The sequence of spacers between the consensus sequences modulates the strength of prokaryotic promoters. Appl. Environ. Microbiol. 64:82-87. [DOI] [PMC free article] [PubMed] [Google Scholar]
- 15.Jensen, P. R., and O. Michelsen. 1992. Carbon and energy metabolism of atp mutants of Escherichia coli. J. Bacteriol. 174:7635-7641. [DOI] [PMC free article] [PubMed] [Google Scholar]
- 16.Jensen, P. R., H. V. Westerhoff, and O. Michelsen. 1993. The use of lac-type promoters in control analysis. Eur. J. Biochem. 277:181-191. [DOI] [PubMed] [Google Scholar]
- 17.Jensen, P. R., O. Michelsen, and H. V. Westerhoff. 1993. Control analysis of the dependence of Escherichia coli physiology on the H+-ATPase. Proc. Natl. Acad. Sci. USA 90:8068-8072. [DOI] [PMC free article] [PubMed] [Google Scholar]
- 18.Jensen, P. R., O. Michelsen, and H. V. Westerhoff. 1995. Experimental determination of control by the H+-ATPase in Escherichia coli. J. Bioenerg. Biomembr. 27:543-554. [DOI] [PubMed] [Google Scholar]
- 19.Kacser, H., and J. A. Burns. 1973. Rate control of biological processes. Cambridge Symp. Soc. Exp. Biol. 27:65-104. [PubMed] [Google Scholar]
- 20.Miller, J. H. 1972. Experiments in molecular genetics, p. 352-355. Cold Spring Harbor Laboratory Press, Cold Spring Harbor, N.Y.
- 21.Neidhardt, F. C., P. L. Bloch, and D. L. Smith. 1974. Culture medium for enterobacteria. J. Bacteriol. 119:736-747. [DOI] [PMC free article] [PubMed] [Google Scholar]
- 22.Rapoport, T. A., R. Heinrich, and S. M. Rapoport. 1976. The regulatory principles of glycolysis in erythrocytes in vivo and in vitro. A minimal comprehensive model describing steady states, quasi-steady states, and time-dependent processes. Biochem. J. 154:449-469. [DOI] [PMC free article] [PubMed] [Google Scholar]
- 23.Ruyter, G. J. G., P. W. Postma, and K. van Dam. 1991. Control of glucose metabolism by enzyme IIGlc of the phosphoenolpyruvate-dependent phosphotransferase system in Escherichia coli. J. Bacteriol. 173:6184-6191. [DOI] [PMC free article] [PubMed] [Google Scholar]
- 24.Sambrook, J., E. F. Fritsch, and T. Maniatis. 1989. Molecular cloning: a laboratory manual, 2nd ed. Cold Spring Harbor Laboratory Press, Cold Spring Harbor, N.Y.
- 25.Schaaff, I., J. Heinisch, and F. K. Zimmermann. 1989. Overproduction of glycolytic enzymes in yeast.Yeast 5:285-290. [DOI] [PubMed] [Google Scholar]
- 26.Senior, A. E. 1990. The proton-translocating ATPase of Escherichia coli. Annu. Rev. Biophys. Chem. 19:7-41. [DOI] [PubMed] [Google Scholar]
- 27.Thomas, S., and D. A. Fell. 1998. A control analysis explanation of the role of ATP utilization in glycolytic-flux control and glycolytic-metabolite-concentration regulation. Eur. J. Biochem. 258:956-967. [DOI] [PubMed] [Google Scholar]
- 28.van der Vlag, J., R. van't Hof, K. van Dam, and P. W. Postma. 1995. Control of glucose metabolism by the enzymes of the glucose phosphotransferase system in Salmonella typhimurium. Eur. J. Biochem. 230:170-182. [DOI] [PubMed] [Google Scholar]
- 29.Westerhoff, H. V., and K. van Dam. 1987. Thermodynamics and control of biological free energy transduction. Elsevier, Amsterdam, The Netherlands.
- 30.Yoshida, M., H. Okamoto, N. Sone, H. Hirata, and Y. Kagawa. 1977. Reconstitution of thermostable ATPase capable of energy coupling from its purified subunits. Proc. Natl. Acad. Sci. USA 74:936-940. [DOI] [PMC free article] [PubMed] [Google Scholar]