

Abstract
Context
Although estrogen clearly plays a central role in regulating bone mass in women, studies in men have suggested that there may be a threshold bioavailable (bio) estradiol (E2) level below which aging men begin to lose bone and that the threshold for estrogen deficiency in cortical bone may be considerably lower than that in trabecular bone. There are no data testing this in women.
Objective
Our objective was to assess volumetric bone mineral density (vBMD) and bone geometry by quantitative computed tomography and relate these to circulating bio E2 and bio testosterone levels.
Design
We studied a cross-sectional, age-stratified population sample of 235 women (age, 21–97 yr).
Results
vBMD/structural parameters were not related to sex steroid levels in young premenopausal women (age, 20–39 yr) with a median bio E2 level of 17 pg/ml (63 pmol/liter). By contrast, bio E2 and bio testosterone levels were both significantly associated with trabecular and cortical vBMD and cortical area at multiple sites in late postmenopausal women (age ≥ 60 yr) who had a median bio E2 level of 3 pg/ml (11 pmol/liter). Late premenopausal and early postmenopausal women (age, 40–59 yr) with an intermediate median bio E2 level of 11 pg/ml (42 pmol/liter) showed age-adjusted correlations of bio E2 levels with trabecular but not with cortical vBMD.
Conclusions
In women, bio E2 levels are associated with vBMD and some structural bone parameters at low but not high bio E2 levels. Similar to findings in men, the threshold for estrogen deficiency in cortical bone in women appears to be lower than that in trabecular bone.
Abbreviations: bio, Bioavailable; BMD, bone mineral density; CV, coefficient of variation; DXA, dual-energy x-ray absorptiometry; E2, estradiol; ER, estrogen receptor; QCT, quantitative computed tomography; T, testosterone; vBMD, volumetric bone mineral density
THE CENTRAL ROLE played by estrogen in regulating bone mass in women is now well established (1). Recently, it has become clear that estrogen also plays an important, and perhaps dominant, role in bone metabolism in men (2, 3). Moreover, in contrast to women who have very high estrogen levels premenopausally that drop to very low levels after the menopause, serum bioavailable (bio) estradiol (E2) levels decline gradually as a continuous function of age in men (4–6). Paradoxically, this has allowed for the delineation of certain dose-response relationships between serum E2 levels and bone mineral density (BMD) in men which, a priori, might have been difficult to ascertain in women. Thus, using dual-energy x-ray absorptiometry (DXA), we (5) and others (7) have found that there may be a possible threshold bio E2 level below which aging men begin to lose bone at either the radius, lumbar spine, or femur neck. Using central and peripheral quantitative computed tomography (QCT) as well as new software to analyze the scans (8, 9), we recently extended these findings and demonstrated that this presumed threshold in men was most evident in cortical bone (6). Thus, at all cortical sites assessed in the men, volumetric BMD (vBMD) was associated with serum bio E2 levels at low [<8 pg/ml (30 pmol/liter)] but not at high (≥ 8 pg/ml) levels. However, no such differences were evident at trabecular sites, where the associations between bio E2 and trabecular vBMD were fairly similar at low vs. high bio E2 levels. Collectively, these data suggested that the threshold for estrogen deficiency in cortical bone was considerably lower than that in trabecular bone.
The testable prediction from our studies in men is that, assuming the dose-response relationships are similar in women, the association between trabecular vBMD and bio E2 levels should become evident first as estrogen levels fall and that the association between cortical vBMD and bio E2 levels should not be present until bio E2 levels decline further. Admittedly, the specific bio E2 threshold levels for cortical or trabecular bone could well be different in men compared with women because of the added effects of the much higher androgen levels in men. This hypothesis is virtually impossible to rigorously test using DXA, which cannot separate trabecular from cortical bone. Thus, in the present study, we used central and peripheral QCT and assessed the relationship of vBMD, size, geometry, and structure at different skeletal sites to serum bio E2 levels in an age-stratified, random sample of Rochester, Minnesota, women. In addition, to determine the relative contribution of androgens toward vBMD/structural parameters in women, we also evaluated possible relationships between these parameters and circulating bio testosterone (T) levels.
Subjects and Methods
Study subjects
We recruited 375 women from an age-stratified, random sample of Rochester residents who were selected using the medical records linkage of the Rochester Epidemiology Project (10). This population is highly characteristic of the U.S. White population, but Blacks, Asians, and Hispanics are underrepresented. The sample spanned ages from 21–97 yr. For the present study, we excluded premenopausal women who were on oral contraceptives (41 subjects) and postmenopausal women who were on hormone therapy (90 subjects), bisphosphonates (four subjects), or raloxifene (three subjects). An additional two women were found to have hypercalcemia (probably primary hyperparathyroidism), and one was noted to have a serum creatinine greater than 2 mg/dl; these subjects were also excluded. Thus, 235 women were included in this analysis. Reflecting the ethnic composition of the community, 98.7% of the women were White. All studies were approved by the Mayo Institutional Review Board, and written, informed consent was obtained from all subjects.
To be consistent with our previous study in men (6), we divided the women into three age groups: A, aged 20–39 yr (n = 37); B, aged 40–59 yr (n = 84); and C, aged 60 yr and older (n = 114). We defined menopause as the absence of menses for greater than 6 months. Using this definition, all of the women in group A were premenopausal, and all of the women in group C were postmenopausal. Group B represented the late premenopausal/early postmenopausal group, and 55% of the women in this group were premenopausal using the above criteria.
Central QCT
As previously described (8, 9), single-energy CT scans were made at the lumbar spine and proximal femur with a multidetector Light Speed QX-I scanner (GE Medical Systems, Wakesha, WI). Calibration standards scanned with the patient were used to convert CT numbers directly to equivalent vBMD in mg/cm3 (11). To study age- and sex-specific structural changes in bone mineral distribution and structure, we developed software for the analysis of bone structure, geometry, and volumetric density from the CT images, specific details of which have been previously described (8). To validate our image-processing algorithm, we made 10 scans of the European Spine Phantom, which is composed of hydroxyapatite (12). The correlation between bone density results determined by our algorithm and that of the spine phantom was r = 0.998; using scans of L2 from the phantom over 10 d, vBMD was estimated to have a coefficient of variation (CV) of 0.7%.
Peripheral QCT
Single-energy CT scans were made at two scanning sites in the distal radius and at two scanning sites in the distal tibia using the Densiscan 1000 (Scanco Medical AG, Bassersdorf, Switzerland), as previously described (9). From a digital image (scout view) of the lower forearm and lower leg, the joint space is visualized and a reference point is set electronically at the intersection of the joint space with the radius-ulnar junction for the forearm and the tibial-fibular junction for the distal leg. From this line, an automated program then selects a distal and a more proximal scanning site at both the distal radius and distal tibia. For the radius, the more distal of the two scanning sites (termed Rad-D) was located 7–20 mm (most comparable to the ultra-distal radius site by DXA) and the more proximal scanning site (termed Rad-P) was located 48–55.5 mm (most comparable to the one third distal radius site by DXA) from the reference line. For the tibia, the more distal scanning site (termed Tib-D) was located 20–33.5 mm, and the more proximal scanning site (termed Tib-P) was located 63–70.5 mm from the reference line. Ten consecutive slices were made at the Rad-D and Tib-D sites, and six consecutive slices at the Rad-P and Tib-P sites. A surface detection algorithm delineates the bone that then is peeled pixel by pixel until core areas of 90, 70, and 50% remain. The outer 10% of bone is excluded to avoid partial volume effects from the bone edge. The 70–90% cross-sectional area contains cortical bone, and the inner 50% contains only trabecular bone. For the analyses presented here, the inner 50% at the Rad-D and Tib-D sites was used for trabecular vBMD, and the 70–90% value at the Rad-P and Tib-P sites was used for cortical vBMD. CVs were all less than 0.5% using our own data from two-repeat scans of 20 healthy young adults.
Sex steroid measurements
Fasting serum samples were obtained on all subjects at the time of the QCT measurements. Total E2 was measured using a double-antibody RIA (Diagnostic Products Corp., Los Angeles, CA) [interassay CV <8%; lower limit of detection, 5 pg/ml (18 pmol/liter)]. Total T was measured by a modified competitive immunoassay using direct, chemiluminescent technology (ACS 180; Bayer, Tarrytown, NY) (interassay CV <15%). The sensitivity of this assay was increased to 5 ng/dl (0.17 nmol/liter) using an in-house assay protocol where the volume of standards, controls, and samples was increased and the volume of the releasing agent was also increased to release bound T from endogenous binding proteins. SHBG was measured using a chemiluminescent immunoassay (Diagnostic Products) (interassay CV <8%). In addition, the non-SHBG-bound (bio) fraction of total T and E2 was measured using a modification of the technique of O’Connor et al. (13) and Tremblay and Dube (14), as previously described (4). The interassay CVs for bio E2 and bio T were each less than 12%. All assays were run within a few weeks of each other using the same lot of reagents/assay kits.
Statistical analyses
Sex hormones, bone structural parameters, and vBMD were summarized using medians and interquartile ranges (25–75%). The Kruskal-Wallis test was used to make an overall comparison of these variables between the three groups of women. In cases where the overall test was significant, Wilcoxon rank-sum tests were used to assess pairwise associations. Correlations of sex hormones with the bone structural and vBMD parameters were evaluated using Pearson’s simple and partial correlation coefficients. Linear regression was used to make an overall comparison of slopes vs. age between the three groups of women. In cases where the overall test was significant, two tests were performed to assess differences of slopes between groups A and B and between groups C and B. Model assumptions were assessed, and a log transformation was used on the sex hormone values where appropriate. Because trabecular vBMD at the radius and tibia did not differ significantly between the three groups, the relationships at these sites for trabecular vBMD with age were also studied using Pearson correlation and linear regression, where age was modeled using natural splines. Each model was then compared with a linear relationship, and the simplest model was used for analysis. Changes in variables between ages 20 and 90 yr were based on predicted values from these models. The S-plus lowess function (15), essentially a type of moving average, was used to explore the data in Fig. 1.
Fig. 1.
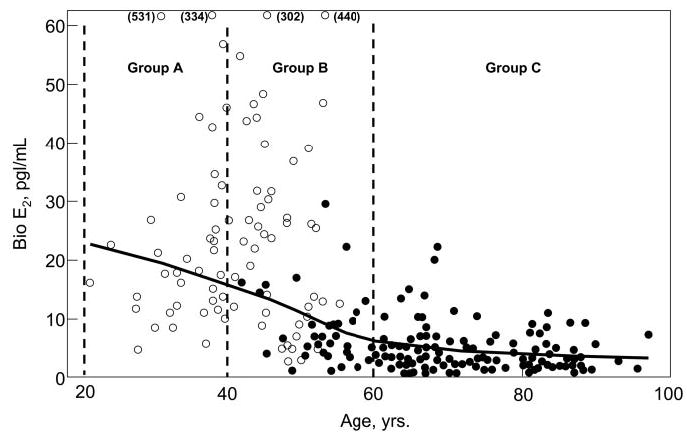
Serum bio E2 levels as a function of age in an age-stratified, random sample of Rochester, Minnesota, women. The age ranges of the three groups are as indicated. ○, Premenopausal women; •, postmenopausal women.
Results
Figure 1 shows the serum bio E2 levels as a function of age and menopausal status. As noted earlier, group A consisted exclusively of premenopausal and group C exclusively of postmenopausal women. Group B consisted of late premenopausal and early postmenopausal women.
Table 1 shows the clinical, hormonal, and vBMD/structural parameters in the women stratified by age. Body mass index was lower in group A compared with the other two groups. Total and bio T levels were similar across groups, whereas there was the expected decrease in total and bio E2 levels with age in these cross-sectional data. Median bio E2 levels were 17 pg/ml (63 pmol/liter), 11 pg/ml (42 pmol/liter), and 3 pg/ml (11 pmol/liter) in groups A, B, and C, respectively. Vertebral trabecular vBMD decreased progressively across groups, as did trabecular vBMD in the femur neck. Although trabecular vBMD at the radius and tibia did not differ significantly across groups in this analysis, when all women were analyzed together, there were inverse associations with age for both radius (r = −0.19; P = 0.004) and tibial (r = −0.16; P = 0.013) trabecular vBMD, with decreases between age 20 and 90 yr of 21 and 14%, respectively, at the two sites. Cortical vBMD at the femur neck, distal radius, and distal tibia was similar in groups A and B but clearly lower than these groups in group C.
TABLE 1.
Clinical, hormonal, and vBMD/structural parameters in the three groups of Rochester, Minnesota, women (median, interquartile range) stratified by age
| Group A (20–39 yr) | Group B (40–59 yr) | Group C (≥ 60 yr) | Overall P value | |
|---|---|---|---|---|
| n | 37 | 84 | 114 | |
| Age (yr) | 36.4 (32.3–38.5) | 50.4 (45.2–53.8) | 72.6 (66.6–83.1) | |
| Height (cm) | 164.8 (161.5–168.1) | 164.1 (160.5–169.1) | 159.6 (155.3–164.1)b,c | <0.001 |
| Weight (kg) | 65.1 (59.0–79.9) | 76.6 (65.5–88.8)a | 73.5 (62.3–81.1) | 0.008 |
| Body mass index (kg/m2) | 24.0 (21.6–28.4) | 27.9 (24.4–32.5)a | 28.3 (24.7–31.5)b | <0.001 |
| Total T (ng/dl) | 32.9 (23.9–38.1) | 28.0 (24.5–38.9) | 26.0 (20.0–40.1) | 0.324 |
| Bio T (ng/dl) | 2.3 (1.4–3.2) | 2.0 (1.4–4.0) | 2.0 (1.2–3.7) | 0.596 |
| Total E2 (pg/ml) | 71 (47–114) | 46 (20–102)a | 13 (10–19)b,c | <0.001 |
| Bio E2 (pg/ml) | 17 (12–26) | 11 (5–26)a | 3 (2–5)b,c | <0.001 |
| SHBG (μg/dl) | 1.2 (1.0–1.6) | 1.2 (0.8–1.6) | 1.2 (0.8–1.7) | 0.714 |
| vBMD parameters (mg/cm3) | ||||
| Vertebral trabecular | 192 (179–215) | 178 (159–195)a | 114 (92–141)b,c | <0.001 |
| Femur neck | ||||
| Total | 395 (355–434) | 356 (318–398)a | 284 (240–321)b,c | <0.001 |
| Trabecular | 276 (249–299) | 225 (197–259)a | 167 (138–207)b,c | <0.001 |
| Cortical | 623 (579–676) | 613 (565–663) | 536 (487–587)b,c | <0.001 |
| Distal radius | ||||
| Total | 566 (519–623) | 577 (530–646) | 480 (395–549)b,c | <0.001 |
| Trabecular | 232 (202–286) | 240 (195–285) | 234 (186–275) | 0.268 |
| Cortical | 1687 (1672–1712) | 1695 (1664–1714) | 1554 (1495–1625)b,c | <0.001 |
| Distal tibia | ||||
| Total | 519 (467–565) | 502 (448–539) | 434 (387–488)b,c | <0.001 |
| Trabecular | 270 (234–319) | 259 (231–296) | 259 (202–299) | 0.295 |
| Cortical | 1593 (1571–1615) | 1584 (1538–1613) | 1436 (1366–1503)b,c | <0.001 |
| Structural parameters (cm2) | ||||
| Vertebral area | 10.0 (9.4–10.4) | 10.3 (9.4–11.0)a | 10.7 (9.7–11.7)b,c | 0.001 |
| Femur neck | ||||
| Total area | 6.6 (6.1–7.3) | 6.8 (6.2–7.4) | 7.1 (6.4–7.6) | 0.067 |
| Endocortical area | 4.2 (3.8–5.0) | 4.5 (3.9–5.1) | 4.9 (4.2–5.4)b,c | 0.001 |
| Cortical area | 2.3 (2.1–2.4) | 2.3 (2.1–2.5) | 2.1 (1.9–2.3)b,c | <0.001 |
| Distal radius | ||||
| Total area | 1.1 (1.0–1.3) | 1.1 (1.0–1.2) | 1.1 (1.0–1.2) | 0.918 |
| Endocortical area | 0.21 (0.17–0.29) | 0.22 (0.17–0.28) | 0.32 (0.25–0.40)b,c | <0.001 |
| Cortical area | 0.86 (0.78–0.95) | 0.88 (0.81–0.93) | 0.78 (0.70–0.85)b,c | <0.001 |
| Distal tibia | ||||
| Total area | 3.8 (3.5–4.2) | 3.9 (3.6–4.2) | 3.9 (3.6–4.3) | 0.678 |
| Endocortical area | 1.6 (1.5–1.8) | 1.7 (1.4–1.9) | 1.9 (1.6–2.2)b,c | 0.002 |
| Cortical area | 2.2 (2.1–2.3) | 2.2 (2.1–2.4) | 2.0 (1.8–2.2)b,c | <0.001 |
Overall P value is for comparison between all three groups. To convert T to nmol/liter, multiply by 0.03467; to convert E2 to pmol/liter, multiply by 3.671; to convert SHBG to nmol/liter, multiply by 40.2.
P < 0.05, B vs. A.
P < 0.05, C vs. A.
P < 0.05, C vs. B.
Total bone area (i.e. the area encompassed by the periosteal surface of the bone) was higher in groups B and C compared with group A at the vertebrae and tended to be higher in groups B and C compared with group A at the femur neck but was not different across groups at the distal radius or tibia. By contrast, endocortical area was clearly higher in group C relative to groups A and B at the femur neck, distal radius, and tibia, resulting in a lower cortical area in these women at all three sites.
Table 2 shows the unadjusted and age-adjusted correlation coefficients relating total, trabecular, and cortical vBMD at the various sites to bio E2 and bio T levels in the three groups of women. The women in group A had a high median bio E2 level, and, not unexpectedly, no associations were found between serum bio E2 levels and vBMD at either cortical or trabecular sites in these women. By contrast, the women in group C had a very low median bio E2 level, and there were significant associations present between virtually all of the trabecular and cortical vBMD measures and serum bio E2 levels in these women. The only significant exception was cortical vBMD at the femur neck, and this may have been because of the difficulty in accurately measuring this in elderly women because of the thin cortex present there. Alternatively, the findings at the femur neck could be because the relationship between cortical vBMD and serum bio E2 levels is different at central vs. peripheral sites, although this was not the case in our previous study in men (6). The late pre- and early postmenopausal women in group B had an intermediate serum bio E2 level, and in these women, trabecular vBMD was clearly associated with serum bio E2 levels at virtually all of the measured sites; weaker associations were seen for cortical vBMD, none of which remained significant after adjusting for age (Table 2).
TABLE 2.
Unadjusted/age-adjusted correlation coefficients between vBMD parameters and bio E2 and bio T levels in the three groups of Rochester, Minnesota, women stratified by age
| vBMD site | Group A (20–39 yr) | Group B (40–59 yr) | Group C (≥ 60 yr) |
|---|---|---|---|
| Vertebral trabecular | |||
| Bio E2 | 0.12/0.08 | 0.52c/0.35b | 0.30b/0.25b |
| Bio T | 0.03/0.07 | 0.10/0.12 | 0.29b/0.26b |
| Femur neck | |||
| Total | |||
| Bio E2 | −0.01/0.00 | 0.40c/0.20 | 0.21a/0.17 |
| Bio T | 0.11/0.10 | 0.16/0.19 | 0.24a/0.21a |
| Trabecular | |||
| Bio E2 | −0.09/−0.05 | 0.44c/0.30b | 0.24a/0.20a |
| Bio T | 0.11/0.08 | 0.23a/0.26a | 0.28b/0.26b |
| Cortical | |||
| Bio E2 | 0.00/−0.04 | 0.24a/−0.01 | 0.06/0.04 |
| Bio T | −0.01/0.02 | 0.03/0.04 | 0.05/0.03 |
| Distal radius | |||
| Total | |||
| Bio E2 | −0.04/−0.08 | 0.30b/0.28a | 0.33c/0.29b |
| Bio T | 0.12/0.14 | 0.36c/0.36c | 0.28b/0.26b |
| Trabecular | |||
| Bio E2 | −0.01/−0.06 | 0.44c/0.41c | 0.33c/0.30b |
| Bio T | 0.04/0.06 | 0.32b/32b | 0.31c/0.30b |
| Cortical | |||
| Bio E2 | 0.00/−0.15 | 0.31b/0.17 | 0.30b/0.26b |
| Bio T | 0.18/0.29 | 0.01/0.01 | 0.24a/0.20a |
| Distal tibia | |||
| Total | |||
| Bio E2 | 0.12/0.10 | 0.34b/0.30b | 0.39c/0.36c |
| Bio T | 0.05/0.07 | 0.35b/0.36b | 0.40c/0.38c |
| Trabecular | |||
| Bio E2 | 0.04/0.06 | 0.27a/0.29b | 0.30b/0.27b |
| Bio T | −0.02/−0.03 | 0.29b/0.29b | 0.27b/0.25b |
| Cortical | |||
| Bio E2 | 0.11/−0.01 | 0.24a/0.07 | 0.39c/0.36c |
| Bio T | −0.07/−0.01 | −0.09/−0.09 | 0.43c/0.41c |
Log (bio E2) and log (bio T) were used in the regressions (see Subjects and Methods).
P < 0.05.
P < 0.01.
P < 0.001.
To further examine our hypothesis that trabecular bone would become dependent on bio E2 levels at higher bio E2 levels than cortical bone, we examined more closely the relationships between bio E2 levels and trabecular vBMD at the vertebrae (Fig. 2A) and cortical vBMD at the radius (Fig. 2B). The key group in this analysis was group B, because these women had serum bio E2 levels intermediate to those in groups A and C. As shown in Fig. 2A, the slope of the relationship between trabecular vBMD at the vertebrae and bio E2 levels in group B was similar to the slope in group C (P = 0.67). Although the slope was lower in group A, the difference in slopes between groups A and B did not reach statistical significance (P = 0.21). By contrast, however, the relationship between cortical vBMD at the radius and serum bio E2 levels was clearly different in group B vs. C (P = 0.03) (Fig. 2B). In short, the slope of the relationship between trabecular vBMD at the vertebrae and bio E2 levels was quite similar in group B to that in group C women, although the bio E2 levels differed greatly between the two groups [group B median, 11 pg/ml (42 pmol/liter) vs. group C median, 3 pg/ml (11 pmol/liter)]. However, the relationship between bio E2 levels and cortical vBMD at the radius in the women in group B was still quite different from this relationship in the women in group C. Similar findings were present for cortical vBMD at the tibia, where the slope of the vBMD/bio E2 relationship in group B (11.1) was similar to that in group A (6.1; P = 0.78) but clearly different from the slope of this relationship in the women in group C (46.9; P = 0.001).
Fig. 2.
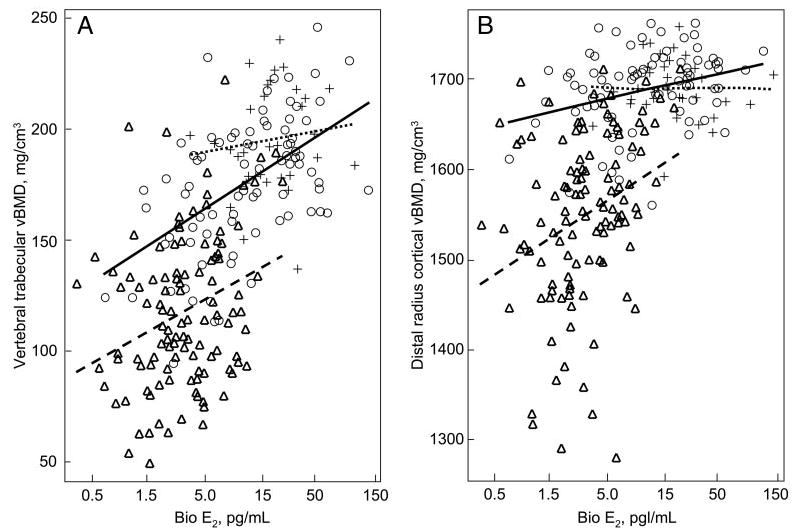
A, Relationship between trabecular vBMD at the vertebrae and serum bio E2 levels in group A (dotted lines, crosses), group B (solid lines, circles), and group C (dashed lines, triangles). Slopes are as follows: group A, 4.4; group B, 14.9; and group C, 12.9. B, Relationship between cortical vBMD at the distal radius and serum bio E2 levels in group A (dotted lines, crosses), group B (solid lines, circles), and group C (dashed lines, triangles). Slopes are as follows: group A, −0.01; group B, 12.4; and group C, 36.3. Note that bio E2 levels are on a log scale. See text for details.
Table 2 also shows the associations between vBMD and serum bio T levels in the three groups. Bio T levels were not related to any of the vBMD parameters in group A. By contrast, bio T levels were associated with the vBMD parameters in group C, with the strength of the correlations comparable to those present for bio E2 levels. In group B, bio T levels were associated with vBMD at some of the trabecular but none of the cortical sites.
Table 3 shows the unadjusted and age-adjusted correlation coefficients between bone structural parameters and bio E2/T levels. As with the vBMD parameters, there were no associations present in the women in group A between these parameters and sex steroid levels. In group B, cortical area at the femur neck, distal radius, and distal tibia was associated with bio E2 levels, but these correlations were no longer significant after age adjustment. The positive associations between bio E2 levels and cortical area were most evident in group C, where these correlations remained clearly significant at the radius and tibia, even after adjusting for age. Subendocortical area, which reflects the net effects of endocortical resorption, tended to be inversely associated with bio E2 levels in group C at the distal radius and tibia. Moreover, in these women, bio T levels were also associated with cortical area at the distal radius and tibia and also tended to be inversely associated with subendocortical area.
TABLE 3.
Unadjusted/age-adjusted correlation coefficients between bone structural parameters and bio E2 and bio T levels in the three groups of Rochester, Minnesota, women stratified by age
| Structural parameter | A (20–39 yr) | B (40–59 yr) | C (≥ 60 yr) |
|---|---|---|---|
| Vertebral area | |||
| Bio E2 | −0.03/−0.07 | 0.02/−0.01 | 0.05/0.06 |
| Bio T | 0.03/0.05 | −0.01/−0.01 | −0.11/−0.11 |
| Femur neck | |||
| Bone area | |||
| Bio E2 | −0.00/−0.03 | −0.07/0.00 | −0.00/−0.01 |
| Bio T | 0.01/0.02 | 0.04/0.04 | −0.10/−0.11 |
| Subendocortical area | |||
| Bio E2 | −0.02/−0.05 | −0.16/−0.07 | −0.07/−0.08 |
| Bio T | −0.09/−0.07 | −0.03/−0.03 | −0.16/−0.16 |
| Cortical area | |||
| Bio E2 | 0.06/0.07 | 0.24a/0.17 | 0.20a/0.18 |
| Bio T | 0.29/0.30 | 0.18/0.19 | 0.11/0.09 |
| Distal radius | |||
| Bone area | |||
| Bio E2 | 0.25/0.25 | 0.16/0.08 | 0.12/0.10 |
| Bio T | −0.14/−0.13 | −0.03/−0.03 | 0.08/0.07 |
| Subendocortical area | |||
| Bio E2 | 0.24/0.23 | 0.02/−0.01 | −0.20a/−0.17 |
| Bio T | −0.27/−0.26 | −0.17/−0.17 | −0.19a/−0.16 |
| Cortical area | |||
| Bio E2 | 0.21/0.21 | 0.27a/0.15 | 0.40c/0.37c |
| Bio T | 0.00/0.01 | 0.14/0.14 | 0.34c/0.32c |
| Distal tibia | |||
| Bone area | |||
| Bio E2 | −0.00/−0.00 | 0.08/0.03 | 0.06/0.03 |
| Bio T | −0.12/−0.12 | −0.05/−0.05 | −0.08/−0.11 |
| Subendocortical area | |||
| Bio E2 | −0.05/−0.01 | −0.04/−0.06 | −0.17/−0.16 |
| Bio T | −0.08/−0.10 | −0.17/−0.17 | −0.29b/−0.29b |
| Cortical area | |||
| Bio E2 | 0.07/0.02 | 0.28a/0.20 | 0.42c/0.39c |
| Bio T | −0.12/−0.09 | 0.22a/0.23a | 0.38c/0.35c |
Log (bio E2) and log (bio T) were used in the regressions (see Subjects and Methods).
P < 0.05.
P < 0.01.
P < 0.001.
Discussion
Although previous studies have assessed possible relationships between circulating sex steroid levels and BMD in women using DXA (4, 16, 17), our study is the first to do so using central and peripheral QCT, allowing us to evaluate possible associations separately in trabecular vs. cortical bone and to test for possible associations with bone geometric parameters. Moreover, the data in the women have allowed us to further test hypotheses generated from studies in men on the dose-response relationships between circulating bio E2 levels and trabecular vs. cortical bone (6).
Similar to young men, who have relatively high circulating bio E2 levels (6), we found that none of the vBMD/structural parameters were associated with bio E2 levels in young premenopausal women aged 20–39 yr, who are estrogen replete. Collectively, these data would suggest that both young men and premenopausal women are largely estrogen sufficient as far as bone is concerned and that variations in these relatively high levels have little impact on bone at either trabecular or cortical sites.
By contrast, elderly postmenopausal women aged 60 yr and older showed highly significant associations between trabecular and cortical vBMD parameters and bio E2 levels. These women had a median bio E2 level of 3 pg/ml (11 pmol/liter). This is well below our postulated threshold for estrogen deficiency in men for cortical bone of 8 pg/ml (30 pmol/liter) and also below the presumed higher threshold for estrogen deficiency in trabecular bone (see below) (6). The late pre- and early postmenopausal women with a median bio E2 level of 11 pg/ml (42 pmol/liter) served as an intermediate group where, based on the data in men (6), we would predict that associations with bio E2 levels would be present for trabecular bone but weaker or absent for cortical bone. This was, indeed, the case. Moreover, the relationship between bio E2 levels and trabecular vBMD in this intermediate group was most similar to that in the late postmenopausal women, whereas the relationship between bio E2 levels and cortical vBMD in this intermediate group of women was most similar to that in young premenopausal women. The combined data from our studies in men (6) and the present study, therefore, make a strong case in support of the hypothesis that trabecular bone has a higher threshold for estrogen deficiency than cortical bone.
Similar to bio E2, bio T levels were most strongly associated with trabecular and cortical vBMD parameters in the elderly postmenopausal women. Interestingly, bio T levels were fairly similar in the premenopausal compared with the late postmenopausal women. These data would suggest that in the setting of high bio E2 levels (as present in young premenopausal women), bio T levels are not related to BMD. By contrast, when bio E2 falls to very low levels (as in late postmenopausal women), even low bio T levels are associated with variations in trabecular and cortical vBMD.
Both bio E2 and bio T levels were also associated with cortical area in the late postmenopausal women. This appeared to be a result in large part of inverse associations of both sex steroids with subendocortical area, changes in which likely reflect net effects of endocortical resorption. This would be consistent with the known effects of estrogen and testosterone on inhibiting bone resorption (18, 19), although much of the antiresorptive effect of testosterone is likely mediated via aromatization to estrogen (18).
We should also note that although bio E2 levels fell dramatically, bio T levels did not change significantly over life in these women. Thus, the ratio of bio T/bio E2 clearly went up in the older women. As such, it is possible that this changing ratio also contributed to the associations between bio E2 and bio T and the vBMD/structural parameters that we observed.
We have previously suggested that the higher threshold for estrogen deficiency in trabecular compared with cortical bone may reflect the fact that trabecular bone contains both estrogen receptor (ER)-α and -β (with ER-β perhaps even predominating), whereas cortical bone contains largely (or almost exclusively) ER-α (20–22). Because ER-α is clearly more sensitive to estrogen than ER-β (23), circulating E2 levels would need to fall further for cortical bone to become estrogen deficient. The notion that trabecular bone becomes estrogen deficient at much higher circulating E2 levels is supported by our collective data in men (6) and now in women. We recognize, however, that other mechanisms for the differential sensitivity of trabecular vs. cortical bone to falling estrogen levels are also possible. Thus, the higher surface to volume ratio of trabecular compared with cortical bone (24) may also contribute to larger increases in bone resorption in trabecular bone with declining estrogen levels (i.e. there is a greater surface available for bone resorption to occur).
One can further speculate that the differential sensitivity of trabecular vs. cortical bone to estrogen is based on the specific and relatively distinct functions of the two compartments of bone. Thus, as illustrated schematically in Fig. 3, as estrogen levels fall during lactation, calcium needs to be rapidly mobilized in the mother to meet the needs of the newborn via transport into breast milk, and this may occur predominantly from trabecular bone (25). Conversely, it has been suggested that rising estrogen levels in puberty may serve to store excess calcium in bone in females (26), and this occurs predominantly in trabecular bone (27). Thus, trabecular bone needs to be responsive to estrogen over a wide dose range, and this is only possible if the threshold above which trabecular bone becomes unresponsive to estrogen is relatively high. By contrast, cortical bone, which predominates in the long bones and is critical for locomotion, needs to be preserved even in the setting of relatively low estrogen levels. Thus, it makes teleological sense for cortical bone to be very sensitive to estrogen, with a relatively low threshold for estrogen deficiency (Fig. 3). The relationships depicted in Fig. 3 also predict that estrogen deficiency from any cause (e.g. from surgical or natural menopause), which would represent moving from point A to point B in Fig. 3, should be associated with much larger decreases in trabecular compared with cortical bone, just as has been known clinically for years (28). In fact, our findings are entirely consistent with previous observations that trabecular bone is more sensitive to the effects of estrogen deficiency than cortical bone (29). In the present study, however, we have been able to demonstrate this directly using new measurements of trabecular and cortical bone as well as highly sensitive sex steroid assays.
Fig. 3.
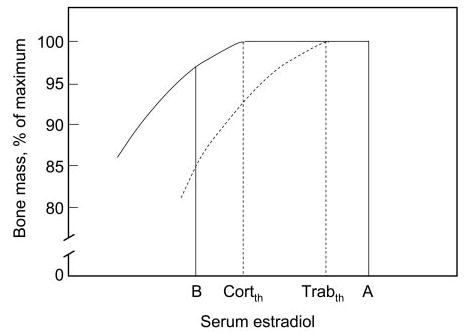
Schematic illustration of the consequences of the differing dose-response relationships between serum E2 levels and cortical (solid lines) vs. trabecular (dashed lines) bone. CortTh and TrabTh represent theoretical threshold levels for estrogen deficiency in cortical and trabecular bone, respectively. The transition from point A to point B represents estrogen deficiency as present, for example, during lactation, where there would be large decreases in trabecular bone but relatively small decreases in cortical bone. Conversely, the transition from point B to A represents puberty, where rising estrogen levels would result predominantly in increases in trabecular bone.
Our study does have several limitations. First, although we focused on relationships of vBMD and structural parameters with sex steroid levels, we recognize that there are likely other, non-sex-steroid-related factors that are different in the three groups of women that may or may not be interacting with changes in sex steroid levels. This is an inherent limitation in all association studies, and clearly direct interventional studies are needed to further test the hypotheses generated here. Second, we obtained only single measurements of sex steroid levels, which may vary over time in pre- and postmenopausal women; these one-time sex steroid measurements could underestimate the true relationships. Third, our data are cross-sectional, but we recognize that longitudinal data, which we are in the process of acquiring, are needed to further test the validity both of the estrogen-vBMD relationships we found in the present study as well as the overall concept depicted in Fig. 3. Finally, although we have postulated the presence of a threshold for skeletal estrogen deficiency that appears to be most evident in cortical bone, we recognize that this may not be an absolute estrogen level but rather a continuum over which the relationships between serum estrogen levels and BMD/rates of bone loss change. Moreover, although our data are consistent with a lower threshold for skeletal estrogen deficiency in cortical compared with trabecular bone, other explanations for our findings are also possible. For example, if cortical bone required a longer duration of reduced estrogen levels to be affected, this could certainly influence our estrogen-vBMD relationships. Again, longitudinal studies are needed to further test the hypotheses generated from this cross-sectional study.
In summary, our data provide the first analysis of the relationship between circulating sex steroid levels and cortical vs. trabecular vBMD and bone structural parameters in women. These studies also allow us to independently test, in women, hypotheses generated from analyses in men regarding estrogen dose-response relationships for trabecular and cortical bone. Collectively, our previous findings in men (6) and current data in women support the hypothesis that trabecular bone is more responsive than cortical bone to decreasing serum concentrations of estradiol. The dose-response relationships for trabecular and cortical bone generated from these studies are consistent with the clinical observation that estrogen deficiency from any cause is associated with much greater losses of trabecular compared with cortical bone (28) and with the potential functional roles of each of these compartments of bone as, for example, the importance of trabecular bone for reproduction and cortical bone for locomotion. Finally, these findings suggest that even low doses of estrogen, if they result in serum bio E2 levels above the threshold for cortical bone, may prevent cortical bone loss in women and at least attenuate trabecular bone loss.
Acknowledgments
We thank Margaret Holets for making the peripheral QCT measurements; Lisa McDaniel, R.N., and Louise McCready, R.N., for their assistance in recruitment and management of the study subjects; and Ms. Elizabeth Atkinson, M.S., for help with the statistical analyses.
Footnotes
This work was supported in part by National Institutes of Health Grants R01 AR-027065 and M01 RR00585.
References
- 1.Riggs BL, Khosla S, Melton LJ. Sex steroids and the construction and conservation of the adult skeleton. Endocr Rev. 2002;23:279–302. doi: 10.1210/edrv.23.3.0465. [DOI] [PubMed] [Google Scholar]
- 2.Khosla S, Melton LJ, Riggs BL. Estrogen and the male skeleton. J Clin Endocrinol Metab. 2002;87:1443–1450. doi: 10.1210/jcem.87.4.8417. [DOI] [PubMed] [Google Scholar]
- 3.Gennari L, Nuti R, Bilezikian JP. Aromatase activity and bone homeostasis in men. J Clin Endocrinol Metab. 2004;89:5898–5907. doi: 10.1210/jc.2004-1717. [DOI] [PubMed] [Google Scholar]
- 4.Khosla S, Melton LJ, III, Atkinson EJ, O’Fallon WM, Klee GG, Riggs BL. Relationship of serum sex steroid levels and bone turnover markers with bone mineral density in men and women: a key role for bioavailable estrogen. J Clin Endocrinol Metab. 1998;83:2266–2274. doi: 10.1210/jcem.83.7.4924. [DOI] [PubMed] [Google Scholar]
- 5.Khosla S, Melton LJ, Atkinson EJ, O’Fallon WM. Relationship of serum sex steroid levels to longitudinal changes in bone density in young versus elderly men. J Clin Endocrinol Metab. 2001;86:3555–3561. doi: 10.1210/jcem.86.8.7736. [DOI] [PubMed] [Google Scholar]
- 6.Khosla S, Melton LJ, III, Robb RA, Camp JJ, Atkinson EJ, Oberg AL, Rouleau PA, Riggs BL. Relationship of volumetric BMD and structural parameters at different skeletal sites to sex steroid levels in men. J Bone Miner Res. 2005;20:730–740. doi: 10.1359/JBMR.041228. [DOI] [PubMed] [Google Scholar]
- 7.Gennari L, Merlotti D, Martini G, Gonnelli S, Franci B, Campagna S, Lucani B, Canto ND, Valenti R, Gennari C, Nuti R. Longitudinal association between sex hormone levels, bone loss, and bone turnover in elderly men. J Clin Endocrinol Metab. 2003;88:5327–5333. doi: 10.1210/jc.2003-030736. [DOI] [PubMed] [Google Scholar]
- 8.Camp JJ, Karwoski RA, Stacy MC, Atkinson EJ, Khosla S, Melton LJ, Riggs BL, Robb RA. A system for the analysis of whole-bone strength from helical CT images. Proc SPIE. 2004;5369:74–88. [Google Scholar]
- 9.Riggs BL, Melton LJI, Robb RA, Camp JJ, Atkinson EJ, Peterson JM, Rouleau PA, McCollough CH, Bouxsein ML, Khosla S. Population-based study of age and sex differences in bone volumetric density, size, geometry, and structure at different skeletal sites. J Bone Miner Res. 2004;19:1945–1954. doi: 10.1359/JBMR.040916. [DOI] [PubMed] [Google Scholar]
- 10.Melton LJ., III History of the Rochester Epidemiology Project. Mayo Clin Proc. 1996;71:266–274. doi: 10.4065/71.3.266. [DOI] [PubMed] [Google Scholar]
- 11.Cann CE. Quantitative CT for determination of bone mineral density: a review. Radiology. 1988;166:509–522. doi: 10.1148/radiology.166.2.3275985. [DOI] [PubMed] [Google Scholar]
- 12.Kalender WA, Felsenberg D, Genant HK, Fischer M, Dequeker J, Reeve J. The European spine phantom: a tool for standardization and quality control in spinal bone mineral measurements by DXA and QCT. Eur J Radiol. 1995;20:83–92. doi: 10.1016/0720-048x(95)00631-y. [DOI] [PubMed] [Google Scholar]
- 13.O’Connor S, Baker HWG, Dulmanis A, Hudson B. The measurement of sex steroid binding globulin by differential ammonium sulphate precipitation. J Steroid Biochem. 1973;4:331–339. doi: 10.1016/0022-4731(73)90002-2. [DOI] [PubMed] [Google Scholar]
- 14.Tremblay RR, Dube JY. Plasma concentrations of free and non-TeBG bound testosterone in women on oral contraceptives. Contraception. 1974;10:599–605. doi: 10.1016/0010-7824(74)90099-7. [DOI] [PubMed] [Google Scholar]
- 15.Venables WN, Ripley BD 1994 Modern applied statistics with S-Plus. New York: Springer-Verlag; 247–254
- 16.Stone K, Bauer DC, Black DM, Sklarin P, Ensrud KE, Cummings SR. Hormonal predictors of bone loss in elderly women: a prospective study. J Bone Miner Res. 1998;13:1167–1174. doi: 10.1359/jbmr.1998.13.7.1167. [DOI] [PubMed] [Google Scholar]
- 17.Greendale GA, Edelstein S, Barrett-Connor E. Endogenous sex steroids and bone mineral density in older women and men: the Rancho Bernardo study. J Bone Miner Res. 1997;12:1833–1843. doi: 10.1359/jbmr.1997.12.11.1833. [DOI] [PubMed] [Google Scholar]
- 18.Falahati-Nini A, Riggs BL, Atkinson EJ, O’Fallon WM, Eastell R, Khosla S. Relative contributions of testosterone and estrogen in regulating bone resorption and formation in normal elderly men. J Clin Invest. 2000;106:1553–1560. doi: 10.1172/JCI10942. [DOI] [PMC free article] [PubMed] [Google Scholar]
- 19.Leder BZ, LeBlanc KM, Schoenfeld DA, Eastell R, Finkelstein JS. Differential effects of androgens and estrogens on bone turnover in normal men. J Clin Endocrinol Metab. 2003;88:204–210. doi: 10.1210/jc.2002-021036. [DOI] [PubMed] [Google Scholar]
- 20.Bord S, Horner A, Beavan S, Compston J. Estrogen receptors α and β are differentially expressed in developing human bone. J Clin Endocrinol Metab. 2001;86:2309–2314. doi: 10.1210/jcem.86.5.7513. [DOI] [PubMed] [Google Scholar]
- 21.Onoe Y, Miyaura C, Ohta H, Nozawa S, Suda T. Expression of estrogen receptor β in rat bone. Endocrinology. 1997;138:4509–4512. doi: 10.1210/endo.138.10.5575. [DOI] [PubMed] [Google Scholar]
- 22.Moedder UI, Sanyal A, Kearns AE, Sibonga JD, Nishihara E, Xu J, O’Malley BW, Ritman EL, Riggs BL, Spelsberg TC, Khosla S. Effects of loss of steroid receptor coactivator-1 on the skeletal response to estrogen in mice. Endocrinology. 2004;145:913–921. doi: 10.1210/en.2003-1089. [DOI] [PubMed] [Google Scholar]
- 23.Hall JM, McDonnell DP. The estrogen receptor β-isoform (ERβ) of the human estrogen receptor modulates ERα transcriptional activity and is a key regulator of the cellular response to estrogens and antiestrogens. Endocrinology. 1999;140:5566–5578. doi: 10.1210/endo.140.12.7179. [DOI] [PubMed] [Google Scholar]
- 24.Parfitt AM. Misconceptions (2): turnover is always higher in cancellous than in cortical bone. Bone. 2002;30:807–809. doi: 10.1016/s8756-3282(02)00735-4. [DOI] [PubMed] [Google Scholar]
- 25.Ritchie LD, Fung EB, Halloran BP, Turnlund JR, Van Loan M, Cann CE, King JC. A longitudinal study of calcium homeostasis during human pregnancy and lactation and after resumption of menses. Am J Clin Nutr. 1998;67:693–701. doi: 10.1093/ajcn/67.4.693. [DOI] [PubMed] [Google Scholar]
- 26.Jarvinen TLN, Kannus P, Sievanen H. Estrogen and bone: a reproductive and locomotive perspective. J Bone Miner Res. 2003;18:1921–1931. doi: 10.1359/jbmr.2003.18.11.1921. [DOI] [PubMed] [Google Scholar]
- 27.Gilsanz V, Skaggs DL, Kovanlikaya A, Sayre J, Loro ML, Kaufman F, Korenman SG. Differential effect of race on the axial and appendicular skeletons of children. J Clin Endocrinol Metab. 1998;83:1420–1427. doi: 10.1210/jcem.83.5.4765. [DOI] [PubMed] [Google Scholar]
- 28.Genant HK, Cann CE, Ettinger B, Gordan GS. Quantitative computed tomography of vertebral spongiosa: a sensitive method for detecting early bone loss after oophorectomy. Ann Intern Med. 1982;97:699–705. doi: 10.7326/0003-4819-97-5-699. [DOI] [PubMed] [Google Scholar]
- 29.Riggs BL, Melton LJ. Medical progress series: involutional osteoporosis. N Engl J Med. 1986;314:1676–1686. doi: 10.1056/NEJM198606263142605. [DOI] [PubMed] [Google Scholar]