Abstract
Outbreaks of disease due to acid-tolerant bacterial pathogens in apple cider and orange juice have raised questions about the safety of acidified foods. Using gluconic acid as a noninhibitory low-pH buffer, we investigated the killing of Escherichia coli O157:H7 strains in the presence or absence of selected organic acids (pH of 3.2), with ionic strength adjusted to 0.60 to 0.68. During a 6-h exposure period in buffered solution (pH 3.2), we found that a population of acid-adapted E. coli O157:H7 strains was reduced by 4 log cycles in the absence of added organic acids. Surprisingly, reduced lethality for E. coli O157:H7 was observed when low concentrations (5 mM) of fully protonated acetic, malic, or l-lactic acid were added. Only a 2- to 3-log reduction in cell counts was observed, instead of the 4-log reduction attributed to pH effects in the buffered solution. Higher concentrations of these acids at the same pH aided in the killing of the E. coli cells, resulting in a 6-log or greater reduction in cell numbers. No protective effect was observed when citric acid was added to the E. coli cells. d-Lactic acid had a greater protective effect than other acids at concentrations of 1 to 20 mM. Less than a 1-log decrease in cell numbers occurred during the 6-h exposure to pH 3.2. To our knowledge, this is the first report of the protective effect of organic acids on the survival of E. coli O15:H7 under low-pH conditions.
Organic acids are weak acids that are commonly found in fruit juices and fermented foods and that are added to foods as preservative agents (17). Acid and acidified foods are defined in the U.S. Code of Federal Regulations (21 CFR part 114) as foods having a pH of 4.6 or lower. Acid foods are foods that naturally have a pH below 4.6, while acidified foods are foods to which acid or acid food ingredients are added to reach the final equilibrated pH of 4.6 or lower. For acidified foods, a treatment must be applied if needed to destroy microbial pathogens (21 CFR part 114). Current FDA regulations for acidified foods do not take into account the amount or type of organic acid needed to lower pH. Acid or fermented foods such as apple cider (1), salami (8), and apple juice (9, 11) have recently been associated with outbreaks of disease caused by Escherichia coli O157:H7. These outbreaks have raised concern about the safety of acidified foods in general. While acidified foods have an excellent safety record, a better understanding of the microbial response to organic acids in foods is needed.
It is generally believed that the antimicrobial species of organic acids are fully protonated species which can freely cross cell membranes (2, 4, 19, 21). Other factors affecting the antimicrobial activity of organic acids include pH, acid concentration, and ionic strength as well as the bacterial strains and environment (growth phase, induced acid resistance, and temperature) of the microbial cultures (5, 10, 12, 14). In previous studies, comparisons of the effects of organic acids on killing bacteria have given conflicting results in the literature. For example, Ryu et al. (18) reported that acetic was the most lethal acid to E. coli O157:H7, followed by lactic, citric, and malic acids, when tested over a range of pH values. Cheng et al. (10) found that lactic acid was more lethal than acetic acid for E. coli O157:H7. These differences may result from different conditions used for the experiments.
Inducible acid resistance in E. coli must also be considered when studying the antimicrobial effects of organic acids. Buchanan and Edelson (6) reported that culturing E. coli statically in the presence of glucose will induce acid resistance. There are at least four overlapping acid resistance systems in E. coli, including the glucose-repressed system and the three amino acid decarboxylase systems (7, 16).
The objective of this study was to examine the effect of the organic acids that are commonly found in acid and acidified foods on E. coli O157:H7. A unique feature of this study was the use of gluconic acid as a noninhibitory buffer, which allowed a direct comparison of the specific effects of selected organic acids over a range of concentrations relative to the effects of pH alone (3). By controlling other environmental variables, including ionic strength (using NaCl) and temperature, the specific effects of different organic acids under otherwise identical conditions were compared. We found that, under selected conditions, low concentrations of protonated organic acids can have a protective effect on the survival of E. coli O157:H7 relative to the effect of pH alone.
MATERIALS AND METHODS
Bacteria and growth media.
The five E. coli O157:H7 strains used in this study were E. coli B202 (serotype O157:H7, ATCC 4388), E. coli B201 (serotype O157:H7, apple cider isolate), E. coli B203 (serotype O157:H7, salami isolate), E. coli B203 (serotype O157:H7, ground beef isolate), and E. coli 204 (serotype O157:H7, pork isolate), kindly provided by the Silliker Labs Culture Collection (Silliker Labs Group, Inc., Homewood, IL). Bacterial strains were grown in tryptic soy broth (TSB) or tryptic soy agar (TSA) (Difco Laboratories, Franklin Lakes, NJ) supplemented with 1 g/liter glucose (Sigma Chemical Co., St. Louis, MO) and referred to as TSBG or TSAG, respectively. For the acid challenge experiment, the strains were grown separately in 10 ml TSBG for 18 h at 37°C to induce acid resistance (5). Overnight cultures were centrifuged, resuspended in 3 ml of 8.5 g/liter NaCl (saline), and combined. The strain mixture was washed once with saline and resuspended in 3 ml saline. The mixed culture was diluted 10-fold by adding 20 μl to 180 μl acid solution (described below) in a 96-well microplate (nontissue culture-treated flat-bottom plate, catalog no. 351172; Falcon, Franklin Lakes, NJ). The initial cell count was approximately 8 × 10⁹ CFU/ml. Cell viability was determined following dilution and plating on nonselective media (TSBG) with a spiral plater (model 4000; Spiral Biotech, Inc., Norwood, MA) and an automated plate reader (QCount; Spiral Biotech).
Acid challenge conditions.
Acid solutions (pH 3.2) of acetic acid (0.01 to 50 mM), malic acid (0.01 to 80 mM), citric acid (0.01 to 60 mM), and d- and l-lactic acids (0.1 to 40 mM; Sigma Chemical Co., St. Louis, MO) were prepared in water; the final concentration refers to the amount of the fully protonated acid species present in solution at a pH of 3.2. Sodium gluconate (pKa = 3.6) was used as a noninhibitory buffer in all acid solutions at 20 mM (total acid concentration) (3). Ionic strength was maintained in the range of 0.6 to 0.68 M by the addition of NaCl. Because there may be significant deviations from the published pKa values, primarily due to ionic strength, we used pHTools software (13) or custom Matlab routines (F. Breidt, Jr., unpublished data) to adjust the pK values and calculate protonated acid and acid anion concentrations. Acid solutions were adjusted to give the indicated concentrations in the final 200-μl volume of the microtiter plate wells with cells (as described above). The concentrations of acetic, malic, citric, and lactic (d or l) acids in the acid treatment solutions were confirmed by high-performance liquid chromatography (HPLC) (see biochemical analysis below) for the acid solutions before and after exposure of the bacterial cells. Prior to adding cells, the microtiter plates were incubated at 25°C for approximately 1 h to ensure temperature equilibration. Initial and final cell numbers after 6 h of incubation were determined by plating the appropriate dilution on nonselective medium as described above. The E. coli cells were immediately diluted at least 10-fold in 0.1 M morpholinepropanesulfonic acid (MOPS) buffer (pH 7.2) (Sigma) with 0.85% saline to neutralize pH prior to plating. The lower limit for detection of bacterial cells by this method was approximately 4,000 CFU/ml. For survival curves of E. coli O157:H7 in acid solutions, cells were prepared as described above. A 10-fold dilution of the cell suspensions in saline was added to the acid solutions (0.3 to 2.7 ml) in 15-ml plastic screw-cap test tubes (Corning, Big Flats, NY) at a pH of 3.2 and 25°C. Samples were taken periodically for 9 h and serially diluted in MOPS buffer, and viable cells were determined as described above.
Biochemical analysis.
Organic acid concentrations were measured using a Thermo Separation Products HPLC system (ThermoQuest, Inc., San Jose, CA) consisting of a P2000 pump, SCM100 solvent degasser, AS3000 autosampler, and UV6000 diode array detector (ThermoQuest). A Bio-Rad HPX-87H column, 300 mm by 7.8 mm (Bio-Rad Laboratories, Hercules, CA), was used to resolve citric, malic, lactic, gluconic, and acetic acids. The operating conditions of the system included the following: sample tray at 6°C, column at 75°C, and 0.03 N H2SO4 eluent at 1 ml/min flow rate. The UV6000 detector was set to 210 nm at a rate of 1 Hz for data collection. ChromQuest (version 4.1) chromatography software was used to control the system and analyze the data. The peak heights were used for quantitative integration.
Statistical analysis.
Log reduction values (6 h) for viable cells were determined by the difference of the final count (N) from the initial number (N0) [log10 (No/N)]. The regression line, d values, and the standard error for the survival curve data were calculated using Microsoft Excel. Statistical inferences for 6-h log reduction values were calculated using a general linear models procedure (Proc GLM) with the Tukey adjustment (SAS Institute Inc., Cary, NC), and log numbers were used. Each experiment was done for at least three independent replicates.
RESULTS
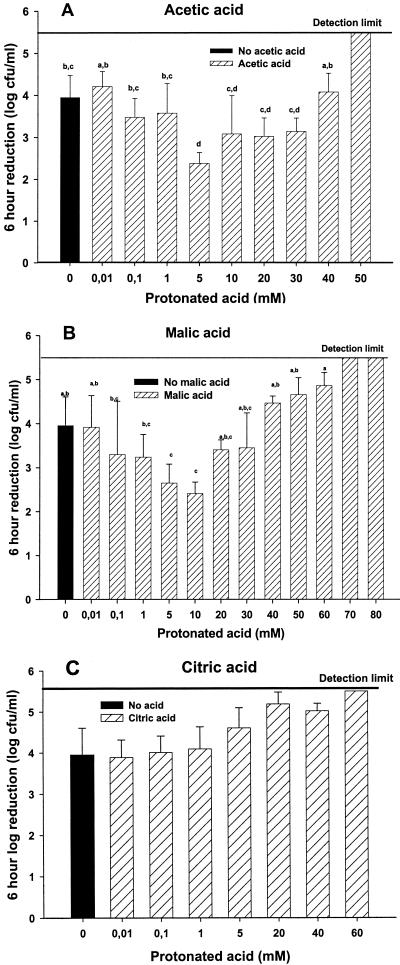
The survival of the E. coli O157:H7 multistrain cocktail in the presence of organic acids (pH 3.2) at 25°C and an ionic strength of 0.60 to 0.68 M was compared to pH alone with gluconic acid as a noninhibitory buffer (3). No significant difference (P < 0.05) in cell survival was observed between the pH effect alone and the combined effects of pH and low protonated acid concentrations (0.01 to 1 mM) of acetic acid after 6 h. Surprisingly, at a 5 mM protonated acid concentration, a significant (P > 0.05) 1-log increase in survival of the E. coli O157:H7 strains was observed (Fig. 1A). Survival of the cells decreased as the protonated acid concentrations increased above 5 mM. The effect of malic acid on E. coli O157:H7 was similar to that of acetic acid (Fig. 1B). A significant increase (P > 0.05) in survival was observed at 5 and 10 mM protonated acid concentrations; higher concentrations up to 60 to 70 mM resulted in a 5-log or greater reduction in cell numbers at 6 h. In contrast, at a pH of 3.2, fully protonated citric acid had no protective effect on the five E. coli O157:H7 strains (Fig. 1C).
FIG. 1.
A log reduction (6 h) of Escherichia coli strain mixture with and without acetic acid (A), malic acid (B), and citric acid (C) at 25°C and a pH of 3.2. Ionic strength was held constant at 0.60 to 0.68 M by adding NaCl. The error bars represent the standard deviations for three or more trials. The identical letters over the error bars indicate no significant difference between treatments (P > 0.05).
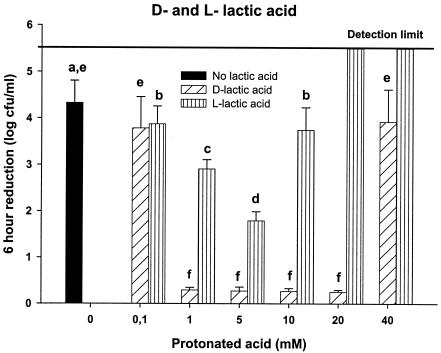
When the d and l isomers of lactic acid were tested separately, different effects on the survival of the E. coli O157:H7 cells in the multistrain mixture were observed (Fig. 2). E. coli O157:H7 cells treated with l-lactic acid exhibited a survival pattern similar to those seen with acetic acid and malic acid. Cells treated with d-lactic acid, however, showed significant increases in survival (P < 0.05) compared to those for the other acids tested. Less than a 1-log reduction in cell counts was observed with 1 to 20 mM d-lactic acid, compared to a 4-log reduction in the control treatments with the gluconic acid buffer alone (Fig. 2).
FIG. 2.
A log reduction (6 h) of E. coli strain mixture in d-lactic acid, l-lactic acid, or without added acid at 25°C and a pH of 3.2. Ionic strength was held constant at 0.60 to 0.68 M by adding NaCl. The error bars represent the standard deviations for three or more trials. The identical letters over the error bars indicate no significant difference between treatments (P > 0.05).
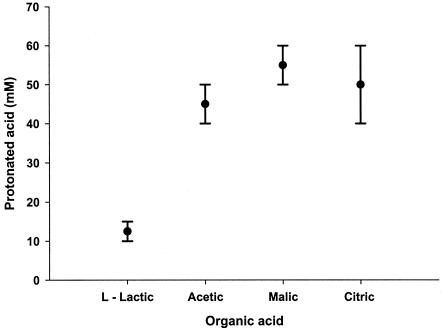
To directly compare the lethal effects of l-lactic, acetic, citric, and malic acids, we determined the protonated acid concentrations required to give a 5-log reduction in cell numbers of the cocktail of E. coli O157:H7 strains (Fig. 3). l-Lactic acid was the most lethal of the acids tested, requiring 12.5 ± 2.5 mM protonated acid. Interestingly, acetic, malic, and citric acids all had similar lethal effects on the five E. coli O157:H7 strains, exhibiting a 5-log reduction in cell numbers with 45 ± 5, 55 ± 5, and 50 ± 10 mM protonated acid, respectively.
FIG. 3.
Comparison of the killing effect of organic acids based on the concentration required to reduce initial count of E. coli O157:H7 by 5 logs in 6 h at 25°C and a pH of 3.2. Each acid was tested over a wide range of concentrations, and the concentration range required to reduce the initial count by 5 logs in 6 h was determined. Points represent median values of the range, indicated by the bars. Ionic strength was held constant at 0.60 to 0.68 M by adding NaCl.
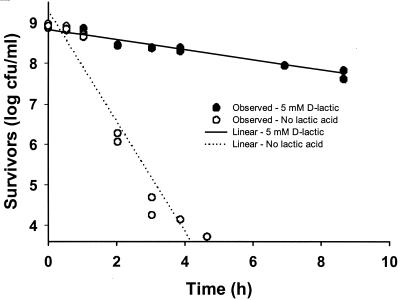
The individual strains of E. coli O157:H7 used in the cocktail in the experiments described above were not significantly different from each other in the protective effect of 5 mM d-lactic acid (data not shown). The average 5-log reduction time for the d-lactic acid-treated cells was 0.45 ± 0.41 log CFU/ml compared to 4.5 ± 0.67 log CFU/ml for the cells in gluconic acid buffer. Figure 4 shows the reduction in cell numbers for strain 202, isolated from an outbreak associated with salami, over a 9-h period at a pH of 3.2 with and without 5 mM of protonated d-lactic acid. Using a linear model, d values were 7.2 h (R2 = 0.9559) for d-lactic acid, compared to 0.7353 h (R2 = 0.9319) for the control solution containing only the gluconic acid buffer.
FIG. 4.
Survival curves of E. coli O157:H7 strain 202 at 25°C (pH 3.2) with (closed circles) and without (open circles) 5 mM protonated d-lactic acid. Survival data were modeled with a linear model for two independent trials.
To determine if the acids were taken up by the cells and metabolized during the acid challenge, HPLC analyses were performed with samples taken before and after the challenge with bacterial cells. Results indicate no significant reduction in the citric or l-lactic acid during 6 h of incubation at a pH of 3.2 and 25°C (P > 0.05) (Table 1), while decreases of 10% or less were seen with acetic, malic (data not shown), and d-lactic acids (P < 0.05) (Table 1). The results do not give clear indications that these acids are being metabolized during the acid challenge. The 10% reduction that occurred for acetic, malic, and d-lactic acids could simply be lost during sample preparation.
TABLE 1.
d- and l-lactic acid concentrations before and after incubation with E. coli O157:H7 cellsa
| Expt. no. |
l-Lactic acid (mM)
|
d-Lactic acid (mM)
|
||
|---|---|---|---|---|
| Before | After | Before | After | |
| 1 | 0.18 (0.01) | 0.18 (0.02) | 0.2 (0.0) | 0.04 (0.0) |
| 2 | 7.0 (0.2) | 6.7 (0.7) | 6.8 (0.1) | 5.4 (0.0) |
| 3 | 14.0 (0.4) | 14.0 (0.6) | 13.5 (0.1) | 12.2 (0.1) |
Average and standard deviations are in parentheses of two to three replicates.
DISCUSSION
Published pKa values for acids are generally reported for conditions of 25°C and zero ionic strength (in water). The pKa values change in response to temperature and ionic strength. In our experiments, temperature was held constant at 25°C and ionic strength was held within a range between 0.6 and 0.68 M, including the contributions of acid anions, using NaCl. Acid concentrations could then be adjusted to all the values used in our experiments without exceeding this target range. At ionic strength values in this range, however, the pKa adjustments can be in excess of 0.5 units and substantially affect the distribution of acid species. Reliable adjustments of pKa values can be calculated up to an ionic strength of 1.2 M with a modification of the Davies equation developed by Samson et al. (20). This method was used to calculate the distribution of the various species of an acid in solution. Other factors that could possibly affect the antimicrobial activity of organic acids, including pH and temperature, were held constant to compare the acids on equal bases (12). It is generally believed that the fully protonated species of organic acids can diffuse into the bacterial cells, and cause cell death (2, 4, 21).
Gluconic acid is a highly polar molecule which is apparently unable to penetrate the cell membrane (3). Previously, we have shown that the antimicrobial activity of gluconic acid solutions between pH 3.0 and 4.0 is due to the pH effect alone (3). Therefore, gluconic acid can be used over a wide range of concentrations (0.2 to 200 mM) as a noninhibitory buffer (3). In this study, we used pH 3.2 to allow a range of acid concentrations to be tested without exceeding 0.60 to 0.68 M ionic strength due to the acid anion contribution to ionic strength. Under these conditions, the reduction in cell counts for E. coli O157:H7 strains due to the specific effects of lactic, citric, malic, and acetic acids could be measured and compared to the effect of pH alone. Unexpectedly, acetic, malic, and l-lactic acids all exhibited some protective effect around 5 to 10 mM of undissociated acid concentrations. No protective effect was seen with citric acid at similar concentrations. Similar results have been observed for acetic acid (pH 3.1), where an increase in Dp values (log reduction for a population) occurred with 20 mM protonated acid (3).
d-Lactic acid had the greatest protective effect at the lowest concentration (1 mM) among the acid concentrations tested. l- and d-lactate are metabolized by different enzymes in E. coli (15). At higher concentrations (10 to 60 mM), l-lactic acid was found to be the most lethal of the four acids tested at pH 3.2, which is in agreement with the results of Buchanan and Edelson (6). Conner and Kotrola (12) reported that acetic and lactic acids were the least inhibitory to E. coli O157:H7 relative to citric acid, malic acid, mandelic acid, and tartaric acid. In their study, however, both pH and the concentration of the protonated acids varied.
We have shown that, compared to pH, acetic, malic, and l-lactic acids can have protective effects (1- to 2-log increases in survival) on the survival of E. coli O157:H7 at concentrations between 5 and 10 mM. d-Lactic acid was found to have a greater protective effect (approximately a 4-log increase in survival) over a wider range of concentrations, from 1 to 20 mM. Citric acid was not found to exhibit any protective effect at similar concentrations. Additional research will be needed to understand acid specific effects on the survival of E. coli O157:H7 and other acid-resistant food pathogens in acid and acidified foods.
Acknowledgments
We thank Roger Thompson for help with statistical and HPLC analysis of the data and SRCC for kindly providing the five E. coli O157:H7 strains.
Mention of a trademark or proprietary product does not constitute a guarantee or warranty of the product by the U.S. Department of Agriculture or North Carolina Agricultural Research Service, nor does it imply approval to the exclusion of other products that may be suitable.
Footnotes
Paper no. FSR04-37 of the Journal Series of the Department of Food Science, NC State University, Raleigh, NC 27695-7624.
REFERENCES
- 1.Besser, R. E., S. M. Let, J. T. Weber, M. P. Doyle, T. J. Barrett, J. G. Wells, and P. M. Griffin. 1993. An outbreak of diarrhea and hemolytic-uremic syndrome from Escherichia coli O157:H7 in fresh-pressed apple cider. JAMA 269:2217-2220. [PubMed] [Google Scholar]
- 2.Booth, I. R., and R. G. Kroll. 1989. The preservation of foods by low pH, p. 119-160. In G. W. Gould (ed.). Mechanisms of action of food preservation procedures. Elsevier Science Publishers, New York, N.Y.
- 3.Breidt, F., Jr., J. S. Hayes, and R. F. McFeeters. 2004. The independent effects of acetic acid and pH on the survival of Escherichia coli O157:H7 in simulated acidified pickle products. J. Food Prot. 67:12-18. [DOI] [PubMed] [Google Scholar]
- 4.Brul, S., and P. Coote. 1999. Preservative agents in foods: mode of action and microbial resistance mechanism. Int. J. Food Microbiol. 50:1-17. [DOI] [PubMed] [Google Scholar]
- 5.Buchanan, R. L., and S. G. Edelson. 1996. Culturing enterohemorrhagic Escherichia coli in the presence and absence of glucose as a simple means of evaluating the acid tolerance of stationary-phase cells. Appl. Environ. Microbiol. 62:4009-4013. [DOI] [PMC free article] [PubMed] [Google Scholar]
- 6.Buchanan, R. L., and S. G. Edelson. 1999. pH-dependent stationary-phase acid resistance response of enterohemorrhagic Escherichia coli in the presence of various acidulants. J. Food Prot. 62:211-218. [DOI] [PubMed] [Google Scholar]
- 7.Castanie-Cornet, M.-P., T. A. Penfound, D. Smith, J. F. Elliott, and J. W. Foster. 1999. Control of acid resistance in Escherichia coli. J. Bacteriol. 181:3525-3535. [DOI] [PMC free article] [PubMed] [Google Scholar]
- 8.CDC. 1994. Escherichia coli O157:H7 outbreak linked to commercially distributed dry-cured salami—Washington and California, 1994. Morb. Mortal. Wkly. Rep. 44:157-160. [PubMed] [Google Scholar]
- 9.CDC. 1997. Outbreak of Escherichia coli O157:H7 infection associated with drinking unpasteurized commercial apple juice—British Columbia, California, Colorado, and Washington, October 1997. Morb. Mortal. Wkly. Rep. 46:4-8. [PubMed] [Google Scholar]
- 10.Cheng, H. Y., R.-C. Ye, and C.-C. Chou. 2003. Increased acid tolerance of Escherichia coli O157:H7 by acid adaptation time and conditions of acid challenge. Food Res. Int. 36:49-56. [Google Scholar]
- 11.Cody, S. H., M. K. Glynn, J. A. Farrar, K. L. Cairns, P. M. Griffin, J. Kobayashi, M. Fyfe, B. Swaminathan, and D. J. Vugia. 1999. An outbreak of Escherichia coli O157:H7 infection from unpasteurized commercial apple juice. Ann. Intern. Med. 130:202-209. [DOI] [PubMed] [Google Scholar]
- 12.Conner, D. E., and J. S. Kotrola. 1995. Growth and survival of Escherichia coli O157:H7 under acidic conditions. Appl. Environ. Microbiol. 61:382-385. [DOI] [PMC free article] [PubMed] [Google Scholar]
- 13.Dougherty, D. P. 2002. Deterministic and semi-mechanistic approaches in predictive fermentation microbiology. Ph.D. thesis. North Carolina State University, Raleigh, North Carolina.
- 14.Entani, E., M. Asai, S. Tsujihata, Y. Tsukamoto, and M. Ohta. 1998. Antibacterial action of vinegar against food-borne pathogenic bacteria including Escherichia coli O157:H7. J. Food Prot. 61:953-959. [DOI] [PubMed] [Google Scholar]
- 15.Felisa, M., O. Kwon, T. H. Wilson, J. Aguilar, L. Baldoma, and E. C. C. Lin. 2002. Transport of L-lacate, D-lactate, and glycolate by the LldP and GlcA membrane carriers of Escherichia coli. Biochem. Biophys. Res. Commun. 290:824-829. [DOI] [PubMed] [Google Scholar]
- 16.Guilfoyle, D. E., and I. N. Hirshfield. 1996. The survival benefit of short-chain organic acids and the inducible arginine and lysine decarboxylase genes for Escherichia coli. Lett. Appl. Microbiol. 22:393-396. [DOI] [PubMed] [Google Scholar]
- 17.Lück, E., and M. Jager. 1997. Antimicrobial food additives: characteristics, uses, effects, p. 137-144, 239. Springer-Verlag, Berlin, Germany. [Google Scholar]
- 18.Ryu, J. H., Y. Deng, and L. R. Beuchant. 1999. Behavior of acid-adapted and unadapted Escherichia coli O157:H7 when exposed to reduced pH achieved with various organic acids. J. Food Prot. 62(5):451-455. [DOI] [PubMed] [Google Scholar]
- 19.Salmond, C. V., R. G. Kroll, and I. R. Booth. 1984. The effect of food preservatives on pH homeostasis in Escherichia coli. J. Gen. Microbiol. 130:2845-2850. [DOI] [PubMed] [Google Scholar]
- 20.Samson, E., G. Lemaire, J. Marchand, and J. Beaudion. 1999. Modeling chemical activity effects in strong ionic solutions. Comp. Mater. Sci. 15:285-294. [Google Scholar]
- 21.Stradford, M., and P. A. Anslow. 1998. Evidence that sorbic acid does not inhibit yeast as a classic ‘weak acid preservative.’ Lett. Appl. Microbiol. 27:2. [DOI] [PubMed] [Google Scholar]


