

Abstract
Chromium (VI) is toxic to microorganisms and can inhibit the biodegradation of organic pollutants in contaminated soils. We used microcosms amended with either glucose or protein (to drive bacterial community change) and Fe(III) (to stimulate iron-reducing bacteria) to study the effect of various concentrations of Cr(VI) on anaerobic bacterial communities. Microcosms were destructively sampled based on microbial activity (measured as evolution of CO2) and analyzed for the following: (i) dominant bacterial community by PCR-denaturing gradient gel electrophoresis (DGGE) of the 16S rRNA gene; (ii) culturable Cr-resistant bacteria; and (iii) enrichment of iron-reducing bacteria of the Geobacteraceae family by real-time PCR. The addition of organic C stimulated the activities of anaerobic communities. Cr(VI) amendment resulted in lower rates of CO2 production in glucose microcosms and a slow mineralization phase in protein-amended microcosms. Glucose and protein amendments selected for different bacterial communities. This selection was modified by the addition of Cr(VI), since some DGGE bands were intensified and new bands appeared in Cr(VI)-amended microcosms. A second dose of Cr(VI), added after the onset of activity, had a strong inhibitory effect when higher levels of Cr were added, indicating that the developing Cr-resistant communities had a relatively low tolerance threshold. Most of the isolated Cr-resistant bacteria were closely related to previously studied Cr-resistant anaerobes, such as Pantoea, Pseudomonas, and Enterobacter species. Geobacteraceae were not enriched during the incubation. The studied Cr(VI)-contaminated soil contained a viable anaerobic bacterial community; however, Cr(VI) altered its composition, which could affect the soil biodegradation potential.
Chromium is a priority pollutant in the United States (14) due to the toxicity and carcinogenicity of its hexavalent form [Cr(VI)]. Chromium is often found in contaminated soils mixed with other heavy metals and organic pollutants. Because Cr(VI) is toxic to the microbial community in the soil, it could also inhibit biodegradation of organic pollutants in cocontaminated sites, as has been found for other heavy metals (31, 35). While the effect of Cr on aerobic microbial communities has been extensively studied (24, 41, 44), there is little information on anaerobic soil communities (40).
Chromium(VI) in soils can be reduced chemically or through the activity of soil microorganisms (14). Chromium reduction is of special interest, because toxic and mobile Cr(VI) is transformed into relatively less-toxic and insoluble Cr(III). Most research on anaerobic Cr reduction has focused on the biotechnological application of pure cultures that can reduce Cr(VI) (27, 28, 36). However, in soil a complex microbial community may possess a variety of mechanisms to tolerate Cr stress. The anaerobic degradation potential for complex organic substrates in chromium-polluted soils may be a function of (i) microorganisms that can reduce chromium and detoxify it, (ii) microorganisms that are chromium resistant and can perform their metabolic activity in the presence of chromium, and (iii) microorganisms that are chromium sensitive but can survive the presence of chromium in the soil and perform their metabolic activity once chromium has been reduced. The extent to which such communities can develop in chromium-polluted soils is unclear.
In this study, the effect of chromium(VI) on anaerobic bacterial communities was examined with microcosms constructed with soils contaminated with chromium, lead, and organic solvents for more than 40 years. We amended microcosms with organic substrates as an energetic force to drive changes in the microbial community and with Fe(III) to stimulate a specific physiological group: the iron-reducing bacteria (IRB). The experimental strategy was designed to address the following effects of Cr(VI) amendments: (i) the activity potential of anaerobic bacterial communities adapted to a long period of contamination, (ii) the interactions between different physiological types of anaerobes (fermentative versus iron-reducing bacteria), and (iii) the selection for Cr-resistant bacteria in the amended soils.
MATERIALS AND METHODS
Soil collection.
Soil used for the microcosm experiments was collected in September 2003 from an Indiana Department of Transportation property in Seymour, Ind., which was used for disposal of waste road paint and cleaning solvents in the late 1960s to early 1970s. The soils at this site have been previously described as sandy to sandy loams, which contain on the average 3.1% organic carbon, 1,815 mg kg−1 nitrogen, and 275 mg kg−1 phosphorus (13). Samples used in this study were contaminated with Pb (1,156 μg−1 soil), Cr (5,868 μg−1 soil), and petroleum hydrocarbons (toluene and xylenes: >200 μg g−1 soil). Soil was transported under refrigeration and was immediately sieved through a 2-mm sieve and stored at 4°C.
Soil microcosms.
Each microcosm (sterilized 105-ml serum vials) received the equivalent of 10 g dry soil and approximately 6 ml of liquid, which was adequate to oversaturate the soil. Treatment variables were additions of (i) an organic energy source (glucose or the protein gelatin) to act as a driving force for community change, (ii) a terminal electron acceptor [Fe (III)], and (iii) Cr(VI) at concentrations that produced acute reductions of microbial activity of 33, 50, or 75% (determined in preliminary experiments). There were a total of 14 treatments: 7 for glucose (G) and 7 for protein (P). Five treatments received organic carbon: (i) G (glucose) and P (protein) received only the carbon source, (ii) GF and PF received the carbon source plus Fe(III), (iii) GFL and PFL received 140 μg Cr(VI) g−1 soil in addition to the carbon source and Fe(III), (iv) GFM and PFM received 240 μg Cr(VI) g−1 soil in addition to the carbon source and Fe(III), and (v) GFH and PFH received 340 μg Cr(VI) g−1 soil in addition to the carbon source and Fe(III). The two control treatments received either Fe(III) only or no chemical additions at all. Vials were incubated in the dark at 20°C.
Glucose or protein was added at a concentration of 3 mg g−1 dry soil. Iron(III) was added as poorly crystalline Fe(III) oxide (FeOOH) (18) to a final concentration of 100 mM. Cr(VI) was added from a sterile, anoxic stock (1 M) solution of potassium chromate. All chemicals met American Chemical Society specifications and were purchased from Malinkrodt Baker, Paris, KY (glucose and FeCl3) or Sigma-Aldrich, St. Louis, MO (potassium chromate). In treatments which did not require specific amendments, an equal volume of sterile anoxic water was substituted. All additions were done under constant flushing with 100% nitrogen gas, and the vials were then sealed with gray butyl rubber stoppers and aluminum crimps.
Activity measurements.
CO2 evolution from microcosm soils was measured using headspace samples collected with a syringe at 2- to 7-day intervals. CO2 was assayed by a gas chromatograph (HP 5890 series II) equipped with a thermal conductivity detector and fitted with a 0.32-cm by 61-cm PorepakQ column (Alltech, Deerfield, IL) with 80/100 mesh packing. Temperatures used were the following: oven temperature of 45°C for 2 min and then ramp to 110°C at rate of 30°C min−1; injector temperature of 60°C; and detector temperature of 56°C.
Sampling regime.
Soils in carbon-amended microcosms were destructively sampled four times based on the pattern of CO2 evolution. For each experimental treatment that received carbon, there were 12 replicate vials; 3 vials were sampled per time point. All treatments were sampled at T1 (48 h after initiation). Treatment-specific sampling times were T2 (at inception of substrate-induced mineralization), T3 (during maximum rate of CO2 production), and T4 (when CO2 production leveled off). We chose to sample on a treatment-specific basis because that facilitated comparison of microbial communities at similar stages of development. Treatments that lacked added carbon were sampled in duplicate at 48 h and whenever Cr-amended microcosms were sampled at T3, as well as at the end of the experiment, for a total of five sampling times per treatment.
Microcosms were sampled by transferring all soil and liquid into sterile 15-ml polystyrene tubes. An aliquot of the liquid was taken and immediately used to measure the concentration of Cr(VI), and the rest was then frozen at −20°C. Samples from microcosms amended with medium levels of Cr (240 μg g−1) were taken prior to freezing and used to isolate Cr-resistant bacteria.
Readdition of Cr(VI).
To determine if the initial addition of Cr selected for adapted microbial communities, some microcosms were subjected to a second addition of Cr(VI). For all carbon and metal combinations (three for glucose and three for protein), a second set of six microcosms was created. When activity in those microcosms was detectable (T2), a second dose of Cr(VI) was added. Soils in those microcosms (designated with R) were sampled at two times after readdition in triplicates: 2 to 7 days after respiking (depending on activity) and when CO2 production in them leveled off.
Chromium measurements.
Chromate in solution was measured colorimetrically using the N,N-diphenylcarbazide method (6). Chromate adsorbed to soil and amorphous Fe(III) was analyzed by extracting bound Cr(VI) from GF, GFH, and GFHR [GFH with a second addition of CR(VI)] samples, using two different procedures. Two grams of soil were used to measure readily extractable chromate by shaking for 1 h with 10 ml of 2 M KCl. The soil was then filtered out, and Cr(VI) was measured colorimetrically as described above. We refer to Cr extracted with KCl as “weakly adsorbed.” The total amount of Cr(VI) in the soil (including insoluble forms, such as PbCrO4) was determined by extracting 2.5 g of soil with 0.5 M NaOH-0.28 M Na2CO3 (43). Total Cr(VI) measured in GF soils was subtracted from that in GFH and GFHR samples to determine the fate of Cr(VI) added to these microcosms.
Isolation of Cr-resistant bacteria.
Cells were extracted from soil in anoxic phosphate saline buffer (pH 7.2). Serial dilutions were made, and 0.1 ml-aliquots were spread onto three types of solid media, 0.1× nutrient agar (Difco), soil extract agar with 0.5 g liter−1 glucose, and medium for IRB. All media were amended with potassium chromate to a final concentration of 0.25 mM. Soil extract was prepared by autoclaving 500 g of air-dried potting soil with 1,000 ml of distilled water at 121°C for 1 h; the supernatant was subsequently decanted, diluted 10 times, and autoclaved at 121°C for 30 min. IRB medium was based upon that described previously (18) with slight modifications: it contained, per liter, 2.5 g sodium bicarbonate, 0.25 g ammonium chloride, 0.6 g sodium phosphate monobasic, monohydrate, 0.1 g potassium chloride, 10 ml mineral solution (18), 0.05 g yeast extract, 1.36 g acetate (final concentration, 20 mM), and 12.25 g iron(III) citrate (final concentration, 50 mM). Plates were incubated for 3 weeks in anaerobic jars (BBL GasPak systems; BD, Franklin Lakes, NJ) at 20°C. Pure cultures were obtained from single colonies by standard microbiological techniques. Isolates were then tested for growth on 0.5, 1, 2.5, 5 or 10 mM potassium chromate using the same solid media used for isolation.
Bacterial community analysis.
Changes in community composition were determined by extraction of soil DNA, PCR amplification of the V3 region of the 16S rRNA gene, and PCR amplicon separation by denaturing gradient gel electrophoresis (DGGE) (D-Code apparatus; Bio-Rad, Hercules, CA) as described previously (21). Briefly, total genomic DNA was extracted using the FastDNA spin kit for soils (QBiogene, Carlsbad, CA). The 16S rRNA gene was amplified using universal bacterial primers PRBA338f (with a GC clamp) and PRUN518r (21). PCR products were confirmed using agarose gel electrophoresis, and equivalent quantities were used for DGGE based on their fluorescence intensity. DGGE was performed using 8% (wt/vol) polyacrylamide gels (37.5:1 acrylamide:bisacrylamide) with denaturing gradients ranging from 40% to 62.5% for glucose microcosms and from 40% to 57.5% for protein microcosms (100% denaturant contains 7 M urea and 40% [vol/vol] formamide). After electrophoresis, gels were stained with SYBR Green I (Cambrex Bio Science, Rockland, ME) and image digitized using an Image Station 2000R system (Kodak Eastman Company, Rochester, NY).
All bands were assigned to band classes after gels were normalized in comparison to marker lanes (BioNumerics, Applied Maths, Belgium). Correct assignment of band class was confirmed by rerunning the putatively similar samples in adjacent lanes on a DGGE gel. The presence or absence of bands was used to generate a binary data set from which Dice similarity coefficients were calculated (9). Changes in community composition with time were visualized using nonlinear multidimensional scaling (NMDS), a statistical method that arranges multivariate data in a two-dimensional plane based on similarity coefficients between different samples (9). The Euclidean distance between points in an NMDS plot is inversely proportional to the similarity of the samples.
16S rRNA gene sequence determination.
DNA extracted from microcosms was amplified with primers PRBA338f and PRUN518r but without the GC-clamp, and the PCR product was cloned in the pGEM-T easy vector system (Promega, Madison, WI). Inserts from 30 random clones per microcosm were amplified using the PCR conditions described above with 1 ml of a cell suspension as a template and screened using DGGE. If possible, two inserts with identical migration to dominant bands from the microcosm DGGE profiles were selected for further analysis. Plasmid DNA containing the inserts was isolated by alkaline lysis (32), and the inserts were sequenced at Purdue University's Genomics Facility.
Bacterial isolates which grew at 5 mM or higher Cr(VI) concentrations were differentiated by PCR-DGGE analysis as described above. The 16S rRNA genes of isolates that produced a unique DGGE profile were sequenced. If several isolates produced identical DGGE patterns, two were chosen at random for sequencing. The 16S rRNA genes were amplified from each isolate using primers pA (8) and PRUN518r. PCR mixtures (total volume, 50 ml) contained 0.625 μM of each primer, 0.8 mM deoxynucleoside triphosphates, 1% bovine serum albumin, 1× PCR buffer (Promega, Madison WI), 1.5 mM MgCl2, 1 unit of Taq DNA polymerase (Promega), and 1 μl of template (cell suspension). Reactions were carried out in a PTC-100 programmable thermal controller (MJ Research IN; Watertown, MA) using the following program: 5 min of denaturation at 94°C, 30 cycles of 30 s at 94°C, 30 s at 53°C, and 90 s at 72°C, and a final extension of 72°C for 15 min. PCR products were then purified using a QIAquick PCR purification kit (QIAGEN, Valencia, CA) according to the manufacturer's instructions and sequenced at Purdue University's Genomic Facility using the pA and PRUN518r primers. The nearly full-length 16S rRNA gene sequence was determined for isolates that had 95% or less similarity to their best matches in GenBank, using primers pA and pH (8) as described previously (21). Nucleotide sequences were compared to sequences in the National Center for Biotechnology Information GenBank database using the BLASTn program (1).
Geobacteraceae quantification.
Iron-reducing bacteria that belong to the Geobacteraceae family in the microcosm samples were quantified on an ABI 7700 real-time PCR instrument (Applied Biosystems, Foster City, CA). PCR mixes contained 1× cloned PfuTurbo buffer, 1 U of PfuTurbo Hotstart DNA polymerase (Stratagene, La Jolla, CA), 0.2 mM of each deoxynucleoside triphosphate, SYBR Green (1:30,000; Molecular Probes, Eugene, OR), and 0.5 mM each of a forward and reverse primer in 25-ml total volume. Primers used were Geobacteraceae-494F (11) (5′-AGG AAG CAC CGG CTA ACT CC-3′) and Geobacteraceae-825R (39) (5′-TAC CCG CRA CAC CTA GTT TT-3′). Reaction conditions were as follows: 95°C for 10 min and 33 cycles of 95°C for 40 s, 51°C for 40 s, and 83°C for 1 min. A standard curve was constructed with known amounts of DNA from a pure culture of Geobacter metallireducens. The amount of DNA in standards was converted to the number of amplified gene copies based on the knowledge that there is one copy of the rRNA in the genome of G. metallireducens (12).
Nucleotide sequence accession numbers.
The nucleotide sequences obtained in this study have been deposited in the GenBank database under accession no. DQ154261 to DQ154288.
RESULTS
Microbial activity.
The addition of glucose stimulated CO2 production in the microcosms without an apparent lag (Fig. 1A). The addition of Cr inhibited activity; CO2 levels at day 2 were 66% (GFL), 56% (GFM), and 43% (GFH) of the levels produced in the absence of Cr (GF). In addition, the rate of CO2 production after day 2 was lower in Cr-amended microcosms (152, 140, and 121 μg CO2 g−1 soil day−1 for GFL, GFM, and GFH, respectively) than in GF microcosms (366 μg CO2 g−1 soil day−1) (Fig. 1A). The maximum amount of CO2 produced in microcosms receiving glucose ranged from 25 to 32% of the added C (based on the theoretical maximum mineralization if all carbon in glucose was mineralized) and was not significantly different in any of the treatments.
FIG. 1.

Cumulative CO2 production over time in anaerobic microcosms amended with (panels A and B) glucose (G) or (panels C and D) protein (P). Microcosms varied by additions of Fe(III) (F) and/or one of three levels of Cr(VI) (L, M, or H). Panels A and C illustrate microcosms receiving a single dose or no dose of Cr(VI), and panels B and D compare microcosms receiving a single dose of Cr(VI) to those receiving a second dose (marked with arrows) of Cr(VI).
The addition of protein to microcosms without Cr(VI) also stimulated CO2 production without an apparent lag (Fig. 1C). The addition of Cr inhibited microbial activity; CO2 levels at day 5 were 70% (PFL), 65% (PFM), and 52% (PFH) of the levels produced in the absence of Cr (PF). In microcosms which received protein, Fe(III) and Cr(VI), the CO2 concentration increased in two phases: an initial phase of slow CO2 accumulation and a second phase of faster accumulation (Fig. 1C). The length of the initial slow phase increased with increasing concentrations of added Cr(VI); however, the linear rate of mineralization in the second phase did not differ among the three Cr(VI) treatments (PFL, 7.1 μg CO2 g−1 soil day−1; PFM, 7.4 μg CO2 g−1 soil day−1; and PFH, 7.8 μg CO2 g−1 soil day−1). At termination a small fraction of added protein was mineralized, regardless of Cr(VI) addition. Cumulative CO2 production was 4.9, 4.6, 4.5, and 4.1% of added organic C for the PF, PFL, PFM, and PFH microcosms, respectively.
Chromium fate.
Although Cr(VI) was added to microcosms at levels of 140, 240, or 340 μg Cr(VI) g−1 soil, most could not be extracted immediately after Cr amendment; Cr(VI) concentrations in the liquid phase of microcosms extracted immediately were 4, 16, and 69 μg Cr(VI) g−1 soil. To determine if Cr(VI) was adsorbed to a matrix or reduced, we measured Cr(VI) in solution immediately after mixing with soil or Fe(III). In the soil mixture, 85 to 95% of the added Cr(VI) was recovered in the liquid phase, whereas in the Fe(III) mixture, only 14 to 18% of the added Cr(VI) was detected. In the latter, all added Cr(VI) was recovered after dissolution of FeOOH with concentrated acid. Thus, in microcosms to which amorphous iron oxide was added, Cr(VI) was rapidly adsorbed to Fe(III) particles.
After 48 h of incubation, Cr(VI) in glucose-amended microcosms was not detected in solution in GFL and only at 2.3 ± 2.8 and 16.9 ± 2.8 μg Cr(VI) g−1 soil in the GFM and GFH microcosms, respectively. At later sampling times, no Cr(VI) was detected in the liquid phase of any of the microcosms. Total and weakly adsorbed Cr(VI) from selected samples decreased with time to background levels, which indicated that the added amounts of Cr(VI) were reduced by the end of the experiment (Table 1).
TABLE 1.
Chromium(VI) concentrations over time in GFH or GFHR microcosm
| Treatment | Extraction procedure | Cr(VI) concn (μg/g of soil) ± SEa
|
|||
|---|---|---|---|---|---|
| T1 | T2 | T3 | T4 | ||
| GFHf | No extractionb | 16.9 ± 2.8 | 1.3 ± 1.4 | 0.6 ± 0.4 | 0.1 ± 0.01 |
| Weakly adsorbedc | 73.1 ± 0.4 | 27.6 ± 1.2 | 19.1 ± 0.9 | 1.2 ± 0.02 | |
| Totald | 309.7 ± 58.7 | 142.3 ± 13.0 | 107.7 ± 62.3 | 27.9 ± 26.7 | |
| GFHR | No extraction | NAe | NA | 33.5 ± 2.8 | 0.1 ± 0.01 |
| Weakly adsorbed | NA | NA | 119.1 ± 0.4 | 1.3 ± 0.01 | |
| Total | NA | NA | 398.4 ± 21.4 | 150.5 ± 42.3 | |
T1 to T4, sample collections times: T1, 48 h after initiation; T2, at inception of substrate-induced mineralization; T3, maximum rate of CO2 production; and T4, CO2 production leveled off.
No extraction; Cr(VI) was measured in the liquid phase.
Weakly adsorbed; Cr(VI) was measured after a 2 M KCl extraction.
Total, Cr(VI) was measured after a 0.5 M NaOH-0.28 M Na2CO3 extraction and then background subtracted based on Cr(VI) in GF samples [732.3 μg Cr(VI) g−1 soil].
NA, not applicable.
Microcosms were amended with glucose, Fe(III), and 340 μg Cr(VI) g−1 soil (GFH) or the same treatment with a second addition of 340 μg Cr(VI) g−1 soil (GFHR).
Chromium(VI) was detected in the liquid phase of all Cr- and protein-amended microcosms at T1 at levels of 14.6 ± 1.5, 26.7 ± 4.5, and 40.8 ± 11.4 μg g−1 soil (PFL, PFM, and PFH microcosms, respectively). There was no detectable Cr(VI) in solution at subsequent sampling times.
Readdition of Cr(VI).
In glucose microcosms, readdition of Cr(VI) had modest effects upon microbial activity in GFL and GFM microcosms. In contrast, there was a dramatic effect in GFH microcosms; it reduced the rate of CO2 production from 121 to 26 μg CO2 g−1 soil day−1, and the total amount of CO2 produced was 28% lower (Fig. 1B). Cr(VI) was still detectable in solution of GFLR, GFMR, and GFHR microcosms 2 days after readdition at levels of 0.98 ± 0.7, 12.0 ± 7.6, and 33.5 ± 2.8 μg g−1, respectively. Alkaline extraction of GFHR samples showed that the added Cr was present as Cr(VI) at this time, and 35 days later, 69% of this Cr had been reduced to Cr(III) (Table 1).
The addition of a second Cr(VI) dose in protein microcosms had an immediate inhibitory effect on carbon mineralization in all three Cr treatments (Fig. 1D). PFLR and PFMR treatments recovered after 2 days; in contrast, CO2 production in PFHR microcosms was inhibited for more than 2 weeks. After readdition, Cr(VI) was detected only in the liquid phase of PFHR microcosms [52.5 ± 5.6 μg Cr(VI) g−1 soil]. At the time of termination of the three treatments with Cr(VI) readdition, no Cr(VI) was detected in solution in any of the microcosms.
Microbial community dynamics.
PCR-DGGE profiles showed that the addition of organic C and/or Cr(VI) resulted in drastic changes in the microbial community structure (Fig. 2). The DGGE profile of the initial soil microbial community contained four intense bands (Fig. 2A and B, lanes T0). The same four bands were also present in all glucose (except GF) and protein-amended microcosms at 48 h; several additional bands arose in the glucose microcosms. At later incubation times, the numbers of distinct bands in both glucose and protein-amended microcosms increased. At time T4, glucose and protein microcosms were dominated by different microbial communities (Fig. 3); Dice similarity values between corresponding treatments (e.g., GFH and PFH) ranged from 0.09 to 0.29.
FIG. 2.

Community profiles based on denaturing gradient gel electrophoresis of the V3 region of the 16S rRNA gene amplified by PCR of DNA extracted from anaerobic microcosms amended with (A) glucose, Fe(III), and/or Cr(VI) (240 μg g−1 soil for GFM/R or 340 μg g−1 soil for GFH/R), (B) protein, Fe(III), and/or Cr(VI) (240 μg g−1 soil for PFM/R or 340 μg g−1 soil for PFH/R). M indicates marker, T0 indicates initial soil profile, and T1-T4 indicate sample times. Lanes GFCr-1 to -7 and PFCr-1 to -5 represent chromium-resistant bacteria isolated from GFM (A) or PFM (B) microcosms. Small letters designate bands that were sequenced (Table 2). The gel gradient illustrated is 40 to 62.5% denaturants.
FIG. 3.
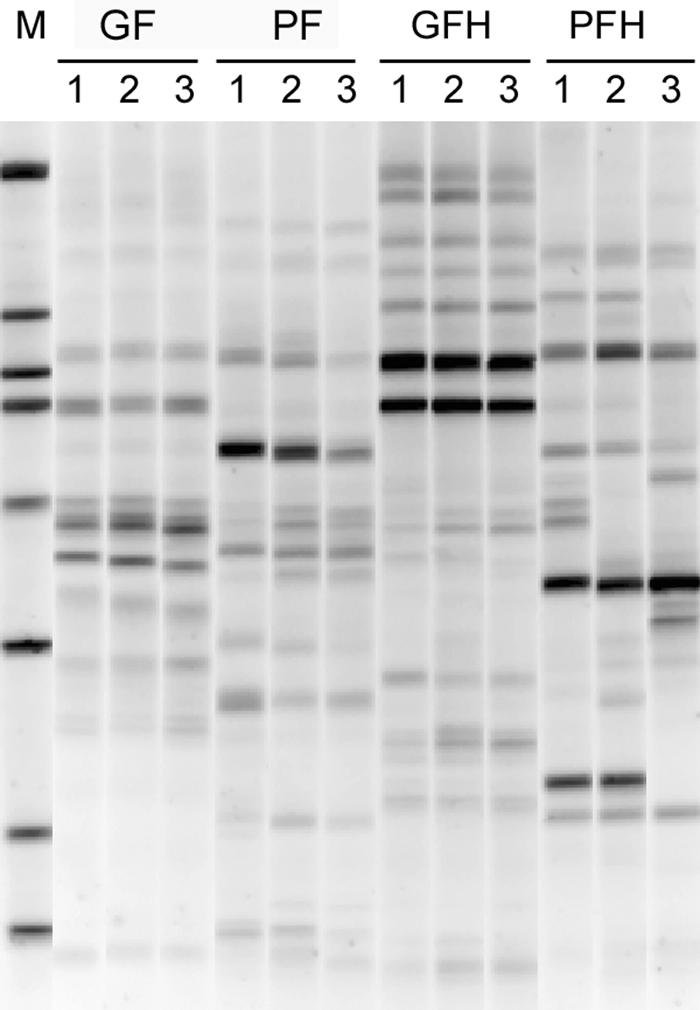
Comparison of PCR-DGGE community profiles of Fe(III)-amended glucose and protein microcosms without Cr(VI) (GF and PF) and with high levels of Cr(VI) (340 μg g−1 soil) (GFH and PFH) addition at the end of the incubation. Numbers above lanes indicate replicates. The gel gradient illustrated is 40 to 57.5% denaturants.
NMDS illustrated large differences in similarity coefficients for the PCR-DGGE profiles caused by addition of organic carbon and chromium (Fig. 4). At the end of the experiment, microcosms that received Cr were distinct from those that did not. The effect of Cr was most pronounced in microcosms amended with high levels of Cr(VI) (Fig. 4).
FIG. 4.

NMDS analysis of PCR-DGGE profiles of microcosms amended with Fe(III) and different levels of Cr(VI) with the following carbon source and sampling times: (A) glucose at T3 (maximum CO2 production), (B) glucose at T4 (CO2 production has plateaued), (C) protein at T3, and (D) protein at T4. T0 indicates initial soil profile, and points marked with R indicate microcosms to which a second dose of Cr(VI) was added.
16S rRNA gene phylogenetic analysis.
Cloning and sequencing were used to determine the phylogenetic identity of some dominant bands from GFM and PFM microcosms (Fig. 2 and Table 2). At 48 h, a dominant band present in all microcosms most closely matched that of Pseudomonas sp., and in glucose microcosms, a second common band matched that of Serratia sp. At times T2 to T4, several new intense bands appeared in most profiles for a given organic substrate (Fig. 2). In glucose microcosms, the best matches to band sequences were to members of the γ-Proteobacteria, Firmicutes, and Actinobacteria (Table 2). In contrast, almost all sequenced bands from protein microcosms most closely matched members of Firmicutes.
TABLE 2.
Summary of sequences determined for isolated bacteria and dominant bands in DGGE profiles from microcosms amended with organic C (glucose or protein), Fe(III), and 240 μg Cr(VI) g−1 soil
| Clone or isolatea | Best match | Accession no. | Similarityb | Phylogenetic clade |
|---|---|---|---|---|
| GFM1(2)(a) | Pseudomonas fluorescens VH060479 | AY730552.1 | 197/197 (100) | γ-Proteobacteria |
| GFM2(1)(b) | Uncultured bacterium clone A1Z/1 | AY465163.1 | 193/197 (97) | γ-Proteobacteria |
| GFM3(1)(c) | Bacterium RSD-1-4 | AY822515.1 | 197/197 (100) | γ-Proteobacteria |
| GFM4(3)(d) | Uncultured bacterium clone PBg1-013 | AY791152.1 | 172/172 (100) | Firmicutes |
| GFM5(2)(e) | Bacterium K2-83 | AY345482.1 | 197/197 (100) | Firmicutes |
| GFM6(1)(f) | Lachnospiraceae bacterium 19gly4 | AF550610.1 | 170/175 (100) | Firmicutes |
| GFM7(4)(g) | Serratia sp. D3 | AY745744.1 | 197/197 (100) | γ-Proteobacteria |
| GFM8(1)(h) | Rahnella aquatilis ISR02 | Y14142.1 | 196/197 (99) | γ-Proteobacteria |
| GFM9(3)(i) | Cellulomonas parahominis W7387 | AY655732.1 | 177/177 (99) | Actinobacteria |
| Isolate GFCr-1 | Bacterium WS01_1416 | AY617101.1 | 497/502 (99) | Actinobacteria |
| Isolate GFCr-2 | Oerskovia turbata NCIMB 10587 | X79454.1 | 431/455 (94) | Actinobacteria |
| Isolate GFCr-3 | Uncultured bacterium clone HN1-55 | AY221602.1 | 1,464/1,511 (96) | Actinobacteria |
| Isolate GFCr-4 | Agrobacterium tumefaciens MAFF301001 | AB102735.2 | 468/468 (100) | α-Proteobacteria |
| Isolate GFCr-5 | Uncultured bacterial clone N8 | AY376698.1 | 459/461 (99) | γ-Proteobacteria |
| Isolate GFCr-6 | Pantoea agglomerans strain ChDC YP3 | AY691545.1 | 525/525 (100) | γ-Proteobacteria |
| Isolate GFCr-7 | Pseudomonas sp. strain C22B | AF408939.1 | 521/521 (100) | γ-Proteobacteria |
| PFM1(1)(a) | Uncultured bacterium clone A1Z/1 | AY465163.1 | 197/197 (100) | γ-Proteobacteria |
| PFM2(2)(b) | Pseudomonas fluorescens VH060479 | AY730552.1 | 197/197 (100) | γ-Proteobacteria |
| PFM3(2)(c) | Lachnospiraceae bacterium 19gly4 | AF550610.1 | 174/175 (99) | Firmicutes |
| PFM4(2)(c) | Uncultured bacterium clone PBg1-013 | AY791152.1 | 170/172 (98) | Firmicutes |
| PFM5(1)(d) | Uncultured soil bacterium clone 397 | AY493973.1 | 172/173 (99) | Firmicutes |
| PFM6(1)(e) | Unidentified bacterium clone BSV34 | AJ229194.1 | 171/174 (98) | Firmicutes |
| PFM7(1)(e) | Uncultured actinobacterium | AY217495.1 | 179/179 (100) | Actinobacteria |
| Isolate PFCr-1 | Bacillus sp. strain NRS-1695 | AF169535.1 | 1,380/1,410 (97) | Firmicutes |
| Isolate PFCr-2 | Pantoea agglomerans strain ChDC YP3 | AY691545.1 | 525/525 (100) | γ-Proteobacteria |
| Isolate PFCr-3 | Oerskovia xanthineolytica NCIMB 11025 | X79453.1 | 499/499 (100) | Actinobacteria |
| Isolate PFCr-4 | Bacillus cereus ATCC 10987 | AE017265.1 | 471/471 (100) | Firmicutes |
| Isolate PFCr-5 | Bacterium WS01_1416 | AY617101.1 | 497/502 (99) | Actinobacteria |
G represents isolates and clones from glucose-amended microcosms; P represents isolates and clones from protein-amended microcosms. Numbers in parentheses indicate number of sequenced clones with the same sequence; letters in parentheses indicate band position illustrated in Fig. 2.
Approximately 200 bp were sequenced for clones and 500 bp for isolates. Results are expressed as no. of similar nucleotides/no. tested (%).
Twenty-four bacteria (15 from GFM and 9 from PFM samples) that were resistant to K2CrO4 concentrations up to 10 mM were obtained on IRB medium. No isolates were obtained on any of the other media tested. Genotyping of isolates by DGGE indicated there were seven unique genotypes from GFM and five from PFM (Fig. 2). Some isolates produced multiple bands by DGGE that were not eliminated by PCR optimization. The isolates were most closely related to Enterobacter sp., Pantoea sp., Bacillus sp., Pseudomonas sp., Cellulomonas sp., Propionibacterium sp., and Oerskovia sp. (Table 2). Cellulomonas sp. isolates (GFCr-1 and PFCr-5) had sequences identical to that of the excised Cellulomonas sp. band from the corresponding GFM sample.
Geobacteraceae quantification.
Anaerobic Fe respiration in soils is often mediated by microbes in the Geobacteraceae; therefore, we quantified the copies of Geobacteraceae 16S rRNA genes by real-time PCR. The initial soil community contained 3.2 × 10⁶ Geobacteraceae sequences per g dry soil. Throughout the experiment, the number of Geobacteraceae sequences in the soil remained close to the initial number, with slight increases during times T3 and T4; however, those increases were always moderate (maximum of ninefold) whether or not Cr or glucose was added (Table 3).
TABLE 3.
Real-time PCR quantification of Geobacteraceae genomes over time in amended microcosms
| Treatmenta | No.b of Geobacteraceae genomes (107) ± SE
|
||||
|---|---|---|---|---|---|
| Initial | T1 | T2 | T3 | T4 | |
| GF | 0.32 | 0.28 ± 0.14 | 0.24 ± 0.08 | 1.17 ± 0.5 | 0.36 ± 0.03 |
| GFH | 0.32 | 0.20 ± 0.06 | 0.21 ± 0.08 | 0.28 ± 0.12 | 2.85 ± 0.81 |
| FG | 0.32 | 0.79 ± 0.27 | 1.35 ± 0.62 | 1.99 ± 0.88 | 1.00 ± 0.89 |
| PF | 0.32 | 0.26 ± 0.12 | 1.02 ± 0.82 | 1.37 ± 0.55 | 0.28 ± 0.16 |
| PFH | 0.32 | 0.22 ± 0.04 | 0.88 ± 0.4 | 1.57 ± 0.51 | 1.14 ± 0.31 |
| FP | 0.32 | 0.39 ± 0.08 | 0.31 ± 0.31 | 1.13 ± 0.82 | 0.35 ± 0.07 |
Microcosms were amended with carbon and Fe(III) (GF and PF), carbon, Fe(III), and 340 μg Cr per g dry soil (GFH and PFH), or Fe(III) only (FG for glucose experiment and FP for protein experiment).
Numbers are averages of three replicates.
DISCUSSION
We used microcosms constructed from soil with a history of long-term heavy metal contamination to explore the effects of different levels of chromium(VI) on the development of anaerobic bacterial communities under iron-reducing conditions. Chromium had an inhibitory effect on the rate of CO2 production in glucose-amended microcosms and induced an initial slow phase of CO2 production in protein-amended microcosms; however, in all cases, when Cr was added the total amount of CO2 produced was not significantly different from that in microcosms which received organic C but not Cr. In other studies, the addition of heavy metals has led to a lower microbial biomass but higher metabolic quotient, which resulted in similar production of CO2 in metal-amended and unamended treatments (15).
An objective of this study was to evaluate the potential for anaerobic degradation in heavy-metal-contaminated soils. The addition of organic C stimulated anaerobic bacterial communities in these soils, as evidenced by the production of CO2 and the enrichment of certain bacterial phylotypes. Carbon dioxide production dynamics and DGGE profiles indicated that bacterial communities in glucose and protein microcosms differed in both their physiology and composition (Fig. 2; Table 2). This finding is consistent with those of previous studies that have shown that different microbial communities develop in soil microcosms amended with different carbon sources (16, 37). We expected that the effects of a second selective force [Cr(VI)] (33, 35) would depend upon the diversity of the pool of anaerobic Cr-resistant bacteria and the breadth of their catabolic potential. Our results are consistent with a broad pool of Cr-resistant microbes in soil, which differ in their capacities for glucose versus protein catabolism, because most DGGE bands were not shared between protein- and glucose-amended microcosms (Fig. 3).
We also added Fe(III) to the soil in order to stimulate the growth of IRB, which completely mineralize organic C to CO2; therefore, we expected reduction of Fe(III) to Fe(II) accompanied by an increase in the accumulation of CO2 in microcosms. Although Fe(III) was visibly reduced in all microcosms that received it, we did not observe an increase in the production of CO2. In addition, real-time PCR analysis of selected samples showed that Geobacteraceae iron-reducing bacteria were present throughout the experiment in relatively constant numbers. This is in sharp contrast with other studies which have found significant enrichment of Geobacteraceae with addition of organic carbon sources to contaminated anaerobic sediments (2, 11). It is possible that IRB used hydrogen (7, 19) produced during fermentation (26) to reduce Fe(III). In addition, members of some bacterial genera which were found in our study (e.g., Bacillus) are known to reduce Fe(III) without obtaining energy (18).
We expected that after the addition of organic C and Cr, CO2 would be produced after a lag phase of various lengths depending on the amount of Cr and the nature of the organic C added (22). While Cr initially reduced CO2 production in all microcosms where it was added, we did not observe a lag phase in any of them. The only exceptions were PFH microcosms, where CO2 production during the first 3 weeks did not differ from that in control microcosms, in which only water was added. Possible explanations for the lack of a lag phase are the following: (i) a significant proportion of the bacteria in microcosms were not affected by Cr(VI) due to its heterogeneous distribution; (ii) a significant portion of the bacteria in the initial soil were Cr resistant; (iii) adsorption of most of the added Cr(VI) to Fe(III) and the soil. Microcosm were water saturated and well mixed; thus, we assume that the added Cr(VI) was evenly distributed throughout the soil. Toxicity of adsorbed Cr(VI) to bacteria is not known; however, based on our knowledge of the mechanisms of Cr(VI) toxicity in pure cultures (Cr must first enter the cells through sulfate transporters [42]), we can expect that adsorbed Cr(VI) has a reduced toxicity for bacteria in soil. Thus, it appears that the lack of a lag phase could be attributed to a combination of the presence of Cr-resistant bacteria in the soil and a reduction of Cr toxicity due to adsorption.
We added a second dose of Cr(VI) to some microcosms at the point where microbes were actively metabolizing the added organic C to assess selection for Cr-resistant microbes by the first addition. Readdition of Cr had little effect in microcosms amended with low or medium levels of Cr(VI). This suggests that a population adapted to these Cr(VI) levels had been selected. The readdition of Cr at the high level inhibited mineralization of glucose or protein. In protein microcosms, activity dynamics were similar to those found after initial addition of Cr(VI). In contrast, a severe long-lasting inhibitory effect was observed after a second high dose of Cr(VI) was added to microcosms with glucose as the carbon source. The aqueous concentration of Cr(VI) in GFHR microcosms at sampling time T3 (48 h after readdition) was twice as high as the one observed in GFH microcosms at sampling time T1 (48 h after initial addition) (Table 1). If the resulting bioavailable Cr(VI) concentration exceeded the resistance of the entire microbial community, complete inhibition of activity could occur. Shi etal. (38) had demonstrated that these soils contained a mixture of microbes that varied in their Cr resistance; activity was a sigmoidal function of added Cr. The first high Cr(VI) addition we made would inhibit all but 22% of the original population. The second dose of Cr(VI) may have raised the aqueous concentration in GFHR microcosms beyond a value at which no indigenous microbes were active. The DGGE profiles taken 2 (glucose) or 14 (protein) days after Cr(VI) readdition (sample T3) were consistent with the absence of metabolic reactivity: several dominant bands were missing from the respiked GFHR and PFHR microcosms (Fig. 2).
Changes in the dominant soil bacterial community were monitored using PCR-DGGE. Fertile agricultural or forest soils harbor an equitable distribution of a large number of phylotypes; this produces a DGGE profile with diffuse staining and few distinct bands (25). On the other hand, intense bands reflect microbes that comprise more than 1% of the total microbial biomass (23). The addition of a carbon source was a driving force that led to the enrichment of a small number of phylotypes; however, the response of the community was modified by the addition of Cr(VI). The effect of Cr(VI) was most evident at the end of the dynamic response, when no further microbial activity was observed and the dose of added Cr(VI) had been reduced (Table 1). In other studies, the effects of heavy metal addition to soil resulted in altered DGGE profiles up to 12 months after incubation, when heavy metals were no longer bioavailable (10).
Heavy metals decrease microbial diversity in soil and select for resistant bacteria (30, 34). This has produced altered DGGE profiles in which the number of bands was reduced, the intensity of certain bands increased, and new bands appeared (17, 29, 30). These other studies employed aerobic microcosms, whereas we consciously imposed a transition from aerobic sieved soil to anaerobic conditions; this in itself was expected to alter the DGGE patterns. After those changes are taken into account, the DGGE profiles of Cr-amended microcosms showed intensification of some bands and appearance of new ones (Fig. 2). As a result, the richness of dominant phylotypes was greater in Cr-amended soils than in those amended only with organic C and Fe(III). However, DGGE does not detect rare phylotypes; therefore, we cannot exclude that total species richness was reduced in Cr(VI)-amended microcosms.
Sequencing of some intense DGGE bands and isolation of Cr-resistant strains allowed us to identify some of the indigenous populations that were enriched in these microcosms. Most were similar to characterized Cr(VI)-resistant strains that have been found in Cr-polluted soils (5, 20) and microcosms from marine sediments (3, 4). Several of the sequences obtained in this microcosm experiment are similar (94 to 100%) to sequences of dominant DGGE bands obtained by community analysis of soils from the same location (13). These results indicate that anaerobic metabolism can be potentially important in these soils in field conditions.
Some of the isolated bacteria were related to genera that have not been previously reported to contain Cr-resistant members: GFCr-2 and PFCr-3, which were closely related to Oerskovia sp., and GFCr-3, which matched most closely members of the genus Propionibacterium (92% sequence similarity in almost-complete 16S rRNA gene sequences). The Cellulomonas strains which matched dominant bands on DGGE profiles could be of special interest, since one study has found that members of this genus can reduce Cr(VI) and Fe(III) anaerobically (36).
We used microcosms to study the response of anaerobic bacterial communities in contaminated soils to the addition of organic C, Cr(VI), and Fe(III). These soils have been previously found to contain a relatively low diversity of heterotrophic microbes (13); we expected the addition of specific electron acceptors and donors and of Cr(VI) to enrich a limited subset of the anaerobic community. However, microcosms developed relatively diverse anaerobic bacterial communities in both the absence and presence of Cr, although different phylotypes were enriched in Cr-amended microcosms. Moreover, different organic amendments selected different communities; this indicates the presence of a relatively diverse anaerobic bacterial community in these soils with a broad functional potential.
Acknowledgments
This work was supported by a grant from the Department of Energy's Natural and Accelerated Bioremediation Research (NABIR) program (grant DE-FG02-98ER62681).
Our thanks to Indiana Department of Transport and in particular Bill Jervis for giving us access to this site. We also thank Joel Kostka for kindly providing us with the Geobacter metallireducens culture.
REFERENCES
- 1.Altschul, S. F., T. L. Madden, A. A. Schäffer, J. Zhang, Z. Zhang, W. Miller, and D. J. Lipman. 1997. Gapped BLAST and PSI-BLAST: a new generation of protein database search programs. Nucleic Acids Res. 25:3389-3402. [DOI] [PMC free article] [PubMed] [Google Scholar]
- 2.Anderson, R. T., H. A. Vrionis, I. Ortiz-Bernad, C. T. Resch, P. E. Long, R. Dayvault, K. Karp, S. Marutzky, D. R. Metzler, A. Peacock, D. C. White, M. Lowe, and D. R. Lovley. 2003. Stimulating the in situ activity of Geobacter species to remove uranium from the groundwater of a uranium-contaminated aquifer. Appl. Environ. Microbiol. 69:5884-5891. [DOI] [PMC free article] [PubMed] [Google Scholar]
- 3.Arias, Y. M., A. Obraztsova, B. M. Tebo, and C. Green-Ruiz. 2003. Natural attenuation of Cr(VI) contamination in laboratory mesocosms. Geomicrobiol. J. 20:389-401. [Google Scholar]
- 4.Arias, Y. M., and B. M. Tebo. 2003. Cr(VI) reduction by sulfidogenic and nonsulfidogenic microbial consortia. Appl. Environ. Microbiol. 69:1847-1853. [DOI] [PMC free article] [PubMed] [Google Scholar]
- 5.Camargo, F. A. O., F. M. Bento, B. C. Okeke, and W. T. Frankenberger. 2003. Chromate reduction by chromium-resistant bacteria isolated from soils contaminated with dichromate. J. Environ. Qual. 32:1228-1233. [DOI] [PubMed] [Google Scholar]
- 6.Clesceri, L. S., A. E. Greenberg, and A. D. Eaton (ed.). 1998. Standard methods for the examination of water and wastewater, 20th ed. American Public Health Association, American Water Works Association, and Water Environmental Federation, Washington, D.C.
- 7.Dassonville, F., J. J. Godon, P. Renault, A. Richaume, and P. Cambier. 2004. Microbial dynamics in an anaerobic soil slurry amended with glucose, and their dependence on geochemical processes. Soil Biol. Biochem. 36:1417-1430. [Google Scholar]
- 8.Edwards, U., T. Rogall, H. Blocker, M. Emde, and E. C. Bottger. 1989. Isolation and direct complete nucleotide determination of entire genes. Characterization of a gene coding for 16S ribosomal RNA. Nucleic Acids Res. 17:7843-7853. [DOI] [PMC free article] [PubMed] [Google Scholar]
- 9.Feris, K. P., P. W. Ramsey, M. Rillig, J. N. Moore, J. E. Gannon, and W. E. Holben. 2004. Determining rates of change and evaluating group-level resiliency differences in hyporheic microbial communities in response to fluvial heavy-metal deposition. Appl. Environ. Microbiol. 70:4756-4765. [DOI] [PMC free article] [PubMed] [Google Scholar]
- 10.Gremion, F., A. Chatzinotas, K. Kaufmann, W. Von Sigler, and H. Harms. 2004. Impacts of heavy metal contamination and phytoremediation on a microbial community during a twelve-month microcosm experiment. FEMS Microbiol. Ecol. 48:273-283. [DOI] [PubMed] [Google Scholar]
- 11.Holmes, D. E., K. T. Finneran, R. A. O'Neil, and D. R. Lovley. 2002. Enrichment of members of the family Geobacteraceae associated with stimulation of dissimilatory metal reduction in uranium-contaminated aquifer sediments. Appl. Environ. Microbiol. 68:2300-2306. [DOI] [PMC free article] [PubMed] [Google Scholar]
- 12.Holmes, D. E., K. P. Nevin, and D. R. Lovley. 2004. Comparison of 16S rRNA, nifD, recA, gyrB, rpoB and fusA genes within the family Geobacteraceae fam. nov. Int. J. Syst. Evol. Microbiol. 54:1591-1599. [DOI] [PubMed] [Google Scholar]
- 13.Joynt, J., M. Bischoff, R. Turco, A. Konopka, and C. H. Nakatsu. Microbial community analysis of soils contaminated with lead, chromium and organic solvents. Microbial Ecol., in press. [DOI] [PubMed]
- 14.Kamaludeen, S. P. B., M. Megharaj, A. L. Juhasz, N. Sethunathan, and R. Naidu. 2003. Chromium-microorganism interactions in soils: remediation implications. Rev. Environ. Contam. Toxicol. 178:93-164. [DOI] [PubMed] [Google Scholar]
- 15.Khan, M., and J. Scullion. 2002. Effects of metal (Cd, Cu, Ni, Pb or Zn) enrichment of sewage-sludge on soil micro-organisms and their activities. Appl. Soil Ecol. 20:145-155. [Google Scholar]
- 16.Kleikemper, J., O. Pelz, M. H. Schroth, and J. Zeyer. 2002. Sulfate-reducing bacterial community response to carbon source amendments in contaminated aquifer microcosms. FEMS Microbiol. Ecol. 42:109-118. [DOI] [PubMed] [Google Scholar]
- 17.Kozdroj, J., and J. D. van Elsas. 2001. Structural diversity of microbial communities in arable soils of a heavily industrialised area determined by PCR-DGGE fingerprinting and FAME profiling. Appl. Soil Ecol. 17:31-42. [Google Scholar]
- 18.Lovley, D. 2000. Dissimilatory Fe(III)- and Mn(IV)-reducing prokaryotes. .In M. Dworkin (ed.), The prokaryotes: an evolving electronic resource for the microbiological community, 3rd ed. Springer-Verlag, New York, N.Y. [Online.] http://link.springer-ny.com/link/service/books/10125/.
- 19.Lovley, D., D. E. Holmes, and K. P. Nevin. 2004. Dissimilatory Fe(III) and Mn(IV) reduction. Adv. Microbiol. Physiol. 49:219-286. [DOI] [PubMed] [Google Scholar]
- 20.McLean, J., and T. J. Beveridge. 2001. Chromate reduction by a pseudomonad isolated from a site contaminated with chromated copper arsenate. Appl. Environ. Microbiol. 67:1076-1084. [DOI] [PMC free article] [PubMed] [Google Scholar]
- 21.Morgan, C. A., A. Hudson, A. Konopka, and C. H. Nakatsu. 2002. Analyses of microbial activity in biomass-recycle reactors using denaturing gradient gel electrophoresis of 16S rDNA and 16S rDNA PCR products. Can. J. Microbiol. 48:331-341. [DOI] [PubMed] [Google Scholar]
- 22.Muller, A. K., K. Westergaard, S. Christensen, and S. J. Sorensen. 2002. The diversity and function of soil microbial communities exposed to different disturbances. Microb. Ecol. 44:49-58. [DOI] [PubMed] [Google Scholar]
- 23.Muyzer, G., and K. Smalla. 1998. Application of denaturing gradient gel electrophoresis (DGGE) and temperature gradient gel electrophoresis (TGGE) in microbial ecology. Antonie Leeuwenhoek 73:127-141. [DOI] [PubMed] [Google Scholar]
- 24.Nakatsu, C. H., N. Carmosini, B. Baldwin, F. Beasley, P. Kourtev, and A. Konopka. 2005. Soil microbial community responses to additions of organic carbon substrates and heavy metals (Pb and Cr). Appl. Environ. Microbiol. 71:7679-7689. [DOI] [PMC free article] [PubMed] [Google Scholar]
- 25.Nakatsu, C. H., V. Torsvik, and L. Øvreas. 2000. Soil community analysis using DGGE of 16S rDNA polymerase chain reaction products. Soil Sci. Soc. Am. J. 64:1382-1388. [Google Scholar]
- 26.Nandi, R., and S. Sengupta. 1998. Microbial production of hydrogen: an overview. Crit. Rev. Microbiol. 24:61-84. [DOI] [PubMed] [Google Scholar]
- 27.Obraztsova, A. Y., C. A. Francis, and B. M. Tebo. 2002. Sulfur disproportionation by the facultative anaerobe Pantoea agglomerans SP1 as a mechanism for chromium(VI) reduction. Geomicrobiol. J. 19:121-132. [Google Scholar]
- 28.Pattanapipitpaisal, P., A. N. Mabbett, J. A. Finlay, A. J. Beswick, M. Paterson-Beedle, A. Essa, J. Wright, M. R. Tolley, U. Badar, N. Ahmed, J. L. Hobman, N. L. Brown, and L. E. Macaskie. 2002. Reduction of Cr(VI) and bioaccumulation of chromium by Gram positive and Gram negative microorganisms not previously exposed to Cr-stress. Environ. Technol. 23:731-745. [DOI] [PubMed] [Google Scholar]
- 29.Ranjard, L., S. Nazaret, F. Gourbiere, J. Thioulouse, P. Linet, and A. Richaume. 2000. A soil microscale study to reveal the heterogeneity of Hg(II) impact on indigenous bacteria by quantification of adapted phenotypes and analysis of community DNA fingerprints. FEMS Microbiol. Ecol. 31:107-115. [DOI] [PubMed] [Google Scholar]
- 30.Rasmussen, L. D., and S. J. Sorensen. 2001. Effects of mercury contamination on the culturable heterotrophic, functional and genetic diversity of the bacterial community in soil. FEMS Microbiol. Ecol. 36:1-9. [DOI] [PubMed] [Google Scholar]
- 31.Said, W. A., and D. L. Lewis. 1991. Quantitative assessment of the effects of metals on microbial degradation of organic chemicals. Appl. Environ. Microbiol. 57:1498-1503. [DOI] [PMC free article] [PubMed] [Google Scholar]
- 32.Sambrook, J., and D. Russell. 2001. Molecular cloning: a laboratory manual, 3rd ed. Cold Spring Harbor Laboratory Press, Woodbury, N.Y.
- 33.Sandaa, R.-A., V. Torsvik, and O. Enger. 2001. Influence of long-term heavy-metal contamination on microbial communities in soil. Soil Biol. Biochem. 33:287-295. [Google Scholar]
- 34.Sandaa, R.-A., V. Torsvik, O. Enger, F. L. Daae, T. Castberg, and D. Hahn. 1999. Analysis of bacterial communities in heavy metal-contaminated soils at different levels of resolution. FEMS Microbiol. Ecol. 30:237-251. [DOI] [PubMed] [Google Scholar]
- 35.Sandrin, T. R., A. M. Chech, and R. M. Maier. 2000. A rhamnolipid biosurfactant reduces cadmium toxicity during naphthalene biodegradation. Appl. Environ. Microbiol. 66:4585-4588. [DOI] [PMC free article] [PubMed] [Google Scholar]
- 36.Sani, R. K., B. M. Peyton, W. A. Smith, W. A. Apel, and J. N. Petersen. 2002. Dissimilatory reduction of Cr(VI), Fe(III), and U(VI) by Cellulomonas isolates. Appl. Microbiol. Biotechnol. 60:192-199. [DOI] [PubMed] [Google Scholar]
- 37.Schutter, M., and R. Dick. 2001. Shifts in substrate utilization potential and structure of soil microbial communities in response to carbon substrates. Soil Biol. Biochem. 33:1481-1491. [Google Scholar]
- 38.Shi, W., M. Bischoff, R. Turco, and A. Konopka. 2002. Long-term effects of chromium and lead upon the activity of soil microbial communities. Appl. Soil Ecol. 21:169-177. [Google Scholar]
- 39.Stults, J. R., O. Snoeyenbos-West, B. Methe, D. R. Lovley, and D. P. Chandler. 2001. Application of the 5′ fluorogenic exonuclease assay (TaqMan) for quantitative ribosomal DNA and rRNA analysis in sediments. Appl. Environ. Microbiol. 67:2781-2789. [DOI] [PMC free article] [PubMed] [Google Scholar]
- 40.Turick, C. E., and W. A. Apel. 1997. A bioprocessing strategy that allows for the selection of Cr(VI)-reducing bacteria from soils. J. Ind. Microbiol. Biotechnol. 18:247-250. [Google Scholar]
- 41.Turpeinen, R., T. Kairesalo, and M. M. Haggblom. 2004. Microbial community structure and activity in arsenic-, chromium- and copper-contaminated soils. FEMS Microbiol. Ecol. 47:39-50. [DOI] [PubMed] [Google Scholar]
- 42.Viamajala, S., B. M. Peyton, K. S. Rajesh, W. A. Apel, and J. N. Petersen. 2004. Toxic effects of chromium(VI) on anaerobic and aerobic growth of Shewanella oneidensis MR-1. Biotechnol. Prog. 20:87-95. [DOI] [PubMed] [Google Scholar]
- 43.Vitale, R. J., G. R. Mussoline, J. C. Petura, and B. R. James. 1994. Hexavalent chromium extraction from soils: evaluation of an alkaline digestion method. J. Environ. Qual. 23:1249-1256. [Google Scholar]
- 44.Viti, C., and L. Giovannetti. 2005. Characterization of cultivable heterotrophic bacterial communities in Cr-polluted and unpolluted soils using Biolog and ARDRA approaches. Appl. Soil Ecol. 28:101-112. [Google Scholar]