Abstract
Nerve growth factor (NGF) is the ligand for two unrelated cellular receptors, TrkA and p75NTR, and acts as a mediator in the development and maintenance of the mammalian nervous system. Signaling through TrkA kinase domains promotes neuronal survival, whereas activation of the p75NTR “death domains” induces apoptosis under correct physiological conditions. However, co-expression of these receptors leads to enhanced neuronal survival upon NGF stimulation, possibly through a ternary p75NTR·NGF·TrkA complex. We have expressed human p75NTR ligand binding domain as a secreted glycosylated protein in Trichoplusia ni cells. Following assembly and purification of soluble p75NTR·NGF complexes, mass spectrometry, analytical ultracentrifugation, and solution x-ray scattering measurements are indicative of 2:2 stoichiometry, which implies a symmetric complex. Molecular models of the 2:2 p75NTR·NGF complex based on these data are not consistent with the further assembly of either symmetric (2:2:2) or asymmetric (2:2:1) ternary p75NTR·NGF·TrkA complexes.
Nerve growth factor (NGF)2 and the structurally and functionally related growth factors (BDNF, neurotrophin (NT) 3 and 4/5) comprise the family of mammalian neurotrophins. In vivo, neurotrophins are secreted as immature progrowth factors, which contain N-terminal propeptides, whose potential function in neurotrophin signaling has been extensively debated recently (for a review, see Ref. 1). The pro-neurotrophins undergo maturation by cleavage with prohormone convertases, releasing mature neurotrophins with approximate molecular masses of 13 kDa per monomeric unit (for review, see Ref. 2) that are characterized by the cystine knot fold (3). These mature forms are dimeric in solution (~26 kDa).
Neurotrophins exert their effects on both neural and non-neural cells through interaction(s) with plasma membrane-bound receptors. In this fashion, they promote survival, differentiation, mitosis, and cell death, depending on the nature and context of the targets and their stage in development (4). They are also unusual among growth factors in that they interact with and activate two distinct classes of receptors that are structurally unrelated. One group, the receptor-tyrosine kinase family (Trk), which has three distinct genes in higher vertebrates encoding the A, B, and C subforms (as well as products of splice variants), shows considerable ligand selectivity, i.e. TrkA binds NGF with high selectivity whereas TrkB binds BDNF and NT 4/5. In contrast, the second type of receptor, the common (or shared) neurotrophin receptor (p75NTR), which is a member of the TNF receptor superfamily, binds all of the neurotrophins with about equal affinity (~10−9 m) (5). Both types of receptor can and do function in the absence of the other, but there are also many observations that suggest their functions may be linked, perhaps by physical interactions (6). These cross-receptor interactions appear to be particularly important in affecting ligand affinity and in maintaining viability (or not) in peripheral neurons, where extensive programmed cell death is an essential process during development (7).
Although p75NTR was characterized relatively early by cloning methodology (8, 9), it was several years before the members of the Trk family were shown to be neurotrophin receptors (10, 11). In some respects this was unfortunate since the absence of an obvious effector (particularly a kinase moiety) in the p75NTR frustrated the development of any serious understanding of neurotrophin mechanisms for several years. Indeed, when the Trks were finally identified, p75NTR was relegated for some time to a position of minor importance, as a signaling accessory protein (12, 13). However, a more complete understanding of the signaling potential of the TNFR superfamily (“death domains”) acquired from experiments in both genetics and cell biology led to the identification of genuine signaling responses, e.g. the activation of NFκB (14), by p75NTR alone and established its role as an important independent receptor in neurotrophin-dependent systems (4, 7, 15) (and references cited therein). Although the death domain is apparently the principal initiator site for p75NTR signaling, the intracellular juxtamembrane region has also been implicated in some responses (16). It is important to note that p75NTR, both in isolation and when co-expressed with Trks, is also capable of initiating positive signaling pathways, leading to effects as diverse as survival and cellular migration (for reviews, see Refs. 7 and 17). Indeed, it is now appreciated that p75NTR interacts with a host of proteins, although the significance of all of these interactions is not completely understood (18).
Recent evidence, obtained with TRAF6(−/−) mice (19), that TRAF6 is a key entity in the activation of both NFκB and JNK (involved in survival and apoptosis, respectively) underscores the importance of the Trk-independent activities of the common receptor and suggests that the mechanism of TRAF6 activation will be the main apoptotic signaling mechanism of this moiety.
The overall organization of human p75NTR is that of a type I transmembrane protein whose protomer contains some ~400 residues with a single membrane segment (18). The ectodomain, which binds the neurotrophins, is characterized by four cystine-rich domains (CRDs) with the one closest to the N terminus having a single putative site of N-linked glycosylation (NX(S/T) consensus) in humans (two in rat). The extracellular juxtamembrane region also contains O-linked glycosylation. The intracellular domain is composed of ~150 amino acids, the second half of which constitutes the death domain (20). As observed in other receptor systems (21), the unliganded receptor occurs as a dimer (22, 23). p75NTR binds NGF through interactions with the CRDs of the ectodomain. He and Garcia (24) have reported the structure of a crystallographic complex of NGF and this portion of the p75NTR (residues 1–161 of the rat protein) that defines two sites of interaction, which utilize the junction regions between CDR1 and 2 (site I) and CDR3 and 4 (site II). This structure, which was prepared with p75NTR expressed in the presence of tunicamycin to prevent N-glycosylation, contains only one p75NTR protomer for each NGF dimer.
Here we describe the solution behavior of a human p75NTR protein corresponding to the four CRDs including N-glycosylation at residue 60 (of the unprocessed mature protein) alone and as a binary complex with human NGF. The results demonstrate that the glycosylated p75NTR derivative used in these studies forms a 2:2 complex with a binding constant, determined with the immobilized receptor ectodomain, indistinguishable from that observed for NGF binding to membrane bound p75NTR. These results further suggest that the putative ternary complex of p75NTR, NGF, and TrkA is not formed through ectodomain interactions alone.
MATERIALS AND METHODS
Cloning and Expression of the p75NTR Ligand Binding Domain
The ligand binding domain of human p75NTR, consisting of four cystine-rich domains, was cloned into a baculovirus vector and expressed as a secreted protein in T. ni cells. The boundaries of the construct are residues 29–190, (bases 201–683 of p75NTR mRNA, NM_002507). The purified soluble p75NTR ligand binding domain is appended with an N-terminal FLAG epitope (DYKDDDDKRPL) and a C-terminal hexa-histidine tag. Further details are under Supplemental Materials.
Purification of p75NTR and Measurement of NGF Binding Affinity
Following buffer exchange with a tangential flow concentrator (Cole Palmer), equipped with a 10-kDa MWCO filter unit (Pall), to Tris-HCl, 50 mm, NaCl, 150 mm, imidazole, 25 mm, pH 8, supplemented with Complete Block mixture of protease inhibitors (Roche Applied Science), the protein was purified on a column of Super Flow nickel-NTA (Qiagen) equilibrated with the above buffer. Final elution was with Tris-HCl, 50 mm, NaCl, 150 mm, and imidazole, 500 mm.
The ligand binding characteristics of the recombinant p75NTR ectodomain were determined by a scintillation proximity assay (25). Mouse 2.5 S NGF (Amersham Biosciences) was 125I-iodinated as described elsewhere (26). Polyvinyltoluene beads (Amersham Biosciences) were used to immobilize monoclonal anti-FLAG M1 antibodies (Sigma), diluted 1:500. The 125I-NGF was applied at 50 pm in 3% bovine serum albumin, and the receptor concentration was calibrated. Three to five identical wells were set up for each condition, and following a 3-h incubation, were read for 30 s each in a β-particle counter (Wallac). Duplicate experiments were subjected to non-linear regression analyses (Prism, GraphPad).
Size Exclusion Chromatography
Ni-NTA affinity-purified p75NTR and rhNGF (courtesy of Genentech, AAA59931) were mixed in Tris-HCl, 50 mm, NaCl, 150 mm, pH 8, concentrated in Vivaspin2 10-kDa MWCO modules (Vivascience), loaded on a Superdex HR 10/30 S200 column (30 × 1 cm, Amersham Biosciences) at +4 °C and eluted isocratically in the same buffer at 0.5 ml/minute. For preparation of samples for mass spectrometry, p75NTR and NGF were added in approximately equimolar amounts, and the fractions corresponding to the p75NTR·NGF complex were isolated and concentrated. For sedimentation equilibrium analytical ultracentrifugation and solution x-ray scattering, p75NTR and NGF were mixed at a ~1:2 ratio to ensure saturation of NGF bound to p75NTR. The column was calibrated with low molecular weight standards (Sigma).
Mass Spectrometry
Samples for mass spectrometry were concentrated in Biospin 6 kDa MWCO modules (Bio-Rad) and buffer exchanged to either 200 or 500 mm ammonium acetate at pH 7. Data were collected with either a Q-TOF-2 or an Ultima model mass spectrometer, equipped with Z-spray source (Micromass) and modified for the transmission and isolation of high mass ions (27). Nano-ESI capillaries were prepared in-house from borosilicate glass tubes of 1 mm OD and 0.78 mm ID (Harvard Apparatus) using a flaming/brown P-97 micropipette puller (Sutter Instruments), and gold-coated using an S. E. sputter coater (Polaron). The capillary tips were cut under a stereo microscope to give IDs of 1–5 μm, and typically 2–3 μl of solution was loaded for sampling.
The pressures and accelerating potentials in the mass spectrometer were optimized to remove adducts while preserving non-covalent interactions (27). External calibration of the spectra was achieved using solutions of cesium iodide, and the errors for all reported masses are ~0.1% unless stated otherwise. The mass resolution achieved in Fig. 2 for the intact protein complex is ~150 (m/Δm). Whereas below the mass resolution value that is typically achieved for pure protein complexes of this size (where none of the constituents of the complexes exhibit a heterogeneous population of masses in solution), it is a factor of 2–3 higher than the maximum predicted mass resolution for a protein complex population derived from the heterogeneous population of p75NTR glycoforms (Fig. 3B). Data acquisition and processing were performed using the MassLynx software (Micromass). All spectra are shown with minimal smoothing and without background subtraction.
FIGURE 2. Mass spectrum of the intact p75 NTR·NGF complex (68.37 kDa).
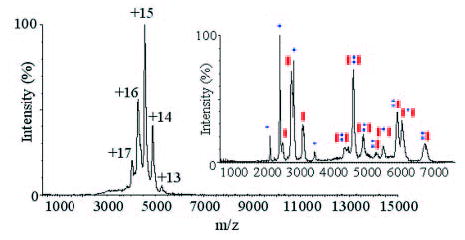
Inset shows tandem mass spectrum of the p75NTR·NGF complex for a broad isolation window centered around the 15+ charge state. Ions labeled on the spectrum correspond to charge states of (blue circles) NGF monomer, 13.27 kDa (red rectangles) p75NTR monomer, 20.5–20.9 kDa, p75NTR·NGF 2:2 complex, 1:2 p75NTR·NGF complex, 47.45 kDa, and 2:1 p75NTR·NGF complex, 55.10 kDa (all labeled with the appropriate number and type of either blue circles or red rectangles).
FIGURE 3.
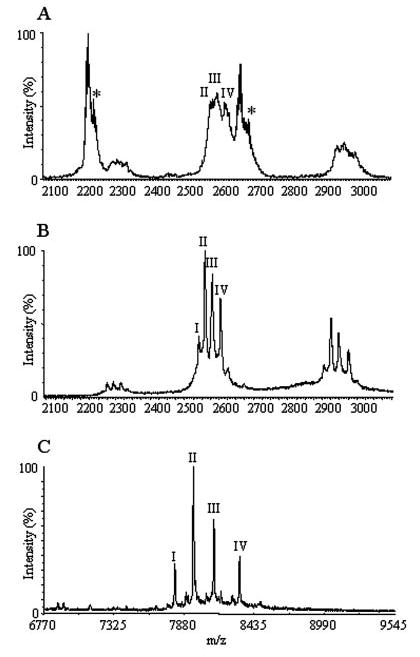
A, expanded view of the region between 2100 and 3100 m/z from Fig. 2. Modified versions of p75NTR are indicated as II, III, and IV (at 20.6, 20.7, and 20.9 kDa), and observed modified NGF is indicated with an asterisk. B, mass spectrum of isolated p75NTR. Modified versions of the protein are marked to correspond with the assignments from Fig. 3A (see text) including an additional glycoform labeled I (20.45 kDa). C, MALDI-TOF data of glycopeptides resulting from a tryptic digest of p75NTR (see TABLE ONE for details).
Analytical Ultracentrifugation
Sedimentation velocity analytical ultracentrifugation of p75NTR, and NGF were conducted at a concentration of ~0.3 mg/ml. The sample (400 μl) was centrifuged for 180 min at 55,000 rpm in Optima XL-IA instrument (Beckman Coulter) and data collected every 3 min. Interference sedimentation coefficient distributions (c(S) and c(M)) were calculated from the sedimentation velocity data (28) using SEDFIT (29). Partial specific volumes (Vbar), buffer density and viscosity were calculated by Sednterp (30). Sedimentation equilibrium measurements of samples of p75NTR·NGF complex were conducted with concentrations of 0.25 mg/ml and 0.50 mg/ml. Data were collected at two speeds (12,000 and 15,000 rpm) and the shape-independent molecular mass were calculated by Sedphat (31). All experiments were conducted at +20 °C.
Solution X-ray Scattering
Solution x-ray scattering data were collected at station 2.1 of the Daresbury Synchrotron Radiation Source (SRS) with sample-to-detector distances of 4.25 m and 1 m using a two-dimensional multiwire gas detector. The final concentrations of the samples were ~1 mg/ml and 3 mg/ml for the 4.25 m and 1 m distances, respectively. Samples and corresponding buffer solutions were measured at 4 °C as reported previously (32, 33). The profiles collected at both camera lengths were merged so as to cover the momentum transfer interval 0.03 Å−1 < q < 0.77 Å−1. The modulus of the momentum transfer is defined as q = 4π sin Θ/λ, where 2Θ is the scattering angle, and λ is the wavelength used (1.54 E). The maximum scattering angle corresponds to a nominal Bragg resolution of ~8 Å. The radius of gyration, the forward scattering intensity, and the intraparticle distance distribution function p(r) were evaluated with the indirect Fourier transform program GNOM (34).
Reconstruction of the molecular shape from the scattering profile alone was carried out ab initio with the program Gasbor18 (35). Numerous independent shape restorations were performed using both no symmetry as well as 2-fold symmetry constraints. Only the latter provided highly consistent shape models that are reminiscent of the elongated particle shape suggested by a 2:2 p75NTR·NGF complex. Models of the 1:2 (1sg1.pdb) (24) and 2:2 complexes (1sg12.pdb and 1bet2.pdb) (modeled based on the crystal structure of the 1:2 complex (24) but with a second p75NTR molecule added or on the crystal structure of an isolated NGF dimer (3) with two attached p75NTR monomers) were used in the theoretical calculation of scattering curves by the program CRYSOL (36). The latter takes into account the solvent effect by surrounding the protein with a 3 Å thick hydration layer and fitting its excess average scattering density. The experimental models were superimposed on the modeled 2:2 structure (1sg12.pdb) visually using the program Pymol (DeLano Scientific LLC).
RESULTS
Preparation of p75NTR and Measurement of Ligand Binding Affinity
We have expressed the ligand binding (extracellular) domain of the pan-neurotrophin receptor p75NTR extracellular domain (referred hereafter as p75NTR) as a secreted protein in T. ni cells. To study this complex as close as possible to its physiological state, we did not inhibit N-linked glycan formation during the expression. The recombinant p75NTR is secreted from the insect cells using an ecdysone S-glycotransferase signal peptide, rather than the native mammalian signal peptide.
A scintillation proximity assay of the ligand binding characteristics of the Ni-NTA purified p75NTR indicates that the recombinant protein binds NGF with an affinity comparable to native in situ systems (Fig. 1A). Based on 13 reports using a variety of methods (37), the binding constants for p75NTR range from 0.2 to 4 nm, with a mean and median of 1.3 nm and 0.9 nm, respectively. The T. ni expressed p75NTR binds NGF with a Kd of 2.1 × 10⁻⁹ m, with an R2 = 0.9885 (Fig. 1A) and 95% confidence intervals of 1.2 × 10⁻⁹ to 3.7 × 10⁻⁹.
FIGURE 1.
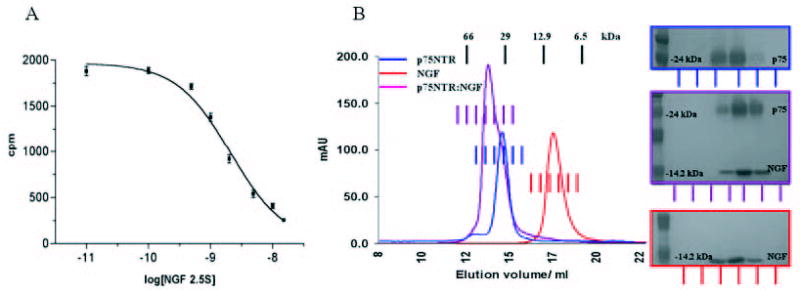
A, scintillation proximity assay of purified p75NTR with mouse 2.5 S NGF. Best fit is Kd = 2.101 ·10−9 m, with an R2 = 0.9885. B, S200 size exclusion chromatography of p75NTR, NGF, and the p75NTR·NGF complex. The colored bars mark fractions analyzed on SDS-PAGE. Molecular mass calibration is indicated at the top.
Size Exclusion Chromatography
The p75NTR ligand binding domain migrates as a single peak in Sephadex S200 size exclusion medium (Fig. 1B). The observed molecular mass of the major peak approaches 30 kDa, although the unglycosylated protein has a theoretical mass of 19.45 kDa. The extra mass is likely to represent material obtained from N-glycosylation. Also, the overall conformation of the p75NTR ligand binding domain is not globular, but rather elongated and flexible, which renders a direct comparison to globular molecular mass calibration markers arbitrary. NGF elutes at a volume corresponding to ~10 kDa, which is smaller than expected from its dimeric size (a 26.99-kDa dimer), possibly because of the highly charged nature of this protein (pI ~9) (Fig. 1B). Analytical ultracentrifugation, however, indicates that the NGF is entirely dimeric under these conditions (see below).
Application of approximately equimolar amounts of p75NTR and NGF to size exclusion medium results in a singular peak, which elutes before p75NTR (Fig. 1B). The peak has a shoulder, which appears to overlap with the elution position of p75NTR, implying that an excess of p75NTR is present in this particular mixture. Indeed, adding an approximate 2-fold excess of NGF to the p75NTR sample leads to the disappearance of the shoulder (data not shown). Samples for the measurements of stoichiometry by mass spectrometric methods were prepared by collecting p75NTR-, NGF-, and p75NTR·NGF-containing fractions as shown in Fig. 1B. To reduce any unbound p75NTR in our preparation, p75NTR·NGF complex samples for analytical ultracentrifugation and solution x-ray scattering were treated with an excess of NGF and the complex was isolated by size exclusion chromatography.
Mass Spectrometry
Analysis of the intact p75NTR·NGF complex by electrospray ionization mass spectrometry reveals a series of charge states that correspond to a single species with a mass of 68.37 kDa (see Fig. 2) (38). To determine the composition of this species, we carried out a tandem mass spectrometry experiment (collision-induced dissociation or CID), which acts to break the complex ions into highly charged monomer ions and less charged stripped oligomer ions (27, 39). The individual subunits of NGF and p75NTR, observed with masses corresponding to 13.27 kDa and 20.92 kDa, respectively (Fig. 2), are consistent with mass spectrometric analysis performed on the protein constituents isolated in solution (data not shown). The stripped complexes, in the high mass region, correspond to complexes with 2:1 (55.10 kDa) and 1:2 (47.45 kDa) p75NTR·NGF stoichiometries, providing supporting evidence of the existence of a 2:2 complex. It is important to note that our data suggest that neither the 2:1, 1:2, nor the monomeric protein is present in solution; rather the ion signals shown in the inset of Fig. 2 are the products of an energetic unimolecular decay reaction carried out in the gas phase, designed to probe the composition of the complex. Indeed, we did not detect 2:1 complexes during the experimental mass spectrometry phase.
The data shown in Fig. 2 further indicate the observed mass of 68.37 kDa for the intact protein complex, a value which is significantly higher than expected for an unglycosylated complex formed between p75NTR and NGF (65.89 kDa). A more detailed inspection of the tandem mass spectrometry data, shown in Fig. 3A, reveals further evidence for modification of p75NTR within the protein complex. At least three distinct species can be assigned to monomeric p75NTR observed in the tandem mass spectrum corresponding to proteins having approximate masses of 20.6, 20.7, and 20.9 kDa. Note also that the NGF monomer signal exhibits evidence of modification (bimodal distribution separated by ~100 Da, noted by an asterisk in Fig. 3A). The source of this apparent chemical modification is currently unclear, as isolated samples of NGF showed no evidence of chemical modification (data not shown); however, this unknown modification apparently does not disrupt the formation of the protein complex.
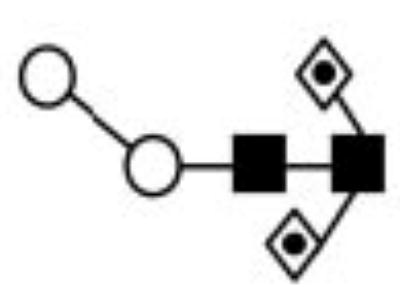
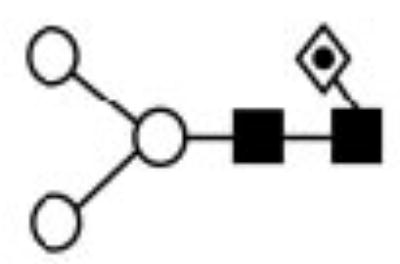
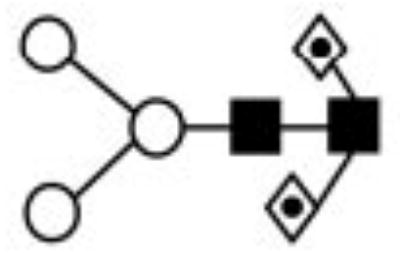
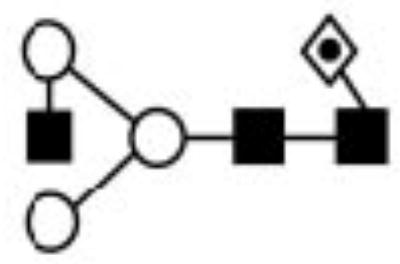
The mass differences observed between the three principal p75NTR species ejected from the protein complex upon collisional activation are suggestive of an N-linked glycosylation series. By comparison, a mass spectrum of p75NTR purified separately in solution (Fig. 3B) gives rise to five distinct species. The three predominate species, separated by ~160 and 200 Da, respectively, correspond closely to the pattern observed for the +8 charge state of p75NTR ejected from the protein complex. Given the mass of the modification and the similarity between monomeric p75NTR and that ejected from the complex, the results indicate that the predominant glycoforms (labeled II, III, and IV in Fig. 3B) are participating in the p75NTR·NGF complex. Enzymatic digestions followed by MALDI-TOF/TOF analysis indicate that the p75NTR preparation contains both linear and branched glycans consisting of fucose, mannose, and N-acetylglucosamine (GlcNAc) (TABLE ONE). T. ni cells are known to attach these fucosylated paucomannosidic structures (40). Fig. 3C shows the distribution of glycopeptides observed by MALDI-MS after tryptic digestion and carboxymethylation. The data correlate well with the data obtained for the intact glycoprotein and show a remarkably similar distribution of glycoforms when compared with ESI-MS data (Fig. 3B).
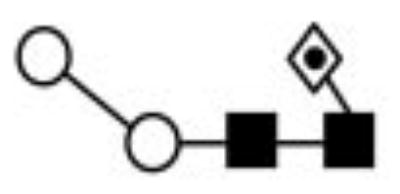
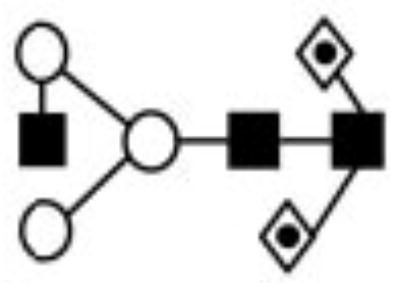
TABLE ONE. Assignments of the molecular ions observed in the MALDI-TOF spectra of glycopeptides and released permethylated N-glycans at Asn60 on p75NTP.
High-energy CID, using a MALDI-TOF/TOF tandem mass spectrometer, was employed to elucidate the structures of the N-glycans. Monosaccharides and linkages are represented by shapes and lines as described by Butler et al. (49). Major structures are highlighted in bold text.
| Reference Symbol (Figure 3) | Glycopeptide m/zavg [M + H]+ | Observed glycan residue massavg | Excepted glycan residue massavg | Observed permethylated glycan m/zmono [M + Na]+ | Excepted permethylated glycan m/zmono [M + Na]+ | Carbohydrate assignments | Glycan structure |
|---|---|---|---|---|---|---|---|
| I | 7809.71 | 875.06 | 876.16 | 1141.53 | 1141.57 | Hex2HexNAc2Fuc |
|
| II | 7956.07 | 1021.42 | 1022.30 | 1315.67 | 1315.66 | Hex2HexNAc2Fuc2 |
|
| - | 7971.66 | 1037.01 | 1038.30 | 1345.64 | 1345.67 | Hex3HexNAc2Fuc |
|
| III | 8118.19 | 1183.54 | 1184.44 | 1519.78 | 1519.76 | Hex3HexNAc2Fuc2 |
|
| - | 8175.04 | 1240.39 | 1241.49 | 1590.74 | 1590.79 | Hex3HexNAc3Fuc |
|
| IV | 8321.29 | 1386.64 | 1387.63 | 1764.90 | 1764.89 | Hex3HexNAc3Fuc2 |
|
 = Fucose
= Mannose
= N-acetylglucosamine (GlcNAc)
The N-linked glycans have compositions consistent with fucosylated paucomannosidic core structures (Fuc1–2Hex2–3HexNAc2) and a structure bearing one short antenna that is composed of HexNAc (Fuc1–2Hex3HexNAc3). The glycoforms labeled II, III, and IV in the mass spectrum shown in Fig. 3C correspond to the most abundant difucosylated structures Hex2HexNAc2Fuc2, Hex3HexNAc2Fuc2, and Hex3HexNAc3Fuc2, respectively.
Analytical Ultracentrifugation
To verify the molecular masses of the complex and its components under solution conditions, we have used sedimentation velocity and sedimentation equilibrium analytical ultracentrifugation (AUC) analyses of gel-filtered p75NTR, NGF, and the p75NTR·NGF complex. The calculated molecular mass obtained from the sedimentation velocity data for p75NTR is 21.99 kDa (Fig. 4A). The corresponding sedimentation coefficient (S) and frictional coefficients are 1.7 and 1.8, respectively, and the r.m.s.d. is 0.03. The relative abundance of p75NTR is 98.5%, and the weight average partial specific volume (vbar) is 0.696. The weight of the recombinant p75NTR is inclusive of N-linked glycosylation, accounting for the deviation from the expected theoretical (unglycosylated) mass of 19.45 kDa. The recovered frictional coefficient corresponds to the elongated structure of p75NTR, as seen in the asymmetric crystallographic p75NTR·NGF structure (24). Likewise, sedimentation velocity measurements of rhNGF are in accordance with previous structural information (3) (Fig. 4B). The measured S of NGF is 2.49. Both the frictional coefficient (1.2, r.m.s.d. = 0.013) and recovered molecular mass (26.99 kDa) correspond to the theoretical molecular mass (26.99 kDa) and the shape of NGF, as determined by crystallography (3). Dimeric NGF has an abundance of 95% in the sample with a vbar of 0.7261.
FIGURE 4. Analytical ultracentrifugation data of p75NTR, NGF, and p75NTR·NGF complex.
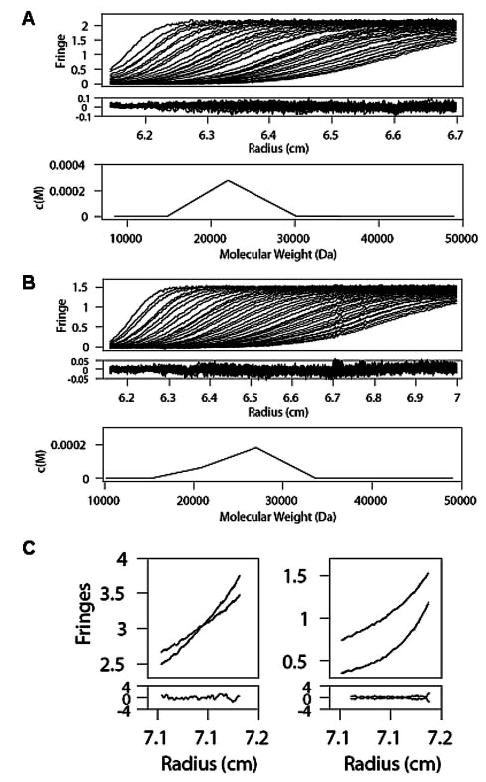
p75NTR (A) and NGF (B) sedimentation velocity measurements. Collected data (top), fringes (middle), and continuous c(M) distribution (bottom) (C) p75NTR·NGF complex sedimentation equilibrium measurement at 0.25 mg/ml (left panel) and 0.5 mg/ml (right panel). Both concentrations were run at two speeds.
Measurement of p75NTR·NGF complex by sedimentation velocity AUC indicated two species of ~20 and 60 kDa. These were later confirmed to be free monomeric p75NTR and the 2:2 p75NTR·NGF complex. p75NTR·NGF complex measurements by sedimentation equilibrium AUC were conducted with NGF saturated samples in order to minimize the amount of any unbound p75NTR. Measurements with such p75NTR·NGF preparations allow for a shape-independent determination of a molecular mass of 68.62 kDa (r.m.s.d. = 0.006, vbar = 0.71), which corresponds to a 2:2 complex by theoretical masses of the components (65.89 kDa) (Fig. 4C). Taken together, our mass spectrometric and analytical ultracentrifugation experiments on this p75NTR·NGF complex are indicative of a 2:2 stoichiometry under our experimental conditions, without detectable levels of any asymmetric 2:1 complexes.
Solution X-ray Scattering and Molecular Modeling of 2:2 p75NTR·NGF Complex
X-ray scattering measurements of NGF-saturated p75NTR·NGF samples provide further support for the existence of the 2:2 complex, and allow molecular reconstructions of the p75NTR·NGF complex. Data collection at 4.25- and 1-m camera lengths allowed us to obtain a scattering profile covering both the low and high angle regions (Fig. 5). Comparisons with the calculated data of the 1:2 p75NTR·NGF complex (1sg1.pdb) (24), show that at low angle the fit of the experimental data is not satisfactory (the intensity at zero scattering angle is proportional to the molecular mass) and therefore suggests a complex of larger mass. Examining the intensity ratio at the zero scattering angle between the experimental value and the calculated value for the 1:2 complex, the ratio of 1.38 correlates very well, i.e. is within the error limit of 5%, with the expected mass ratio between a 2:2 and 1:2 complex (1.44). Thus, the scattering data support the existence of a p75NTR·NGF complex with two bound p75NTR soluble domains. The calculated maximum particle dimension for the complex is 105 Å (Fig. 5, inset).
FIGURE 5. Comparison of the merged experimental x-ray scattering curve of the p75NTR·NGF complex with simulated profiles of 1sg1.pdb (2:1 complex) and two conceptual 2:2 complexes: 1sg12.pdb, derived from 1sg1.pdb, and 1bet2.pdb, derived from 1bet.pdb.
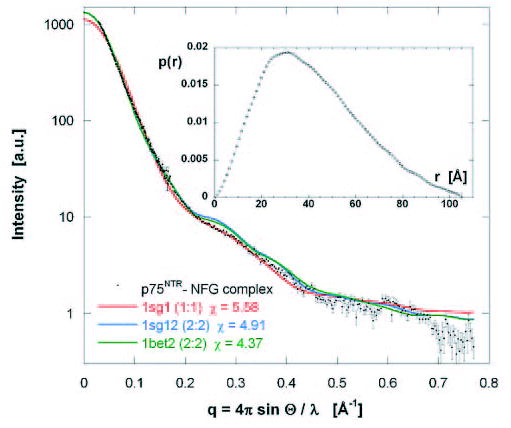
The inset displays the distance distribution function p(r) from which a maximum particle dimension of 105 Å is deduced.
Conceptual models corresponding to a 2:2 complex were constructed based on the crystal structure of the 2:1 p75NTR·NGF (1sg1.pdb), by adding another molecule of p75NTR to the other side of NGF dimer. The first of these models, 1sg12.pdb, is a direct derivative of 1sg1.pdb and the second, (1bet2.pdb) is built around the dimer of mouse NGF (1bet.pdb) (3). The experimental data fit these models better at very low angles, suggesting that a direct 2:2 derivative of 1sg1.pdb may be a better representation of our complex (Fig. 5). The goodness-of-fit value (χ) for the fit with 1sg1.pdb is 5.58, but the addition of another p75NTR molecule (1sg12.pdb) improves this to 4.91. Interestingly, the fit for the complex based on the structure of free NGF (1bet2.pdb) has the lowest χ-value of 4.37, possibly implying that our complex does not involve a distorted NGF dimer. The calculated Rg of our complex is 32.7 Å, whereas the theoretical Rg of 1sg1.pdb (1bet2.pdb) is 27.0 Å (29.6 Å). This deviation from the theoretical value for the 2:1 complex further underlines the increased mass around the perimeter in our complex. We also note that glycan chains have not been included in the scattering profile simulations.
Ab initio molecular reconstructions of the complex generated models with an approximately discoid-like shape (Fig. 6, A and B). These models are easily superimposable with the conceptual 2:2 complexes 1sg12.pdb (Fig. 6C) and 1bet2.pdb, but show a poor agreement with 1sg1.pdb. Our models indicate that the binding mode of p75NTR in a 2:2 model for the complex is comparable to 1sg1.pdb (Fig. 6, A and B). Accordingly, the NGF binding domains of p75NTR are likely in the places indicated in 1sg1.pdb, suggesting that the specific interactions between p75NTR and NGF are the same in 1sg1.pdb and in our complex.
FIGURE 6. Molecular models of 2:2 p75NTR·NGF complex.
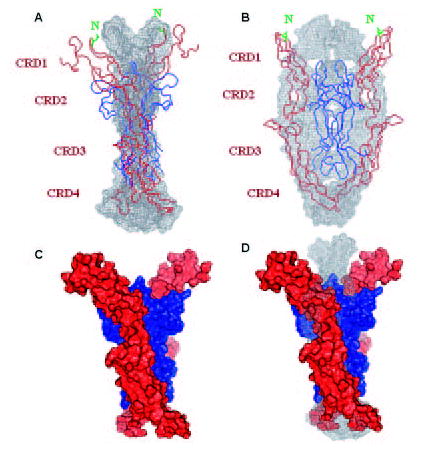
A and B, SAXS-derived Gasbor18 model of p75NTR·NGF complex (black mesh) from two different views, superimposed with 1sg12.pdb (as α-carbon trace, NGF in blue and p75NTR in red). The CRDs and the N-glycosylation sites (Asn60) of the human protein are indicated. C, surface representation of the conceptual model 1sg12.pdb with NGF in blue and p75NTR in red. D, p75NTR·NGF superimposed with 1sg12.pdb (as in C), showing the observed alternative first CRD conformation.
The first cystine-rich domains (CRD1) of the p75NTR in our complex are closer together (Fig. 6D). CRD1 is also the site of N-linked glycosylation (Asn60) of p75NTR, and in 1sg1.pdb, this residue faces toward NGF (Fig. 6, A and B). Thus in the glycosylated forms of p75NTR a 2:2 complex should have the N-glycan moieties extending toward one another, possibly allowing for molecular contacts or resulting in conformational changes of p75NTR. The last cystine-rich domains (CRD4) extend toward each other (Fig. 6, A and B). This conformation is possibly suggestive of the p75NTR death domain dimerization capacity of the symmetric p75NTR·NGF complex.
DISCUSSION
We have cloned and expressed the ligand binding domain of the human pan-neurotrophin receptor, p75NTR. The glycosylated p75NTR shows a ligand binding affinity characteristic of native systems (37), indicating that our p75NTR is active. Although the unliganded p75NTR occurs as a dimer on neuronal membranes (22, 23), our soluble glycosylated ligand binding domain remains strictly monomeric, as shown by mass spectrometry and sedimentation equilibrium analyses. The physiological p75NTR dimer is thus mediated at least in part by interactions outside of the ligand binding domain of p75NTR.
Mass spectrometry and analytical ultracentrifugation experiments unambiguously demonstrate a 2:2 stoichiometry of the p75NTR·NGF complex under the conditions reported here. This finding differs from the recent crystallographic analysis of p75NTR·NGF (24), which indicates an asymmetric 1:2 stoichiometry of one p75NTR to a dimeric NGF. Although both the experiments reported here and those by He and Garcia (24) used the same rhNGF (Genentech), there are some notable differences in our p75NTR preparations. Firstly, our p75NTR is of human origin, whereas He and Garcia (24) used p75NTR based on the rat protein sequence. This is unlikely to cause dramatic alterations in the complex-forming properties between these proteins, as they share a 94% identity in the ligand binding domain. Secondly, we have opted for production of glycosylated p75NTR; He and Garcia (24) used tunicamycin to inhibit glycosylation. The unglycosylated rat p75NTR is reported to have an affinity constant (for NGF) approximately two orders of magnitude lower (24) than that measured here. It is, however, likely that this reflects differences in the employed experimental methods.
Differences between these two p75NTR preparations are exemplified by the fact that the unglycosylated rat p75NTR exists as a mixture of monomers and dimers, whereas our preparation remains monomeric. Previously, the importance of N-linked glycosylation in NGF signaling has been demonstrated with pheochromocytoma (PC12) cells, which express both p75NTR and TrkA. Incubation of these cells with tunicamycin alters the binding rate of NGF and impairs their neurite elaboration capacity, suggesting that N-linked carbohydrate chains are instrumental in the function of the NGF receptor(s) (41). It is thus possible that a p75NTR, devoid of N-linked glycosylation, has both kinetic and complex-forming properties that do not correlate to the physiological function of this receptor.
It is also possible that the interactions between p75NTR and NGF share characteristics of interactions between the structural NGF homologue, the Drosophila growth factor Spätzle, and its receptor Toll. In this system, the binding of the first Toll molecule to Spätzle reduces the affinity of the second binding event, an example of negative cooperativity (42). Strikingly, the authors describe the result of these non-equivalent binding events as an ability of Spätzle and Toll to form selectively both symmetric and asymmetric complexes (42).
The data shown in Fig. 3 suggest that some but not all glycoforms present in solution may participate in the protein complex. It is also interesting to note that the type of terminal (agalactosyl) glycoform structure identified in our preparation of p75NTR is commonly found in proteins derived from the mammalian brain (43, 44), and may have relevance to the complex-forming properties of p75NTR.
The possible existence of both symmetric and asymmetric complexes of p75NTR and NGF requires explanation. From a functional point of view, the apoptotic function of p75NTR (in the absence of the Trks) is mediated by a diverse collection of intracellular adaptors and signaling moieties (for review, see Ref. 45). One important such moiety is TNF receptor-associated factor 6 (TRAF6), which induces apoptosis by activation of the JNK pathway (19). Past work with PDGF-p75NTR chimeras has clearly indicated that it is the dimeric form of p75NTR that is responsible for activation of TRAF6 (46). Considering that TRAF6 is the key mediator of p75NTR-mediated activation of JNK (and NFκB) (19), it is likely that the symmetric form of p75NTR·NGF complex is important for mediation of apoptosis and survival. At the same time, the crystallographic p75NTR·NGF structure (24) shows the C-terminal CRD of p75NTR (CRD4) extending toward the opposite side of the complex. In a symmetric complex (with a comparable binding mode of p75NTR to NGF) this arrangement would allow for close interaction between the two p75NTR molecules below the ligand-binding domain, which could possibly lead to the dimerization of the intracellular death domains. Our molecular models are in accordance with this CRD4 arrangement. It is possible that the asymmetric complex is involved in signaling to mediators that may favor monomeric p75NTR, such as TRAF2 (47), which would highlight the biological relevance of the asymmetric stoichiometry. Also, it is possible that the asymmetric complex is an intermediate to the symmetric complex.
Our solution x-ray scattering experiments are suggestive of more bulk around the periphery of the complex, as compared with the asymmetric complex (24). The measurements also allowed us to obtain low resolution molecular reconstructions. Although our complex has a different stoichiometry, the binding mode of p75NTR to NGF is largely consistent with that of He and Garcia (24). The crystallographic structure implied that a 1:2:2 ternary complex (p75NTR·NGF·TrkA-d5) cannot exist because of overlap between the p75NTR and one of the TrkA-d5 binding site on NGF (24). Rather, the possibility of assembling an asymmetric 1:2:1 complex by binding one of each of p75NTR and TrkA-d5 to an NGF dimer was suggested. Although such complex could potentially signal via TRAF2, the full signaling potential of a complex with a single TrkA remains unclear.
Because we find that the binding mode of p75NTR in the glycosylated 2:2 p75NTR·NGF complex is comparable to that of the single deglycosylated p75NTR in the complex of He and Garcia (24), it is likely that this configuration effectively shields both TrkA-d5 binding sites (for NGF) in our complex. Thus a symmetric 2:2:2 ternary complex consisting of p75NTR, NGF, and TrkA is unlikely to be mediated by the NGF binding domains of both p75NTR and TrkA. Further, the assembly of an asymmetric 1:2:1 (p75NTR·NGF·TrkA-d5) would require detachment of one p75NTR from the 2:2 p75NTR·NGF complex. The elusive symmetric 2:2:2 high affinity p75NTR·NGF·TrkA complex may still, however, exist through further interactions between p75NTR and TrkA outside the NGF binding domains (48).
Supplementary Material
Acknowledgments
We thank Drs. Moses Chao, Nicholas Harmer, Nisse Kalkkinen, Ben Luisi, and Alex Weber for help and support. We thank Genentech for the generous gift of rhNGF.
Footnotes
This work was supported in part by Wellcome Trust grants, a Cambridge University Parke-Davis Visiting Fellow Award, and by the Walters-Kundert trust and Biotechnology and Biological Sciences Research Council (to B. T. R., C. V. R., and E. S.).
The on-line version of this article (available at http://www.jbc.org) contains Supplemental Data.
The abbreviations used are: NGF, nerve growth factor; NTA, nitrilotriacetic acid; AUC, analytical ultracentrifugation; OD, outer diameter; ID, inner diameter; r.m.s.d., root mean square deviation; CID, collision-induced dissociation; NTR, neurotrophin receptor; CRD, cystine-rich domain; MALDI-TOF, matrix-assisted laser desorption/ionization time-of-flight.
References
- 1.Ibanez C. Trends Neurosci. 2002;25:284–286. doi: 10.1016/s0166-2236(02)02169-0. [DOI] [PubMed] [Google Scholar]
- 2.Shooter E. Annu Rev Neurosci. 2001;24:601–629. doi: 10.1146/annurev.neuro.24.1.601. [DOI] [PubMed] [Google Scholar]
- 3.McDonald N, Lapatto R, Murray-Rust J, Gunning J, Wlodawer A, Blundell T. Nature. 1991;354:411–414. doi: 10.1038/354411a0. [DOI] [PubMed] [Google Scholar]
- 4.Huang EJ, Reichardt LF. Annu Rev Biochem. 2003;72:609–642. doi: 10.1146/annurev.biochem.72.121801.161629. [DOI] [PubMed] [Google Scholar]
- 5.Bothwell M. Annu Rev Neurosci. 1995;18:223–253. doi: 10.1146/annurev.ne.18.030195.001255. [DOI] [PubMed] [Google Scholar]
- 6.Bibel M, Hoppe E, Barde YA. EMBO J. 1999;18:616–622. doi: 10.1093/emboj/18.3.616. [DOI] [PMC free article] [PubMed] [Google Scholar]
- 7.Chao MV. Nat Rev Neurosci. 2003;4:299–309. doi: 10.1038/nrn1078. [DOI] [PubMed] [Google Scholar]
- 8.Chao MV, Bothwell MA, Ross AH, Koprowski H, Lanahan AA, Buck CR, Sehgal A. Science. 1986;232:518–521. doi: 10.1126/science.3008331. [DOI] [PubMed] [Google Scholar]
- 9.Radecke MJ, Misko TP, Hsu C, Herzenberg LA, Shooter EM. Nature. 1987;325:593–597. doi: 10.1038/325593a0. [DOI] [PubMed] [Google Scholar]
- 10.Klein R, Jing SQ, Naduri V, O’Rourke E, Barbacid M. Cell. 1991;65:189–197. doi: 10.1016/0092-8674(91)90419-y. [DOI] [PubMed] [Google Scholar]
- 11.Kaplan DR, Hempstead BL, Martin-Zanca D, Chao MV, Parada LF. Science. 1991;252:554–556. doi: 10.1126/science.1850549. [DOI] [PubMed] [Google Scholar]
- 12.Chao MV, Hempstead BL. Trends Neurosci. 1995;18:321–326. [PubMed] [Google Scholar]
- 13.Chao MV. J Neurobiol. 1994;25:1373–1385. doi: 10.1002/neu.480251106. [DOI] [PubMed] [Google Scholar]
- 14.Carter BD, Kaltschmidt C, Kaltschmidt B, Offenhaeuser N, Boehm-Matthaei R, Baeurle PE, Barde YA. Science. 1996;272:542–545. doi: 10.1126/science.272.5261.542. [DOI] [PubMed] [Google Scholar]
- 15.Sofroniew MV, Howe CL, Mobley WC. Annu Rev Neurosci. 2001;24:1217–1281. doi: 10.1146/annurev.neuro.24.1.1217. [DOI] [PubMed] [Google Scholar]
- 16.Coulson EJ, Reid K, Baca M, Shipham KA, Hulett SM, Kilpatrick TJ, Bartlett PF. J Biol Chem. 2000;275:30537–30545. doi: 10.1074/jbc.M005214200. [DOI] [PubMed] [Google Scholar]
- 17.Mamidipudi V, Wooten M. J Neurosci Res. 2002;68:373–384. doi: 10.1002/jnr.10244. [DOI] [PubMed] [Google Scholar]
- 18.Rabizadeh S, Bredesen DE. Cytokine Growth Factor Rev. 2003;14:225–239. doi: 10.1016/s1359-6101(03)00018-2. [DOI] [PubMed] [Google Scholar]
- 19.Yeiser EC, Rutkoski NJ, Naito A, Inoue JI, Carter BD. J Neurosci. 2004;24:10521–10529. doi: 10.1523/JNEUROSCI.1390-04.2004. [DOI] [PMC free article] [PubMed] [Google Scholar]
- 20.Liepinsh E, Ilag L, Otting G, Ibanez C. EMBO J. 1997;16:4999–5005. doi: 10.1093/emboj/16.16.4999. [DOI] [PMC free article] [PubMed] [Google Scholar]
- 21.Tyson, D. R., and Bradshaw, R. A. (2003) in Handbook of Cell Signaling (Bradshaw, R. A., and Dennis, E. A., eds) Vol. 1, pp. 361–366, Elsevier Academic Press, San Diego, CA
- 22.Jing S, Tapley P, Barbacid M. Neuron. 1992;9:1067–1079. doi: 10.1016/0896-6273(92)90066-m. [DOI] [PubMed] [Google Scholar]
- 23.Grob PM, Ross AH, Koprowski H, Bothwell M. J Biol Chem. 1985;260:8044–8049. [PubMed] [Google Scholar]
- 24.He XL, Garcia KC. Science. 2004;304:870–875. doi: 10.1126/science.1095190. [DOI] [PubMed] [Google Scholar]
- 25.Nelson N. Anal Biochem. 1987;165:287–293. doi: 10.1016/0003-2697(87)90271-5. [DOI] [PubMed] [Google Scholar]
- 26.Mahadeo D, Kaplan L, Chao M, Hempstead B. J Biol Chem. 1994;269:6884–6891. [PubMed] [Google Scholar]
- 27.Lightwahl K, Schwartz B, Smith R. J Am Chem Soc. 1994;116:5271. [Google Scholar]
- 28.Stafford W. Anal Biochem. 1992;203:295–301. doi: 10.1016/0003-2697(92)90316-y. [DOI] [PubMed] [Google Scholar]
- 29.Schuck P. Biophys J. 2000;78:1606–1619. doi: 10.1016/S0006-3495(00)76713-0. [DOI] [PMC free article] [PubMed] [Google Scholar]
- 30.Laue, T., Shaw, B., Ridgeway, T., and Pelletier, S. (1992) Analytical Ultracentrifugation in Biochemistry and Polymer Science, pp. 90–120, The Royal Society of Chemistry, Cambridge, UK
- 31.Vistica J, Dam J, Balbo A, Yikilmaz E, Mariuzza R, Rouault T, Schuck P. Anal Biochem. 2004;326:234–256. doi: 10.1016/j.ab.2003.12.014. [DOI] [PubMed] [Google Scholar]
- 32.Grossmann J, Hall J, Kanbi L, Hasnain S. Biochemistry. 2002;41:3613–3619. doi: 10.1021/bi015955o. [DOI] [PubMed] [Google Scholar]
- 33.Falck S, Paavilainen V, Wear M, Grossmann J, Cooper J, Lappalainen P. EMBO J. 2004;23:3010–3019. doi: 10.1038/sj.emboj.7600310. [DOI] [PMC free article] [PubMed] [Google Scholar]
- 34.Semenyuk A, Svergun D. J Appl Crystallogr. 1991;22:537–540. [Google Scholar]
- 35.Svergun D, Petoukhov M, Koch M. Biophys J. 2001;80:2946–2953. doi: 10.1016/S0006-3495(01)76260-1. [DOI] [PMC free article] [PubMed] [Google Scholar]
- 36.Svergun D, Barberato C, Koch M. J Appl Crystallogr. 1995;28:768–773. [Google Scholar]
- 37.Neet K, Campenot R. Cell Mol Life Sci. 2001;58:1021–1035. doi: 10.1007/PL00000917. [DOI] [PMC free article] [PubMed] [Google Scholar]
- 38.Sobott F, Robinson C. Curr Opin Struct Biol. 2002;12:729–734. doi: 10.1016/s0959-440x(02)00400-1. [DOI] [PubMed] [Google Scholar]
- 39.Jurchen J, Williams E. J Am Chem Soc. 2003;125:2817–2826. doi: 10.1021/ja0211508. [DOI] [PMC free article] [PubMed] [Google Scholar]
- 40.Rudd P, Downing A, Cadene M, Harvey D, Wormald M, Weir I, Dwek R, Rifkin D, Gleizes P. Biochemistry. 2000;39:1596–1603. doi: 10.1021/bi9918285. [DOI] [PubMed] [Google Scholar]
- 41.Baribault T, Neet K. J Neurosci Res. 1985;14:49–60. doi: 10.1002/jnr.490140105. [DOI] [PubMed] [Google Scholar]
- 42.Weber A, Moncrieffe M, Gangloff M, Imler J, Gay N. J Biol Chem. 2005;280:22793–22799. doi: 10.1074/jbc.M502074200. [DOI] [PubMed] [Google Scholar]
- 43.Hoffmann A, Nimtz M, Wurster U, Conrad H. J Neurochem. 1994;63:2185–2196. doi: 10.1046/j.1471-4159.1994.63062185.x. [DOI] [PubMed] [Google Scholar]
- 44.Hoffmann A, Nimtz M, Getzlaff R, Conrad H. FEBS Lett. 1995;359:164–168. doi: 10.1016/0014-5793(95)00034-7. [DOI] [PubMed] [Google Scholar]
- 45.Nykjaer A, Willnow T, Petersen C. Curr Opin Neurobiol. 2005;15:49–57. doi: 10.1016/j.conb.2005.01.004. [DOI] [PubMed] [Google Scholar]
- 46.Foehr E, Lin X, O’Mahoni A, Geleziunas R, Bradshaw R, Greene W. J Neurosci. 2000;20:7556–7563. doi: 10.1523/JNEUROSCI.20-20-07556.2000. [DOI] [PMC free article] [PubMed] [Google Scholar]
- 47.Ye X, Mehlen P, Rabizadeh S, VanArsdale T, Zhang H, Shin H, Wang J, Leo E, Zapata J, Hauser C, Reed J, Bredesen D. J Biol Chem. 1999;274:30202–30208. doi: 10.1074/jbc.274.42.30202. [DOI] [PubMed] [Google Scholar]
- 48.Esposito D, Patel P, Stephens R, Perez P, Chao M, Kaplan D, Hempstead B. J Biol Chem. 2001;276:32687–32695. doi: 10.1074/jbc.M011674200. [DOI] [PubMed] [Google Scholar]
- 49.Butler M, Quelhas D, Critchley A, Carchon H, Hebestreit H, Hibbert R, Vilarinho L, Teles E, Matthijs G, Schollen E, Argibay P, Harvey D, Dwek R, Jaeken J, Rudd P. Glycobiology. 2003;13:601–622. doi: 10.1093/glycob/cwg079. [DOI] [PubMed] [Google Scholar]
Associated Data
This section collects any data citations, data availability statements, or supplementary materials included in this article.


