

Abstract
The SfiI restriction enzyme binds to DNA as a tetramer holding two usually distant DNA recognition sites together before a complete cleavage of four DNA strands. To elucidate structural properties of the SfiI-DNA complex, atomic force microscopy (AFM) imaging of the complexes under non-cleaving reaction conditions (Ca2+ instead of Mg2+ in the reaction buffer) was performed. Intramolecular complexes formed by the interaction with two binding sites in one DNA molecule (cis interaction) as well as the complexes obtained by the interaction of two sites in different molecules (trans interaction) were analyzed. Complexes were identified unambiguously by the presence of a tall spherical blob at the DNA intersections. To characterize the path of DNA within the complex the angles between the DNA strands at the complex proximity regardless of the complex type were systematically analyzed. All the data show a clear-cut bimodal distributions centered around peak values corresponding to 60° and 120°. To unambiguously distinguish between the crossed and bent models for the DNA orientation within the complex, DNA templates with strands of different lengths and with different locations of the SfiI binding site were designed. The analysis of the AFM images for complexes of this type led to the conclusion that the DNA recognition sites within the complex are crossed. The angles 60° or 120° between the strands corresponds to complex in which one of the strands flipped the orientation relative to another. Both types of complexes for 5 different sequences in the center are present almost equally. This finding suggests that there is no preferential orientation of the DNA cognate site within the complex suggesting that the central part of the DNA binding site does not form strong sequence specific contacts with the protein.
Keywords: DNA synaptic complexes, protein-DNA interaction, restriction-modification, DNA looping, scanning probe microscopy
Restriction enzyme SfiI belongs to a family of type II restriction endonucleases that bind and cut two cognate sites (type IIf, e.g., article (1) and references therein). A few enzymes of type IIf enzymes have been analyzed (Bse634I, Cfr10I, NgoMIV, NaeI and SfiI) and some details shedding a light on the mechanisms of the actions have been revealed. SfiI has been studied extensively by Halford and coworkers (recent paper (2) and references therein). Crystallographic data have been obtained for Bse634I (3), NgoMIV (4) and Cfr10I (5). SfiI binds as a homotetramer to two recognition sites on DNA duplexes at the recognition sequence 5’-GGCCNNNN^NGGCC-3’ (N denotes any base and ^ marks a cleavage position) prior to cleavage (6). The recognition regions can be in one DNA molecule or in two different molecules (cis and trans position, respectively) with higher reaction rate for cis position due to the higher effective local concentration of the interacting sites for the intramolecular reaction versus the intermolecular situation (1, 6). Looped DNA structures are formed when the recognition sites are in cis; the protein can efficiently cut sites separated by as few as 104 bp (7, 8) with substantially higher affinity for supercoiled DNA substrates in case of short distances between the regions. However, there is no data on the SfiI-DNA complex structure, so such an important question as how two DNA regions are organized within the protein-DNA complex is not known. Although the sequences at the ends of the recognition region are palindromic, the middle region need not be symmetric. Therefore the questions whether the regions are oriented in a particular way or if there is no preference for the DNA orientation within the binding regions of the protein tetramer also remain unanswered. These questions are addressed in this paper.
We applied atomic force microscopy (AFM)1 to directly observe SfiI-DNA complexes under non-cleaving reaction conditions (Ca2+ instead of Mg2+ in the reaction buffer). The protein forms synaptic cis or trans types complexes with very high specificity. A systematic analysis of the AFM data showed that DNA recognition sites are crossed at 60° angle and the two different relative orientations of the recognition sites are equally populated in the SfiI-DNA complexes.
Experimental Procedures
Materials
Restriction enzymes SfiI, NspI and HindIII are from New England Biolabs (Beverly, MA). The concentration of SfiI was determined by densitometric scanning of SDS-PAGE gels stained with Coomassie Blue after the electrophoretic runs of commercial SfiI against known quantities of bovine serum albumin (9).
DNA design and manipulations
Plasmids pEO200, pEOF353 and pEOF504 are derivatives of pUC8 plasmid with two SfiI recognition sites introduced by site-directed mutagenesis. Briefly, to introduce the first SfiI site, the entire pUC8 was PCR amplified with two overlapping outward directed primers containing the SfiI sequence. After SfiI digestion, the linear plasmid with the SfiI sticky ends was circularized with T4 DNA ligase. The new plasmid was PCR amplified with another two overlapping primers containing the SfiI sequence, in which the five central base pairs were selected to match the XhoI sequence. After XhoI digestion, the linear plasmid that had the XhoI sticky ends two parts of the second SfiI site was circularized. Sequences of the SfiI recognition sites (underlined) are listed below: plasmid pEO200 (sites S1 5’-TTGGCCACCCCGGCCTT-3’ and S2 5’-TCGGCCTCGAGGGCCTC-3’ are separated by 200 bp); plasmid pEOF353 (sites S3 5’-GTGGCCTTGTGGGCCGA-3’ and S4 5’-GGGGCCTCGAGGGCCAT-3’ are separated by 353 bp) and plasmid pEOF504 (sites S5 5’-CCGGCCGCGTTGGCCGA-3’ and S4 5’-GGGGCCTCGAGGGCCAT-3’ are separated by 504 bp).
Linear DNA fragments with two SfiI sites were obtained by digestion of the plasmid with NspI endonucleases at conditions recommended by supplier. Double digestion of plasmid with NspI and HindIII releases two DNA fragments with one recognition site per fragment. Reaction conditions: 3–4 μg of plasmid in 50 uL of NEBuffer2 (provided by the supplier) first were incubated with 10 units of HindIII for 1 hour at room temperature, then 5 units of NspI were admixed in the reaction volume, followed by the second incubation for 1 hour at 37 °C. Restriction fragments were purified from a 1.8 % agarose gel using the QIAquick Gel Extraction Kit (Qiagen Inc., Valencia, CA), ethanol precipitated and diluted in HE buffer (10 mM HEPES, 1 mM EDTA, pH 7.5). DNA concentration was determined by absorption at 260 nm using the NanoDrop spectrophotometer (NanoDrop Technologies, Wilmington, DE). The complete set of DNA fragments studied in this work is shown in Fig. 1.
Figure 1.

The scheme of DNA fragments used in the paper. The SfiI recognition sites are indicated with open rectangles. The arm-site and inter site distances are shown in base pairs. DNA fragments are obtained from plasmids pEO200, pEOF353 and pEOF504 which are derivatives of pUC8 plasmid with SfiI recognition sites introduced by site-directed mutagenesis.
Preparation of SfiI-DNA complexes
A typical reaction mixture contained a 1:1 ratio of the protein tetramer per recognition site: 60 fmole of SfiI tetramer and 60 fmole of DNA fragment (with 1 recognition site) in 10 μL of reaction buffer A (10 mM HEPES, pH 7.5, 50 mM NaCl, 2 mM CaCl2, 0.1 mM EDTA and 1 mM DTT). The mixture was incubated for 15 min at room temperature followed by mixing with 0.5 % glutaraldehyde (1:1 ratio (v/v)) to crosslink the complex. After 5 min of crosslinking, the reaction was terminated by adding 1 μL of 2M Tris-HCl and purified by filtration through a UFC7 Millipore column. Filtrate was washed with 20 μL of reaction buffer and 2–3 μL was deposited onto APS mica.
Atomic Force Microscopy
Procedures for mica modification with 1-(3-aminopropyl) silatrane (APS-mica), the sample preparation and imaging were the described (10). Briefly, APS-mica was prepared by treatment of freshly cleaved mica with 167 μM water solution of APS. DNA samples (3–5 μL) were placed onto APS-mica for two minutes; then the sample was rinsed with deionized water (Labconco Co., Kansas City, MO) and dried with argon. Images were acquired in air using a MultiMode SPM NanoScope IV system (Veeco/Digital Instruments, Santa Barbara, CA) operating in Tapping mode. Tapping Mode Etched Silicon Probes (TESP; Veeco/Digital Instruments, Inc.) with spring constant ~ 42 N/m and resonant frequency ~ 320 kHz were used. Images processing and the cross-section, contour length and angle measurements were performed with the use of Femtoscan software (Advanced Technologies Center, Moscow, Russia).
The data analysis
The size of the protein in the complex was obtained from the volume data (11). The complex was extrapolated by a hemisphere with a diameter measured at half-maximal height of the protein measured from the cross-section analysis (12). Streptavidin-DNA complexes were used for the conversion the volume data into the protein size using the volume value for the streptavidin tetramer (60 kDa) bound to a biotin-labeled DNA (13, 14).
Angles between DNA duplexes at the crossovers decorated with protein particles were measured using the following procedure. A DNA segment of 10 nm long (an almost straight section of a DNA filament) just outside complex was used for the angle measurements (15). A line was drawn over the middle of the DNA filament and the angle between corresponding lines was measured as shown in Fig. 2d. The mean values, standard errors of the mean and the number of measured molecules are shown in the histograms and Tables.
Figure 2.
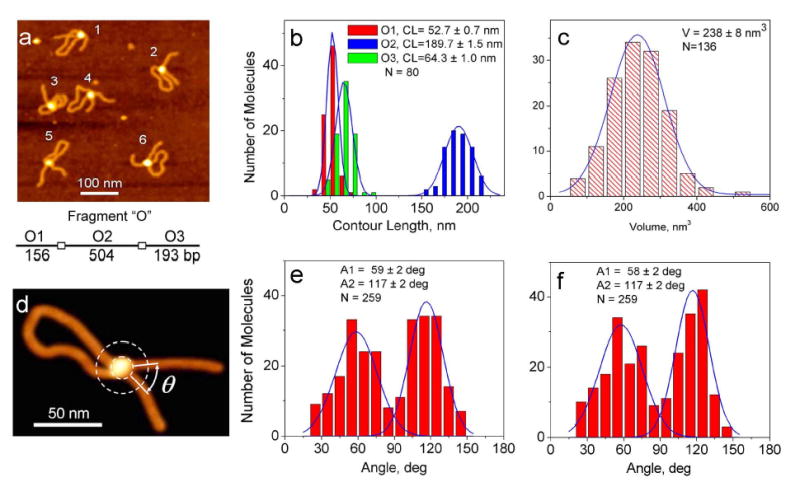
AFM images and the results of AFM analysis for SfiI complex in cis with fragment “O”. (a) AFM image of the 500x500 nm2 area with 6 molecules in the field. A scheme of the DNA fragment is shown below the image. All molecules on the image have a loop. (b) The histograms for the contour length (short arm O1 - red, long arm O3 - green and a circumference of the loop O2 – blue). (c) The histogram for SfiI volume measurements. The height and diameter at a half-maximal height were obtained from cross-section analysis and the protein shape was extrapolated by a hemisphere to calculate the volume (12). To convert SfiI volume data into protein size the streptavidin-DNA complex was used as a standard with the volume value for the streptavidin tetramer (60 kDa) bound to a biotin-labeled DNA (13, 14). (d) The scheme illustrating the procedure for measuring of the angle Θ between DNA strands. DNA segments of 10 nm long (an almost straight section of DNA filament) just outside the complex were used for angle measurements (15). (e) The histogram for the angle between DNA arms outside the loop. (f) The histogram for the angle between DNA strands inside the loop.
Results and Discussion
1. DNA design
DNA fragments used in this paper (Figure 1) were obtained by cutting out a selected DNA section from various plasmids. It includes two fragments with two recognition sites per fragment with distances 504 and 200 bp between the sites (fragments O and P respectively) and two fragments with one recognition site per fragment (fragments M and L). The distances between the ends of the molecules and the closest protein binding site (termed arms) and the distances between two recognition regions (in base pairs) are indicated for each fragment.
2. AFM analysis of cis SfiI-DNA complexes
The SfiI complexes were obtained in the reaction buffer with 2 mM CaCl2 instead of magnesium to prevent the DNA cleavage (16). The image of SfiI complexes with fragment O is shown in Figure 2a. All DNA molecules on this image have clear-cut looped morphology with a bright spot at the crossover. The looped DNA structures are predominate morphologies for this type of the complex found in 85 % cases. Other morphologies are naked DNA (12 %), complex of protein bound to one recognition site on the same DNA fragment (~2 %) and trans type complex with SfiI bound to two DNA fragments (~1%). The data for measurements of the arm length and the circumferences of the loop are shown in Figure 2b. The measured arm lengths are 52.7 ± 0.7 and 64.3 ± 1.0 nm, and loop size 189.7 ± 1.5 nm (N=80). These numbers are in a good coincidence with expected values 53, 66 and 171 nm, respectively, calculated from the sequence data using parameters for B-DNA (0.34 nm per base pair), suggesting that specific synaptic complexes formed with a high efficiency.
To estimate the size of SfiI in the complex with DNA we measured the volume of the protein particles for a large number of synaptic-type complexes. The histogram for the volume measurements (Fig. 2c) provides the mean value 238 ± 8 nm3 (N=136). We used our AFM data obtained for streptavidin tetramer (60 kDa) bound to biotinylated sites on DNA (13) to convert SfiI volume into molecular mass. Using the streptavidin tetramer volume (122 nm3) the calculated molecular mass of SfiI in complex with DNA is 117 kDa very close to expected tetramer size of the protein (124 kDa) (6, 17). This finding suggests that tetramer organization of the protein remains unchanged upon the preparation of the sample for AFM.
Images of the molecules in Figure 2a show that the angle between DNA strands varied. For example, molecules 4 and 5 have an acute angle between DNA arms, whereas the similar angle for molecules 2 and 6 is obtuse suggesting that the DNA strands can be oriented differently within the complex. DNA segments adjacent to the protein of 10 nm long (these are normally almost straight sections of DNA filament) were used for angle measurements (see schematics in Fig. 2d). The data for the angles inside and outside the loops separately are shown in Figure 2e and f respectively. Both data sets show a bimodal angle distribution with mean values in sub-populations of 59 ± 2 and 117 ± 2 degrees for the angles inside the loop and 58 ± 2 and 117 ± 2 degrees for angles between DNA arms outside the loop. The number of molecules with acute and obtuse values of the angle for the inside and outside of the loop measurements and are quite similar (49% and 48% for acute angle vs. 51% and 52% for obtuse angle).
Similar analysis was performed for fragment “P” with a 200 bp distance between the recognition sites. The values of the angles within the loop and between the arms are 64° ± 2° (57%) and 116° ± 1° (43%) for the intraloop and 65° ± 3° (44%) and 125° ± 5° (56%) for the interarms measurements. These values are very close to the data obtained for the larger loop design including the population of each conformational state. The data for angle measurements with cis type of the complex are summarized in Table 1. These data suggest that two distinct relative orientations for DNA strands within the SfiI tetramer are possible. Importantly, the orientations with an acute angle (ca. 60°) and an obtuse angle (ca. 120°) between DNA strands are relatively equally represented.
Table 1.
The data for angles between DNA strands in cis type of SfiI-DNA complex. Relative occurrences of conformations with acute or obtuse angle between specific DNA strands for each construct are shown in parentheses.
| Complex Type | Angle Between Arms | Angle Inside Loop | Number of complexes analyzed |
|---|---|---|---|
| O, cis | 59 ± 2 (49%)
117 ± 2 (51%) |
58 ± 2 (48%)
117 ± 2 (52%) |
N=259 |
| P, cis | 65 ± 3 (44%)
125 ± 4 (56%) |
64 ± 2 (57%)
116 ± 1 (43%) |
N=61 |
3. AFM analysis of trans SfiI-DNA complexes
In addition to cis complexes we analyzed the geometry of DNA within trans complexes which are formed by two DNA fragments with one recognition region per fragment. The image of SfiI complexes formed by fragment M is shown in Figure 3a. Trans type complexes of SfiI with 2 DNA molecules are found in 99% cases. The SfiI-DNA complexes containing only one DNA template were very rare structures (less then 1%). The complexes have a symmetric structure with a protein bound to the specific position of about one third of the total length of DNA fragment. Similar to observations for cis-type of complexes, we found that the angles between short and long arms varied. Two molecules in the image (Fig. 3a) have acute angles whereas two other have obtuse angles between similar DNA strands. The results of the angle measurements for short and long arms are shown as histograms in Figs. 3b and 3c respectively. Similar to the cis-type of SfiI-DNA complexes clear bimodal distribution centering around ~60° and ~120° is obtained. The population of molecules with acute and obtuse angles is almost equal. They are 47 and 53% for the angle between short DNA arms and 45 and 55% for the angle between long arms respectively.
Figure 3.
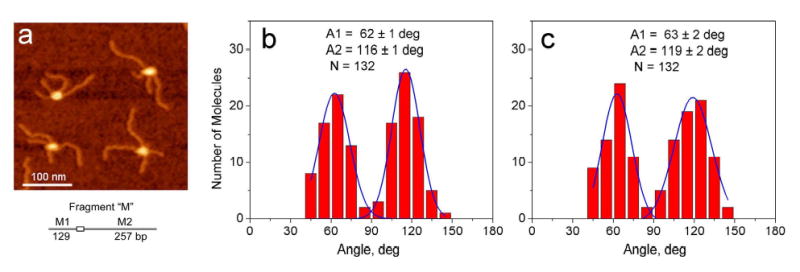
SfiI complex with fragment “M”. AFM image (a) and histograms for the angle between short arms (b) and long arms (c). The scheme of the DNA fragment is shown under the image.
4. Model of the synaptic complex
Although the data obtained indicate clearly the existence of two types of SfiI-DNA synaptic complexes, they cannot distinguish between two different models for the DNA path in the complex. In one model for cis complex, shown schematically in Fig. 4a left, DNA is severely bent, whereas an alternative model (Fig. 4a center), in which the strands cross each other, does not require such a bend. The same ambiguity arises for MM trans type complex as shown in Figure 4b. The path inside the synaptic complex of DNA strands for identical molecules (indicated as M and m) cannot be restored unambiguously by AFM. Indeed, similar to the schematics for cis complex, the left model in Figure 4b corresponds to the arrangement of uncrossed DNA strands with M1-m1-m2-M2 pattern of the arms arrangement (clockwise) and the arrangement M1-m1-M2-m2 (Fig. 4b center) corresponds to the model with crossed strands. Note that the sections of DNA strands beyond the protein contour (shown as a circle) are identical, and AFM images such as shown to the right cannot distinguish between these two models.
Figure 4.
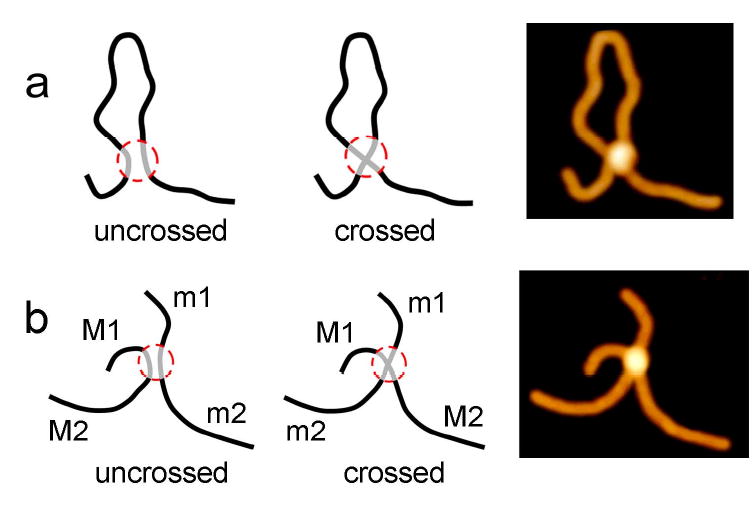
Models of the possible arrangement of DNA strands in the synaptic complex SfiI-DNA. (a) The models for cis type complex with uncrossed (left) and crossed (center) orientation of the strands. (b) Schemes for the arrangement of two M fragments within a synaptic complex for uncrossed (left) and crossed DNA strands (center).
To resolve this problem and select between the two models, we analyzed synaptic complexes formed by two fragments with significantly different lengths (386 bp, fragment M, and 491 bp, fragment L, see Fig. 5a). However, the use of two different DNA substrates should lead to the mixture of synaptic homocomplex (MM and LL) and a heterocomplex ML. We used contour length measurements to distinguish between homocomplexes MM and LL and the heterocomplex ML. Images of the selected heterocomplexes are shown in Fig. 5b. Similar to the data described in the previous sections, these images reveal two classes of protein-DNA complexes - the complexes with an obtuse angle between short DNA arms (L1 and M1) (upper row) and molecules with acute angle between short arms (bottom row). The statistics for the angle measurements between the short and long arms in the heterodimer ML are shown in Figs. 5c,d. Similar to the cis complex, the distribution is bimodal with the mean values 63 ± 2 and 115 ± 1 degrees for the angle between the shorts arms and 58 ± 2 and 119 ± 2 degrees for the angle between the long arms (N=105). The population of the molecules with acute and obtuse angles is approximately equal. This observation is also is fully consistent with the results shown above. The angle measurements were performed for a homocomplexes LL and MM as well. A complete set of data for the angle measurements in all trans complexes is given in Table 2. In summary, these measurements are consistent with the bimodal distribution for the interarm angles and relatively equal distribution of both types of complexes.
Figure 5.
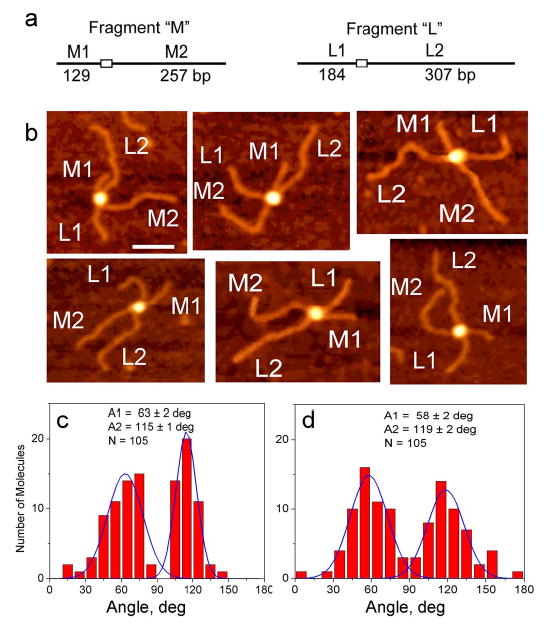
(a) The scheme of DNA fragments. (b) Selected AFM images of ML type complex assembled by SfiI with two different DNA fragments (M and L). The arms M1, M2 and L1, L2 are assigned according to their length measurements. (c) and (d) show the histograms for the angle between short arms M1-L1 and long arms M2-L2 respectively.
Table 2.
The data for angles between DNA strands in trans type of SfiI-DNA complex. Relative occurrences of conformations with acute or obtuse angle for each construct are shown in parentheses.
| Complex Type | Angle Between Short Arms | Angle Between Long Arms | Number of molecules analyzed |
|---|---|---|---|
| MM, trans | 62 ± 1 (47%)
116 ± 1 (53%) |
63 ± 2 (45%)
119 ± 2 (55%) |
N=132 |
| LL, trans | 64 ± 1 (67%)
130 ± 1 (33%) |
61 ± 3 (56%)
127 ± 3 (44%) |
N=83 |
| ML, trans | 63 ± 2 (54%)
115 ± 1 (46%) |
58 ± 2 (53%)
119 ± 2 (47%) |
N=105 |
Importantly, the data for DNA fragments with different lengths and different position of the recognition site in trans (ML heterocomplex) allows us to distinguish between the two models. Indeed, each arm for heterodimers ML was identified by the length measurements. The images in Figure 5b show molecules with unambiguous alternating order of the arms of different lengths (mixed orientation), e.g., M1-L2-M2-L1 for molecule 1 and M1-L1-M2-L2 for molecule 3 in upper row. These data support the model with crossed orientation of the DNA strands within the SfiI-DNA complex (Fig. 4b, middle).
We found that 80% of all ML type complexes have this alternating pattern of the strands orientation. Another 20% of molecules represent equally two types of complexes - M1-M2-L1-L2 or M1-M2-L2-L1 that can be assigned to the uncrossed model in Fig. 4b. We suggest a possible explanation for the appearance of two types of the AFM images of the heterocomplexes and for the finding that the complex with a crossed orientation of the strands prevails over an alternative orientation. We should take into consideration a three-dimensionality of the synaptic complex formed by a large protein tetramer and consider different projections of the complex on a plane that are good approximations for flat AFM images. Let us, for simplicity, approximate the protein as a cylinder with DNA bound to the top and the bottom sides of the cylinder (Figure 6). The DNA strands, according to our data are crossed at a 60 angle; therefore, we arrange the DNA strands on the top and the bottom planes of the cylinder according to the crossed model and consider two relative orientations of the DNA strands, M1-L1-M2-L2 and M1-L2-M2-L1 (Fig. 6, top). If this complex approaches the surface with any of its cylinder sides, we will obtain the projections with the alternating orientation of the arms, i.e., M1-L1-M2-L2 and M1-L2-M2-L1. However, if we consider a projection in which the sides of the cylinder are perpendicular to the plane (90° rotation, Fig. 6, bottom), the DNA duplexes will be parallel and the arms can adopt the orientation L1-M1-M2-L2 or L1-M2-M1-L2 when the molecule flattens on the plane. Given a relatively high rigidity of the DNA helix, these projections will be less favorable. This prediction is consistent with our results supporting the model with crossed orientation of the duplex for the SfiI-DNA complex. We cannot exclude the possibility that the DNA strands within the complex are distorted in such a way that they are not straight. This distortion will lead to additional non-plane geometry of the complex that in turn may facilitate the formation of projections of the arms such as L1-M2-M1-L2.
Figure 6.
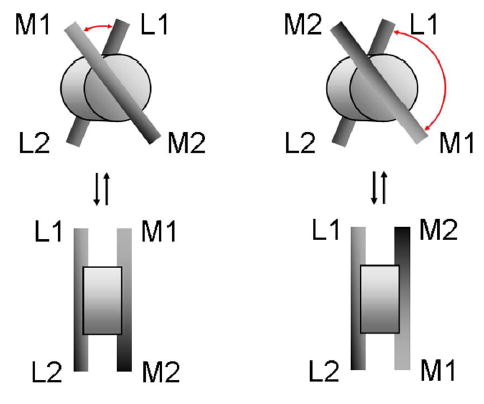
3D models for SfiI-DNA complexes with DNA fragments M and L. The protein is shown as a thick disk with DNA bound to the both sides of the disk. Upper row: an acute angle between short arms L1-M1 is shown on the left in which the DNA “binding” planes are parallel to the surface plane. The same orientation of the complex relative to the plane, but flipping the orientation of the fragment M (top right) shows obtuse angle between arms L1-M1. The bottom row shows the orientation of the top complexes in a way that cylinder’s planes (the DNA “binding” planes) are perpendicular to the surface plane.
What is the reason for the bimodal distribution of the angle between the arms? Is this due to the existence of two different conformations of the SfiI tetramer? We found that the bimodal character of the angle distribution is a general property of the complex regardless of the type of the complex (cis or trans) and the sequence in the center of the recognition region. Therefore, this observation can be explained assuming a symmetric pattern for DNA arrangement within the complex. The assumption on the symmetry of DNA binding to the protein recognition sites is based on the finding that the central part of the entire DNA binding region (5’-GGCCNNNNNGGCC-3’) is not essential for binding specificity as protein very likely has no contacts with the bases inside the spacer (18). If two recognition slots on the protein surfaces crossed at the fixed angle 60°, a simple change in the relative orientation of the DNA strands will change the interarm angle from 60° to 120° (Fig. 6, upper schemes). Therefore, the change of the strands orientation will lead to a bimodal angle distribution as observed in experiments. The protein recognition sequence for SfiI has the dyad symmetry only at the flanks; therefore our data suggest that the middle part of the DNA binding region (at least for sequences studied in this work) is not essential for the recognition, and very likely plays the role of a spacer required to keep the flanks GGCC/CCGG at a specific distance.
An interesting prediction from the proposed model for the SfiI-DNA complex can be drawn for the cis type of the synaptic complex. The flip between 60° and 120° orientations can also change the shape of DNA loop in cases when the loop size is relatively small and comparable with DNA persistence length. In the case of the acute orientation of the strands, the loop is elongated along one axis. In the alternative orientation with the obtuse angle, the loop is deformed along a perpendicular axis making it wider. The difference in loop shape can affect the mobility of the complex in the gel. Indeed, two types of looped DNA SfiI complexes differed by the gel mobility were observed (8). However, we cannot exclude a change of DNA topology can also contribute to the gel mobility of the two conformers as discussed in paper (8).
Given a homotetramer composition of the SfiI within the functional complex with DNA, the finding that the DNA helices are arranged at the angle 60° rather of being orthogonal is seemingly counter-intuitive. Indeed, the orthogonal orientation of DNA helices was assumed in a number of works (8). However, crystallographic data are available for three restriction enzymes of type IIf family, Bse6341 (3), CfrI (5) and NgoMIV (4). The orientations of the monomer units within the tetramer are far from being orthogonal, suggesting that DNA strands can be arranged in a non-orthogonal orientation as well. Moreover, recent paper by Deibert et al. (4) shows that inside NgoMIV complex DNA strands bind to two distant protein binding clefts located at the protein surface with a relative orientation of the helices ca. 60°. The coincidence of the orientation pattern for this protein and SfiI is remarkable. Although both proteins operate as tetramers, the recognition site for NgoMIV 5’-GCCGGC-3’ is much shorter than that of SfiI. Moreover, unlike NgoMIV that binds to a continuous hexameric site, the recognition site for SfiI contains a 5 bp spacer, the sequence of which is not essential for the recognition, suggesting loose contacts, if any, between the protein moieties and the DNA bases in the middle part of the DNA cognate site. Additional structural studies of these proteins are needed to elucidate the mechanisms of their actions, their mechanistic similarities and differences.
Acknowledgments
The authors thank M. Karymov, L. Shlyakhtenko, and O Sankey for stimulating discussion of the data and the critical comments.
Footnotes
This research was supported by Grant GM 062235 (YLL) from the National Institute of Health.
Abbreviations: AFM, Atomic Force Microscopy; APS, 1-(3-aminopropyl)silatrane.
References
- 1.Embleton ML, Siksnys V, Halford SE. DNA cleavage reactions by type II restriction enzymes that require two copies of their recognition sites. J Mol Biol. 2001;311:503–514. doi: 10.1006/jmbi.2001.4892. [DOI] [PubMed] [Google Scholar]
- 2.Embleton ML, Vologodskii AV, Halford SE. Dynamics of DNA loop capture by the SfiI restriction endonuclease on supercoiled and relaxed DNA. J Mol Biol. 2004;339:53–66. doi: 10.1016/j.jmb.2004.03.046. [DOI] [PubMed] [Google Scholar]
- 3.Grazulis S, Deibert M, Rimseliene R, Skirgaila R, Sasnauskas G, Lagunavicius A, Repin V, Urbanke C, Huber R, Siksnys V. Crystal structure of the Bse634I restriction endonuclease: comparison of two enzymes recognizing the same DNA sequence. Nucleic Acids Res. 2002;30:876–885. doi: 10.1093/nar/30.4.876. [DOI] [PMC free article] [PubMed] [Google Scholar]
- 4.Deibert M, Grazulis S, Sasnauskas G, Siksnys V, Huber R. Structure of the tetrameric restriction endonuclease NgoMIV in complex with cleaved DNA. Nat Struct Biol. 2000;7:792–799. doi: 10.1038/79032. [DOI] [PubMed] [Google Scholar]
- 5.Siksnys V, Skirgaila R, Sasnauskas G, Urbanke C, Cherny D, Grazulis S, Huber R. The Cfr10I restriction enzyme is functional as a tetramer. J Mol Biol. 1999;291:1105–1118. doi: 10.1006/jmbi.1999.2977. [DOI] [PubMed] [Google Scholar]
- 6.Wentzell LM, Nobbs TJ, Halford SE. The SfiI restriction endonuclease makes a four-strand DNA break at two copies of its recognition sequence. J Mol Biol. 1995;248:581–595. doi: 10.1006/jmbi.1995.0244. [DOI] [PubMed] [Google Scholar]
- 7.Wentzell LM, Halford SE. DNA looping by the Sfi I restriction endonuclease. J Mol Biol. 1998;281:433–444. doi: 10.1006/jmbi.1998.1967. [DOI] [PubMed] [Google Scholar]
- 8.Watson MA, Gowers DM, Halford SE. Alternative geometries of DNA looping: an analysis using the SfiI endonuclease. J Mol Biol. 2000;298:461–475. doi: 10.1006/jmbi.2000.3676. [DOI] [PubMed] [Google Scholar]
- 9.Van Komen S, Petukhova G, Sigurdsson S, Sung P. Functional cross-talk among Rad51, Rad54, and replication protein A in heteroduplex DNA joint formation. J Biol Chem. 2002;277:43578–43587. doi: 10.1074/jbc.M205864200. [DOI] [PubMed] [Google Scholar]
- 10.Shlyakhtenko LS, Gall AA, Filonov A, Cerovac Z, Lushnikov A, Lyubchenko YL. Silatrane-based surface chemistry for immobilization of DNA, protein-DNA complexes and other biological materials. Ultramicroscopy. 2003;97:279–287. doi: 10.1016/S0304-3991(03)00053-6. [DOI] [PubMed] [Google Scholar]
- 11.Ratcliff GC, Erie DA. A novel single-molecule study to determine protein--protein association constants. J Am Chem Soc. 2001;123:5632–5635. doi: 10.1021/ja005750n. [DOI] [PubMed] [Google Scholar]
- 12.Henderson RM, Schneider S, Li Q, Hornby D, White SJ, Oberleithner H. Imaging ROMK1 inwardly rectifying ATP-sensitive K+ channel protein using atomic force microscopy. Proc Natl Acad Sci U S A. 1996;93:8756–8760. doi: 10.1073/pnas.93.16.8756. [DOI] [PMC free article] [PubMed] [Google Scholar]
- 13.Lushnikov AY, Brown BA, 2nd, Oussatcheva EA, Potaman VN, Sinden RR, Lyubchenko YL. Interaction of the Zalpha domain of human ADAR1 with a negatively supercoiled plasmid visualized by atomic force microscopy. Nucleic Acids Res. 2004;32:4704–4712. doi: 10.1093/nar/gkh810. [DOI] [PMC free article] [PubMed] [Google Scholar]
- 14.Potaman VN, Lushnikov AY, Sinden RR, Lyubchenko YL. Site-specific labeling of supercoiled DNA at the A+T rich sequences. Biochemistry. 2002;41:13198–13206. doi: 10.1021/bi026402w. [DOI] [PubMed] [Google Scholar]
- 15.Pavlicek JW, Oussatcheva EA, Sinden RR, Potaman VN, Sankey OF, Lyubchenko YL. Supercoiling-induced DNA bending. Biochemistry. 2004;43:10664–10668. doi: 10.1021/bi0362572. [DOI] [PubMed] [Google Scholar]
- 16.Milsom SE, Halford SE, Embleton ML, Szczelkun MD. Analysis of DNA looping interactions by type II restriction enzymes that require two copies of their recognition sites. J Mol Biol. 2001;311:515–527. doi: 10.1006/jmbi.2001.4893. [DOI] [PubMed] [Google Scholar]
- 17.Nobbs TJ, Szczelkun MD, Wentzell LM, Halford SE. DNA excision by the Sfi I restriction endonuclease. J Mol Biol. 1998;281:419–432. doi: 10.1006/jmbi.1998.1966. [DOI] [PubMed] [Google Scholar]
- 18.Williams SA, Halford SE. SfiI endonuclease activity is strongly influenced by the non-specific sequence in the middle of its recognition site. Nucleic Acids Res. 2001;29:1476–1483. doi: 10.1093/nar/29.7.1476. [DOI] [PMC free article] [PubMed] [Google Scholar]