

Abstract
Real-time polymerase chain reaction (PCR) constitutes a significant improvement over traditional end-point PCR, as it allows the quantification of starting amounts of nucleic acid templates, in real-time. However, quantification requires validation through numerous internal controls and standard curves. We describe in this paper a simple protocol which uses real-time PCR to compare mRNA levels of a gene of interest between different experimental conditions. Comparative real-time PCR can be a relatively low-cost method and does not require sequence-specific fluorescent reporters. Moreover, several genes from a set of experiments can be assessed in a single run. Thus, in addition to providing a comparative profile for the expression of a gene of interest, this method can also provide information regarding the relative abundance of different mRNA species.
Keywords: Polymerase Chain Reaction; Leukocytes; Gene Expression; RNA, Messenger
Introduction
Real–time PCR allows quantification of starting amounts of nucleic acid templates; it is based on the detection of a fluorescent reporter molecule that increases as PCR product accumulates at each cycle of amplification, as it happens (1). Prior to the development this technology, separation and quantification of the PCR products had to be performed by gel electrophoresis or HPLC following the PCR itself. In addition, quantitative measurements required setting up multiple PCR reactions in order to capture products in the linear phase of amplification. These experiments are quite laborious, time-consuming and the number of manipulations required to achieve proper quantification increased the likelihood of introducing error. Real-time PCR has revolutionized our ability to measure DNA or RNA concentrations and exceeds the limitations of traditional end-point PCR methods by allowing rapid and efficient quantification of PCR product during each amplification cycle. A variety of applications have emerged as a result including, validation of gene expression data obtained by microarray analysis, measurement of DNA copy number, detection and quantification of viral particles and potentially lethal microorganisms, mutation analysis, and measurement of residual disease in cancer patients.
Real-time PCR products may be quantitated by generating a standard curve, or quantitated relatively to a control gene. Typically, the quantification is based on a standard curve derived from plasmid DNA or other forms of DNA in which the absolute concentration of each standard is known. One must be sure, however, that the efficiency of PCR is the same for the standards as that of the samples of interest; performing PCR from purified targets can in some cases be more efficient than that observed with complex nucleic acid mixtures. The relative quantification method is more straightforward as it simply requires the measurement of housekeeper- or control-genes, in order to normalize expression of the target gene. However, the selection of appropriate control genes can cause problems as they may not necessarily be equally expressed across all unknown samples.
In many instances, the intent may be to compare the mRNA levels of a gene between different experimental conditions. Real-time PCR can be used to such a comparative end in a rapid and efficient manner without the need for building internal standard curves or utilization of numerous control genes. Comparative real-time PCR can be a relatively low-cost approach as there is no need for sequence-specific fluorescent reporters. Moreover, several genes can be assessed at once, allowing the comprehensive study of a set of genes in a short period of time. In addition to providing a comparative profile for the expression of a gene, the method can also provide valuable information regarding of the relative abundance of expressed mRNA levels between different genes. We describe in this article the use of real-time PCR for the comparison of mRNA levels of genes obtained from resting- or LPS-activated human leukocytes. Each aspect is described in detail, complemented with examples and figures, and important technical issues are addressed. Finally, a set of results is presented as a typical example of comparative real-time PCR usage; the potential and limitations for this approach are addressed.
Materials and Methods
Human leukocyte isolation
Polymorphonuclear leukocytes (PMNs) were isolated as originally described (2) with modifications (3). Briefly, venous blood from healthy volunteers, collected on isocitrate anticoagulant solution was centrifuged (250 x g, 10 min), and the resulting platelet-rich plasma was discarded. Leukocytes were obtained following erythrocyte sedimentation in 2% Dextran T-500 (Amersham Biosciences, Piscataway, NY, USA). PMNs were then separated from other leukocytes by centrifugation on a cushion of 10 ml lymphocyte separation medium (Wisent, St-Bruno, Québec, Canada). Contaminating erythrocytes were removed by a 15 sec hypotonic lysis, and purified granulocytes (> 95% PMNs, < 5% eosinophils) contained fewer than 0.2% monocytes, as determined by esterase staining. Viability was greater than 98%, as determined by trypan blue dye exclusion. The whole cell isolation procedure was carried out at room temperature under sterile conditions.
Cell incubations
PMNs were resuspended in 1.5 ml Eppendorf tubes at a concentration of 25 x 106 cells/ml in Hank's balanced salt solution (HBSS; 37°C) containing 1% fetal bovine serum, 10 mM HEPES pH 7.4, 1,6 mM Ca2+ and no Mg2+. Where mentioned, cell suspensions were stimulated with 0.1 37μg/ml LPS (from E. coli 0111:B4, Sigma Aldrich, St-Louis, MO) for 60 min.
RNA isolation
PMN total RNA was isolated using Trizol (Invitrogen Life technology, Carlsbad, CA, USA) according to the manufacturer's protocol, with modifications (3). Briefly, 25 x 106 PMNs were homogenized in 1 ml Trizol and 200 µl of chloroform were added. After mixing, samples were centrifuged at 12 000 x g for 15 min (4°C). The upper aqueous phase was transferred in a tube containing an equal volume of isopropanol. Mixtures were thoroughly vortexed and centrifuged at 12 000 x g for 10 min (4°C). Supernatants were discarded and the precipitated RNA pellets were washed twice using 1 ml of 75% ethanol. RNA pellets were centrifuged at 12 000 x g for 5 min (RT). After discarding supernatants, pellets were allowed to air-dry for 10-15 min, then resuspended in DEPC-treated water. RNA was quantitated by UV absorbance at 260 nm.
Real-time PCR: technical aspects
Real-time PCR protocols often relate to that of standard PCR reactions. The same issues apply with respect to designing primers, optimizing reaction conditions and producing clean templates. The major difference is the incorporation of a fluorescent reporter for the detection of PCR product. Primers sets may be designed using standard primer design algorithms. As with all PCR amplifications, the specific reaction conditions for each set must be optimized, particularly primer concentration, annealing temperature, magnesium chloride and fluorescent reporter concentration. Fluorescent reporters include sequence–specific probes (i.e. molecular beacons or TaqMan® Probes), or dyes that bind double-stranded DNA (i.e. SYBR® Green). The latter is currently the most popular reporter used with real-time PCR, due to its low cost, ease of use and reliability. SYBR® Green has excitation and emission maxima of 494 nm and 521 nm.
Design of primers for use with real-time PCR
Primers were designed using the software Primer 3 (developed by Steve Rozen and Helen J. Skaletsky) available on-line at http://frodo.wi.mit.edu/. As much as possible, primers were all designed to have similar properties so that PCRs for different genes could be performed in a same run. Primers were selected according to the following parameters: length between 18 and 24 bases (optimal 20-22 bases); melting temperature (Tm) comprised between 57° and 60°C (optimal Tm 58°C); G+C content between 40 and 60% (optimal 50%). Amplicons of 90-300 bp were preferred, as PCR efficiency decreases with very long (> 1000 bp) amplicons. Moreover, amplicons which span over two or more exons were selected, whenever possible, in order to distinguish between amplification of mature mRNA from that of genomic DNA. All of the selected sequences were further analyzed with the programs Amplify (http://engels.genetics.wisc.edu/amplify/) and Oligo 6 Primer analysis software (http://www.cambio.co.uk/index.php), for additional characteristics: recognition of the primers for the gene of interest; probability of primers forming dimers, and/or hairpins. Finally, all sequences were submitted to the Blast software, available on the National Center for Biotechnology Information website (www.ncbi.nlm.nih.gov), in order to assess gene specificity. Following their design, primers were obtained from our in-house facility, using a ABI-3900 DNA synthesizer. A selection of tested primers and successfully used in real-time PCR are presented in Table 1.
Table 1.
Primer sequences for mRNA analysis by real-time PCR. Sequences designed for the detection of indicated gene products by real-time PCR are presented.
| Gene | Primers (human) | Amplicon | Tm |
| GADPH | S: 5'-CGAGATCCCTCCAAAATCAA-3'; | 170 | 60 |
| AS: 5'-TTCACACCCATGACGAACAT-3’ | 60 | ||
| COX-2 | S: 5'-TGCATTCTTTGCCCAGCACT-3'; | 146 | 59 |
| AS: 5'-AAAGGCGCAGTTTACGCTGT-3' | 59 | ||
| IL-1β | S: 5'-GGACAAGCTGAGGAAGATGC-3'; | 120 | 60 |
| AS: 5'-TCGTTATCCCATGTGTCGAA-3' | 60 | ||
| IL-1RA | S: 5'-GCGAGAACAGAAAGCAGGAC-3'; | 154 | 60 |
| AS: 5'-CCTTCGTCAGGCATATTGGT-3' | 60 | ||
| IL-6 | S: 5'-CACAGACAGCCACTCACCTC-3'; | 167 | 59 |
| AS: 5'-TTTTCTGCCAGTGCCTCTTT-3' | 60 | ||
| IL-8/CXCL8 | S: 5'-GTGCAGTTTTGCCAAGGAGT-3'; | 196 | 60 |
| AS: 5'-CTCTGCACCCAGTTTTCCTT-3' | 59 | ||
| TNF-α | S: 5'-AGCCCATGTTGTAGCAAACC-3'; | 134 | 60 |
| AS: 5'-TGAGGTACAGGCCCTCTGAT-3' | 60 | ||
| MIP-1α/CCL3 | S: 5'-CTCTGCAACCAGGTCCTCTC-3'; | 204 | 60 |
| AS: 5'-TTTCTGGACCCACTCCTCAC-3' | 60 | ||
| MIP-1β/CCL4 | S: 5'-AAGCTCTGCGTGACTGTCCT-3'; | 211 | 60 |
| AS: 5'-GCTTGCTTCTTTTGGTTTGG-3' | 60 | ||
| MIP-2α/CXCL2 | S: 5'-TGCAGGGAATTCACCTCAAG-3'; | 114 | 56 |
| AS: 5'-TGAGACAAGCTTTCTGCCCA-3' | 58 | ||
| MIP-3β/CCL19 | S: 5'-GGTGCCTGCTGTAGTGTTCA-3'; | 116 | 60 |
| AS: 5'-GCTTCATCTTGGCTGAGGTC-3' | 60 | ||
| MIP-3α/CCL20 | S: 5'-GCAAGCAACTTTGACTGCTG-3'; | 150 | 60 |
| AS: 5'-ATTTGCGCACACAGACAACT-3' | 59 | ||
| MCP-1/CCL2 | S: 5'-AGCAGCAAGTGTCCCAAAGA-3' | 120 | 59 |
| AS: 5'-TTGGGTTTGCTTGTCCAGGT-3' | 58 |
Determination of optimal annealing temperature by gradient PCR
While theoretical annealing temperatures are determined in the process of primer design, as described above, gradient PCR was used to determine actual optimal annealing temperatures and primers specificity, and to assess for the possible presence of genomic DNA in the samples. To this end, a PTC-200 apparatus equipped with a gradient-capable head (MJ Research, Watertown, MA, USA) was used. Each sample consisted of: 50 ng cDNA, 3.0 mM MgCl2, 200 μM dNTP (Roche, Nonnenwald, Germany), 500 nM of primers, 2 μl 10X PCR buffer (10X PCR buffer is: 100 mM Tris-Hcl pH 8.5, 500 mM KCl, 1.5% Triton X-100), and 0.1 unit of Taq polymerase (Amersham Biosciences), in a total reaction volume of 20 μl (4). This mixture was used in order to mimic as much as possible the real-time PCR conditions. Amplification conditions included an initial step at 95°C (3 min), followed by 25 repetitions of the following cycle: 95°C (30 sec) gradient temperatures between 56° to 62°C (30 sec), 72°C (20 sec), then concluded by a step at 72°C for 5 min. Amplicons were migrated and visualized on 2% agarose gels in order to confirm optimal melting temperature as determined by the brightest band.
Reverse-transcription and real-time PCR
First strand cDNA synthesis was performed using 1 μg of total RNA with Superscript II (Invitrogen Lifetechnology, Carlsbad, CA, USA) in recommended conditions, using 500 ng of random hexamers (Roche, Nonnenwald, Germany).
Amplification of PMN cDNA was carried out in a Rotor-Gene 3000 (Fig. 1) operated with Rotor Gene software version 6.0.19 (Corbett Research, Mortlake, 2137 NSW, Australia; (www.corbettlifescience.com). Each sample consisted of: 50 ng cDNA, 3 mM MgCl2, 200 μM dNTP, 500 nM of primers, 2 μl of 10X PCR buffer, 0.1 unit of Taq polymerase and SYBR® Green (Molecular Probe, Eugene, OR; 1/30 000 dilution), in a reaction volume of 20 μl. Amplification conditions were as follows: 95°C (15 sec), 58°C (20 sec), 72°C (25 sec); 35 repetitions (Fig. 2).
Fig. 1. The Rotor-Gene 3000 apparatus.

Fig. 2. Illustration of a typical run using the Rotor-gene Analysis Software.

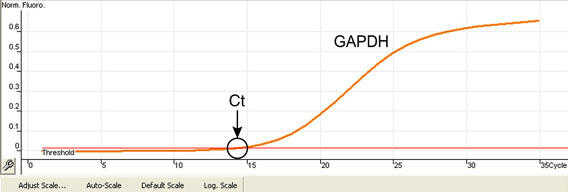
Typically, PCR product is produced exponentially. Because it takes several cycles for enough product to be readily detectable, the plot of fluorescence vs. cycle number has a sigmoidal appearance. Eventually, as the reaction substrates become depleted, amplification rate diminishes and the curve flattens.
Results of a typical real-time PCR are shown in Figure 3 (usually, each reaction is run in duplicates. The average is then used to calculate the Ct-value of each particular sample. For simplicity, results from single samples are shown). The point on the curve in which the amount of fluorescence rises above background signal, usually a few standard deviations above the baseline, is termed the threshold cycle (Ct) value. The Ct point is chosen because it is the moment when the determination can be made with most accuracy. The fewer cycles necessary to produce a detectable fluorescence (smaller Ct value), the greater the number of target sequences. Useful hints about Ct determination are available from real-time PCR manufacturers.
Fig. 3. Typical real-time PCR result.
The Melt® Procedure
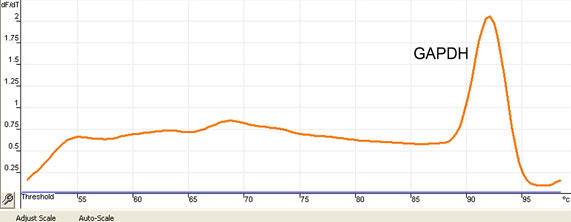
Specificity of each reaction should be ascertained after completion of the amplification protocol. With the Rotor Gene, this is achieved by performing the Melt® procedure (58-99°C; 1°C/5 sec). When most of the fluorescent signal originates from the product of interest during the amplification procedure, a single melting peak is obtained, as illustrated in Figure 4.
Fig. 4. Example of a Melt® result confirming specificity of the results.
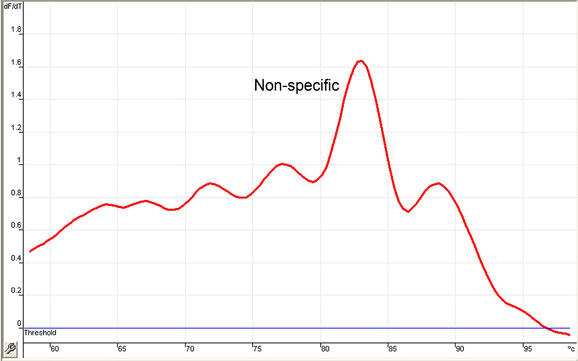
In contrast, should there be amplification of secondary products, of primer dimers or of non-specific amplicons, several melting peaks are generated at temperatures lower than the melting point expected for the product of interest (Fig. 5), precluding any quantitative assessment. In addition to the Melt® procedure, migrating the PCR products on an agarose gel can also help in determining specificity of the amplification procedure.
Fig. 5. Example of a Melt® result showing non-specific amplification.
Precautionary measures
Several measures can be considered in order to prevent sample contamination. Distinct laboratory areas should be reserved for each step: RNA extraction, preparation of PCR reactions, and amplification procedure. The use of a UV-resistant Plexiglas hood equipped with UV lamp, similar to that shown in Figure 6, is recommended when preparing PCR reactions.
Fig. 6. UV-equipped Plexiglas hood is used in order to prevent sample contamination.
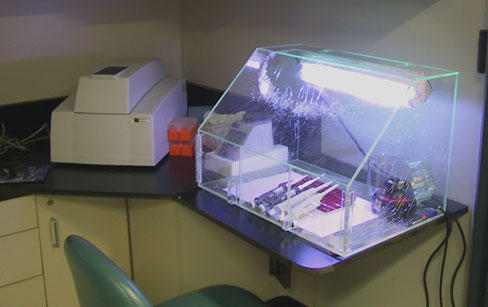
The UV lamp, which is used to destroy any DNA material that might be present within the working area, should be turned on for at least 15 min, whenever the hood is not in use. Aerosol-resistant tips should be used to handle all reagents.
In addition, control real-time PCRs must regularly be performed on samples previously prepared in the absence of reverse-transcriptase, in order to ensure that cDNAs are not contaminated with genomic DNA. When following these precautionary measures, contamination issues can be kept to a minimum; should genomic DNA be still a problem, users are advised to use RNA purification protocols which include a DNA digestion step. In some specialized applications, removal of PCR product is needed for the prevention of carry-over contamination. In this situation, dUTP can be incorporated into the PCR product and, before the subsequent amplification round, initial PCR products can be degraded by use of Uracil-DNA Glycosylase. The enzyme removes uracil residues from the sugar moiety of single- and double-stranded DNA without destroying the phosphodiester backbone, preventing its use as a hybridization target or as a template for DNA polymerases. The enzyme can be inactivated at the beginning of the amplification reaction by heating to 95°C.
Reaction optimizations
MgCl2
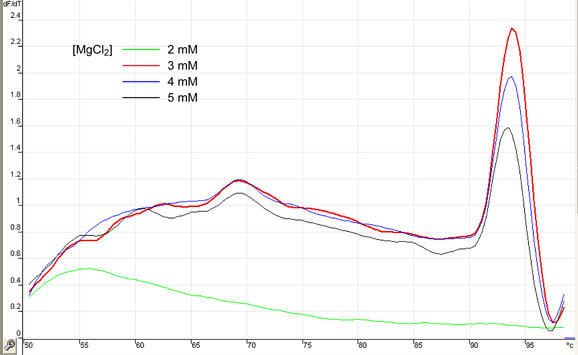
Real-time PCR may require higher MgCl2 concentrations than classic PCR, a fact which may be related to the presence of a fluorescent reporter in the mixture. In turn, this parameter should be optimized. With all other reagents remaining equal, a range of MgCl2 concentrations were used in order to determine suitable MgCl2 concentrations. In the context of the apparatus and reaction mixture composition used in this example, MgCl2 present at a concentration of 3 mM gives optimal results both in terms of amplification and Melt® signals, as can be appreciated in Figures 7 and 8. Again, this parameter should be optimized for every different technology and mixture composition.
Fig. 7. Optimization of MgCl2 concentration in samples.
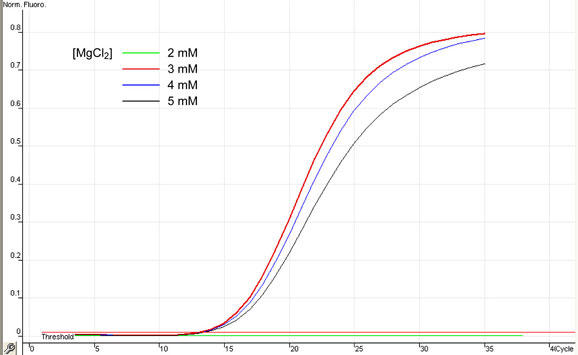
Fig. 8. MgCl2: Melt® results.
SYBR® Green
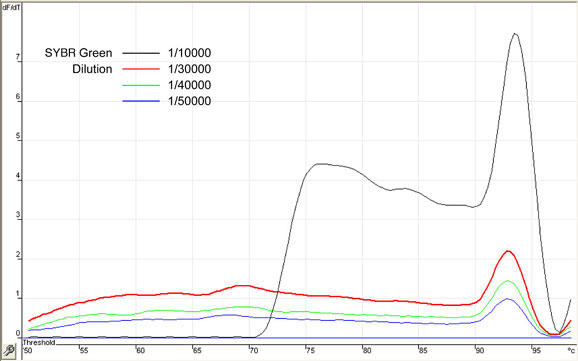
The concentration of fluorescent reporters, sequence–specific probes or dyes that bind double-stranded DNA such as SYBR® Green, need also to be optimized. In the present case, SYBR® Green was provided as a '10 000x' stock solution. A range of dilutions (1/10 000 to 1/50 000) were assayed in order to determine the concentration which yields the best signal-to-noise ratio. Figure 9 shows increasing fluorescence signal obtained with increasing SYBR® Green concentrations. On the other hand, Figure 10 shows that increasing concentration of the dye eventually generate high background signal, indicative of excessive presence of the dye. From these experiments, a 1/30 000 SYBR® Green dilution was selected.
Fig. 9. Optimization of SYBR® Green concentration in samples.

Fig. 10. SYBR® Green: Melt® results.
Linearity
In order to determine the amount of cDNA required for a PCR reaction, experiments were performed with each gene of interest, using serial dilutions of a cDNA preparation with all other conditions being identical. These experiments give valuable information about the range of template concentrations that yields similar amplification efficiency. As illustrated by the two genes (GAPDH, COX-2) presented in Figures 11 and 12, efficiency of PCR reactions remained essentially linear over a range of cDNA concentrations spanning more than 2 log orders.
Fig. 11. Linearity and efficiency test: GAPDH.

Fig. 12. Linearity and efficiency test: COX-2.

In these experiments, linearity was in the order of r2=0.99. These results indicate that differentially expressed mRNA species can be analyzed within the same PCR run, as long as the template concentrations fall within the linear range.
Efficacy
In principle, amplicons double at each cycle. The actual production, however, depends of the efficacy of each amplification cycle. It is possible to determine the efficiency for each reaction, by calculating the slopes of the standard curves generated in Figures 11 and 12, by using the equations (5):
Exponential Amplification:

or, Reaction Efficiency:

Optimal values for slope and efficiency are -3.322 and 1, respectively. These calculations are usually automatically determined by the software and provided with the results. In our example, GAPDH's reaction efficiency was 0.88 (Fig. 11) and that of COX-2 was 0.95 (Fig. 12).
Results and Discussion
In the current example, expression of a selection of genes of interest (G.O.I.) that are expressed by human neutrophils, was assessed. For each G.O.I., expression was compared between control (unstimulated) and LPS-stimulated cells.
Following stimulation of the cells with LPS, total RNA was extracted and reverse-transcription was performed. Fifty nanograms of cDNA were used for each reaction. Real-time PCR run was performed and specificity of the reactions was ascertained, as explained above.
Resulting Ct values were recorded for each gene of interest (G.O.I.) as well as for the house-keeping gene, in this case GAPDH (Fig. 13). The use of an endogenous reference gene (its expression is hardly influenced by the stimulation) ensures an internal control in terms of cDNA quantity and integrity. Results for G.O.I. can be normalized to results obtained with the reference gene. The choice of reference gene(s) depends on the cell type and experimental conditions.
Fig. 13. Typical real-time PCR results obtained for GAPDH, COX-1 and COX-2, in saline- and LPS-stimulated leukocytes.

Comparison of the expression of each gene between its control and stimulated states was determined with the delta-delta (DD)Ct, according to the following formula:

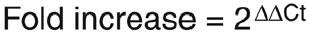
From this formula, a positive result would indicate an increase in the expression of the gene of interest in stimulated conditions, whereas a negative result would indicate a decreased expression. In order to transform the results into fold variation (a more intuitive unit), one can use the following formula:

Figure 14 illustrates the impact of LPS on COX-1, COX-2, TNF-α, MIP-1α and MIP-1β, expressed in fold increases compared to unstimulated states. This method has been successfully validated and used in recent studies, for determining the expression of inflammatory genes in human neutrophils and mononuclear cells (6, 7). When efficacy coefficients are similar for all G.O.I. as was the case here (0.95), one can compare effects of the stimulation, not only on one gene, but on different genes at once.
Fig. 14. Comparative real-time PCR results expressed in fold increase, for COX-1 and COX-2, TNF-α, MIP-1α and MIP-1β in leukocytes stimulated with LPS.

Results represent the mean ± SEM from n=3 distinct experiments.
When efficacy coefficients are undetermined, one can approximate fold variation measurements by simply using:
Acknowledgments
This work is supported by grants from the Canadian Institutes of Health Research (CIHR, to MP; grants nos. MOP-64315 and NSM-72200), from the Canadian Arthritis Network (to MP; grant no. 02-INF-15N) and from the Canadian Foundation for Innovation (CFI; New Opportunities Fund, no. 7337). MP is the recipient of a New Investigator Scholarship (CIHR-The Arthritis Society). The authors have no conflicting financial interests.
Appendix
Protocols
Comparative real-time PCR protocol
Optimize the components of samples, in particular: primer composition, amount of target cDNA, MgCl2 and SYBR® Green concentrations, and annealing temperature.
Prepare the samples. Enter appropriate parameters in the software. Perform the real-time PCR run.
Once the PCR completed, perform the Melt® procedure in order to ascertain specificity of the reactions.
Record the Ct values for: a) the gene(s) of interest from unstimulated and stimulated conditions, and b) for the house-keeping gene (e.g. GAPDH), from the unstimulated and stimulated conditions as well.
In order to compare the expression of each gene between its basal and stimulated states, one has to determine the delta delta (DD)Ct. A: Substract the Ct from gene of interest (unstimulated), of the Ct from house keeping gene (unstimulated). B: substract the Ct from gene of interest (stimulated) from the Ct from house keeping gene (stimulated). Subtract B from A, according to the following formula:

In order to have the results in fold variations (instead of DDCt), the following formula may be used: Fold variation = (Efficacy coefficient x 2)DDCt.
References
- Higuchi R, Fockler C, Dollinger G, Watson R. Kinetic PCR analysis: real-time monitoring of DNA amplification reactions. Biotechnology (NY) 1993;11:1026–1030. doi: 10.1038/nbt0993-1026. [DOI] [PubMed] [Google Scholar]
- Boyum A. Isolation of mononuclear cells and granulocytes from human blood. Isolation of monuclear cells by one centrifugation, and of granulocytes by combining centrifugation and sedimentation at 1 g. Scand J Clin Lab Invest Suppl. 1968;97:77–89. [PubMed] [Google Scholar]
- Pouliot M, Fiset ME, Masse M, Naccache PH, Borgeat P. Adenosine up-regulates cyclooxygenase-2 in human granulocytes: impact on the balance of eicosanoid generation. J Immunol. 2002;169:5279–5286. doi: 10.4049/jimmunol.169.9.5279. [DOI] [PubMed] [Google Scholar]
- Karsai A, Muller S, Platz S, Hauser MT. Evaluation of a homemade SYBR green I reaction mixture for real-time PCR quantification of gene expression. Biotechniques. 2002;32:790–796. doi: 10.2144/02324st05. [DOI] [PMC free article] [PubMed] [Google Scholar]
- Ginzinger DG. Gene quantification using real-time quantitative PCR: an emerging technology hits the mainstream. Exp Hematol. 2002;30:503–512. doi: 10.1016/S0301-472X(02)00806-8. [DOI] [PubMed] [Google Scholar]
- Cadieux JS, Leclerc P, St-Onge M, Dussault AA, Laflamme C, Picard S, Ledent C, Borgeat P, Pouliot M. Potentiation of neutrophil cyclooxygenase-2 by adenosine: an early anti-inflammatory signal. J Cell Sci. 2005;118:1437–1447. doi: 10.1242/jcs.01737. [DOI] [PMC free article] [PubMed] [Google Scholar]
- McColl SR, St-Onge M, Dussault AA, Laflamme C, Bouchard L, Boulanger J, Pouliot M. Immunomodulatory impact of the A2A adenosine receptor on the profile of chemokines produced by neutrophils. FASEB J. 2006;20:187–189. doi: 10.1096/fj.05-4804fje. [DOI] [PMC free article] [PubMed] [Google Scholar]