Is there a case to be made for draft sequencing?
First, we need to get a fix on how much less it costs than complete genome sequencing, how much faster and/or easier it is to do, and how much and what types of scientific utility are sacrificed. But this is not a straightforward issue. No accepted standard for draft sequence data exists; in current practice it ranges from ∼3-fold coverage in short (<400-bp), uncorrelated reads to 10-fold or more in long (∼>600-bp), “paired-end” (PE) reads (sequencing reads are taken from both ends of the insert in a double-stranded vector and therefore come in oppositely directed pairs separated by an approximately known distance) of mixed separation lengths. Quality differences over that spectrum are relatively great, as are, though to a much smaller extent, cost differences. The “draft-or-finish” alternatives are hardly exclusive; mixed, staged, or context-dependent strategies may also make sense. All the parameters are evolving rapidly. And finally, there is as yet too little experience to support definitive answers, although clearly enough to get an argument going in the better genome bars.
First, we address the production side of the question; consider the hypothetical case of sequencing factory X. This exemplary facility can produce over 30 Mb of high-quality (PE) bases per day at a fully loaded marginal cost of 0.3¢ base. Factory X has concluded that for most DNA, 8× PE coverage is usually optimal, both for producing draft data that are not intended for subsequent finishing and as a substrate for finishing. With this choice, finish-ready draft data have, at factory X, a current marginal cost of ∼2.5¢ base and can be produced at a rate of 3.6 Mb/day with a delay from time of DNA receipt to draft product on the order of 2 weeks.
The quality of this sequence is discussed below, but the general nature of its coverage integrity should be noted here. In ∼8-fold PE draft data, the overall coverage is typically high (>95% of the sequence represented). Most importantly, and especially so if a judicious mix of large and small inserts is used in the sequencing, “almost all” points in the sequence—including gaps between the contigs (contigs are contiguous stretches of sequence produced by assembling overlapping individual reads)—are bridged, or spanned, by multiple plasmid clones. This permits the automatic production of relatively high-quality, internally verified assembly and makes it possible to order and orient most of the contigs relative to each other to form large “scaffolds,” or sequence islands of valid order and high coverage. In such data, the expected error rate across genes is often better than 1/104, and a good estimate of the accuracy of each base can be made available.
Factory X can also finish such data to full “Bermuda” standards, i.e., an expected base-calling error rate of <1/104 and no gaps or other errors that mortal efforts could remove (these standards were established at meetings of the international Human Genome Project community), for an average additional cost of 7¢ base (and thus for a total cost of ∼10¢ base). Somewhat typically, however, factory X's finishing capacity is manyfold below its drafting capacity. Furthermore, the time needed to finish a segment of draft sequence can average several months and is highly variable.
In this landscape, “full Bermuda” data are about four times as expensive, and very much slower to produce, than “high-quality” draft data. For the extra cost of finishing a bacterial genome, three additional ones could be drafted. While factory X is finishing a bacterial genome, it could draft, in the sense described, upwards of a hundred more.
To our necessarily imperfect knowledge, no sequencing facility is currently producing either PE raw data or “fully finished” sequence data for true costs significantly below those quoted. But the relative advantage in cost and project completion time of draft versus finished sequence data at factory X might well not be the same in other facilities. And of course, the differences in steady-state production capacity for draft versus finished sequence used in the example are in large measure merely an arbitrary matter of resource commitment.
Also, there are some, at least potential, hidden costs in producing draft data that should be considered. (i) Draft sequence errors and imperfections may mislead users and thereby entail costs in wasted effort and delay. (ii) It may be substantially more expensive on average to finish draft sequence data later, should it prove desirable, than to do so at the start and in the same laboratory. (iii) Many have seen a risk that the will (at either the funding or bench level) to ever fully finish sequence data will be lost should we permit ourselves the cheap and easy pleasures of draft sequencing.
We comment a little on these questions at the end. The next issue is the quality and utility of draft sequence data, focusing in particular on what we know about (i) sequence coverage, (ii) gene recovery and quality, and (iii) chromosome integrity and long-range order.
THE QUALITY OF MICROBIAL DRAFT DATA
The results summarized below are based on the experience of the Joint Genome Institute (JGI) in sequencing 23 microbial genomes, of which 5 have been finished. The remaining 18 have been sequenced to an average eightfold PE coverage. As yet, none of these have been completed to the desired or intended draft standards, although two are close (Rhodobacter sphaeroides [two scaffolds make up the genome's two chromosomes] and Thermobifida fusca [five scaffolds]). In particular, no large insert data have yet been incorporated into any of the assemblies (this is now in progress), and for some of the projects the libraries used are now known to be of inadequate quality and/or to have provided only marginally adequate coverage. The JGI intends to add the needed sequence data to the goal of assembling all of these draft genomes into one or a very small number of scaffolds. At present, however, our analysis is based on this intermediate and, for some of the microbes sequenced, compromised data. Further, the results summarized here are based on Phrap assemblies. An assembler (JAZZ) capable of incorporating the PE information in the assembly process is under development at the JGI and is currently being used in the reanalysis of these genomes incorporating added large-insert data as mentioned above.
The 18 draft genomes comprise ∼80 Mb and have genome sizes of 1.8 to ∼9.6 Mb, GC contents from 37 to 68%, and gene densities ranging from 0.8 to 1/kb. The average contig size in these data sets is ∼33 kb (range, 14 to 87 kb) (http://www.jgi.doe.gov/JGI_microbial/html/index.html).
The graphs below present representative data summarizing typical results obtained from good, 2- to 3-kb insert plasmid sequencing libraries. Of course, not all genomes, even when the libraries are of excellent quality, go together as well as these results reflect.
CONTIG FORMATION VERSUS DEPTH OF COVERAGE
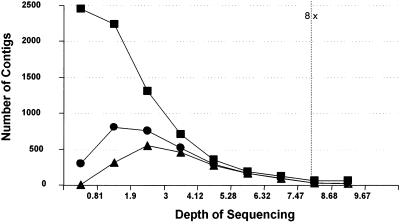
Shotgun coverage above eightfold produces only modest improvement in contig sizes. In Fig. 1, the read data set used to produce the now-finished genome of Rhodopseudomonas palustris was sampled randomly at various coverage levels and assembled.
FIG. 1.
Contig formation versus depth of coverage. ▪, all contigs; ▴, contigs with ≥20 reads; •, contigs of ≥2 kb.
GENE RECOVERY VERSUS DEPTH OF COVERAGE
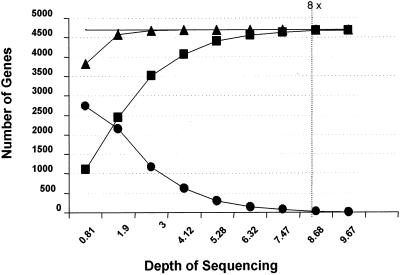
Most genes are detected at sequence coverage above fourfold, but the fraction of genes completely and accurately represented in intact contigs continues to increase noticeably (typically reaching values above 95%) out to about eightfold coverage. In Fig. 2, draft data sets for this genome at coverage levels from 0.81- to 9.67-fold were assembled and analyzed for BLAST hits to known genes. The hits were categorized as “detected” (BLAST score [p] ≤ e−10) and further subcategorized as either “incomplete” (p ≤ e−10 but not all bases present in the match) or “complete” (p ≤ e−10, all bases present).
FIG. 2.
Gene recovery versus depth of coverage. ▪, complete genes; ▴, genes found; •, incomplete genes.
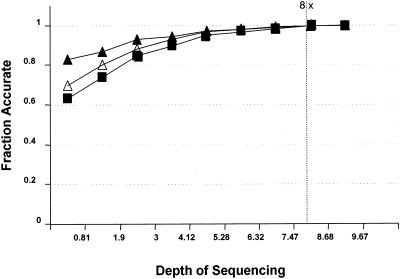
Figure 3 assesses the quality of gene sequences found at various levels of draft coverage by comparing them with their counterparts in the fully finished version of the same genome. As in the first figures, the set of sequence reads produced for the R. palustris genome was sampled randomly at various coverage levels, assembled, and compared for gene matches with the fully finished and annotated sequence (a “perfect” match is one in which the draft and finished version of the gene agree exactly over its complete length) (Fig. 3).
FIG. 3.
Quality of gene sequences found versus depth of coverage. ▪, fraction that was perfect; ▴, fraction with no indels; ▵, fraction with no mismatches.
The ∼7.5-fold data set from Fig. 3 was then analyzed more completely by dividing the draft genes which found full-length matches in the finished sequence into those of “high quality” (no base with a Phrap score of <20, average of >40) and “low quality” (the remainder) (Table 1).
TABLE 1.
Fraction of high- and low-quality gene finds at 7.5x
| Gene category | No. of genes | Fraction (%) | No. (%) of genes with errors |
|---|---|---|---|
| High quality | 4,459 | 95 | 5 (0.1) |
| Mismatches only | 2 | ||
| Indels only | 3 | ||
| Both | 0 | ||
| Low quality | 169 | 5 | 73 (43) |
| Mismatches only | 34 | ||
| Indels only | 23 | ||
| Both | 16 |
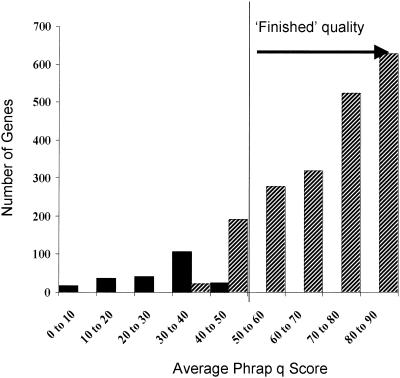
In Table 1, 95% of the full-length match genes were of high quality, and in these only 0.1% of genes (and ≪1/104 bases) had errors. As a preliminary look at how representative this somewhat artificial and optimistic example is, the ∼7.5-fold draft sequence acquired for the Xylella fastidiosa strain Ann-1 genome was analyzed by assessing the DNA sequence quality of genes identified by automated annotation of the draft sequence. Genes, all of whose aligned bases had a Phrap score above 20 were separated from the rest (Fig. 4). All hits were then plotted in a histogram against the average Phrap value over the aligned gene. More than 90% of the gene hits had no base with a Phrap value of <20 and had an average Phrap value of >40 (“finished” quality; Fig. 4).
FIG. 4.
Gene sequence quality at 7.5× in X. fastidiosa. ▪, genes having one or more bases with a q value of ≤20; ▨, genes with all bases having a q value of >20.
CHROMOSOME INTEGRITY AND LONG-RANGE ORDER
The average contig size over the current draft data set is somewhat over 30 kb (for contigs of >1 kb). The size of the scaffolds produced by using the PE linking data to tie adjoining contigs into an ordered and oriented set of neighbors is typically three- to fourfold larger than the average contig size (in genomes with about eightfold PE coverage from high-quality ∼3-kb libraries). In these cases, over 90% of the genome is typically covered by scaffolds with an average size of >100 kb. However, for the reasons stated above, the JGI's current data do not give a useful picture of how much long-range order and orientation will be achievable in these genomes by purely draft methods. We are convinced, however, that it will prove possible, without hand finishing, to reduce most microbial genomes to one or only a few scaffolds covering well above 95% of the sequence. The JGI is committed to bringing all of its draft microbial genomes to this standard, both retroactively and going forward, in part to provide a more definitive test for the value of such unfinished sequence data.
DRAFTING METAZOAN GENOMES
Because of the large architectural differences between microbial and metazoan genomes, the cost and utility considerations bearing on the decision to draft or finish are significantly different. Nonetheless, our experience thus far persuades us that in the metazoan domain as well the majority of the available investment should be put into draft sequencing. An example of that experience, involving the use of mostly draft data in the comparative sequence analysis of mammalian genomes is available in reference 2 and at http://bahama.jgi-psf.org/pub/ch19/. An earlier analysis of gene recovery in mammalian draft sequence is also available (1).
CONCLUSIONS
The defining distinction of draft sequencing is the avoidance of significant human intervention; it is anything produced by essentially automatic, “just sequence, stupid” methods. And neither we nor the rest of the world is done trying to get more for less out of such approaches. This is still very early days in every sense.
Our provisional conclusion is, nevertheless, that draft data of the type described are of quite high scientific value and afford a “best-investment” bargain in many, if not most, scientific contexts. Furthermore, draft sequences produced to a quite reachable, somewhat higher standard, such that (almost always) one or only a few scaffolds per microbial genome were produced (while probably still staying at about eightfold total sequence coverage for most genomes and holding to the same costs), would be much more useful. Given capacity and cost structures available now, a $50 million dollar investment could be used to produce something like 100 fully finished microbial genomes, though more than 5 years would likely be consumed in the effort; or it could be used to produce ∼400 very high quality draft genomes in a year or less. Furthermore, drafting is hardly the enemy of finishing. In our experience, delayed, third-party, or targeted finishing can be made to work very efficiently as a second step to draft sequencing of the form described and is often best done by those who know and care deeply about the microbe, gene, or operon they are finishing.
Acknowledgments
This work was performed under the auspices of the U.S. Department of Energy’s Office of Science, Biological and Environmental Research Program and by the University of California, Lawrence Livermore National Laboratory, under contract no. W-7405-Eng-48, Lawrence Berkeley National Laboratory under contract no. DE-AC03-76SF00098, and Los Alamos National Laboratory under contract no. W-7405-ENG-36.
REFERENCES
- 1.Bouck, J., W. Miller, J. H. Gorrell, D. Muzny, and R. A. Gibbs. 1998. Analysis of the quality of utility of random shotgun sequencing at low redundancies. Genome Res. 8:1074-1084. [DOI] [PMC free article] [PubMed] [Google Scholar]
- 2.Dehal, P., P. Predki, A. S. Olsen, A. Kobayashi, P. Folta, S. Lucas, M. Land, A. Terry, C. L. Zhou Ecale, S. Rash, Q. Zhang, L. Gordon, J. Kim, C. Elkin, M. J. Pollard, P. Richardson, D. Rokhsar, E. Uberbacher, T. Hawkins, E. Branscomb, and L. Stubbs. Human chromosome 19 and related regions in mouse: conservative and lineage-specific evolution. Science 293:104-111. [DOI] [PubMed]


