

Abstract
Many reactions in cells proceed via the sequestration of two DNA molecules in a synaptic complex. SfiI is a member of a growing family of restriction enzymes that can bind and cleave two DNA sites simultaneously. We present here the structures of tetrameric SfiI in complex with cognate DNA. The structures reveal two different binding states of SfiI: one with both DNA-binding sites fully occupied and the other with fully and partially occupied sites. These two states provide details on how SfiI recognizes and cleaves its target DNA sites, and gives insight into sequential binding events. The SfiI recognition sequence (GGCCNNNN↓NGGCC) is a subset of the recognition sequence of BglI (GCCNNNN↓NGGC), and both enzymes cleave their target DNAs to leave 3-base 3′ overhangs. We show that even though SfiI is a tetramer and BglI is a dimer, and there is little sequence similarity between the two enzymes, their modes of DNA recognition are unusually similar.
Keywords: protein/DNA complex, specific DNA cleavage, type IIF restriction endonuclease
Introduction
Protein–DNA selectivity is a central event in many biological processes, ranging from transcription and replication to restriction and modification. Type II restriction endonucleases are ideal systems for studying selectivity because of their high specificity and great variety. More than 3600 restriction enzymes representing more than 250 different specificities have now been identified (Roberts et al, 2005), with enzymes such as BamHI and EcoRI part of the lexicon of modern biology. In general, these enzymes are dimeric and recognize DNA sequences that vary between four and eight base pairs, and require only Mg2+ as a cofactor to catalyze the hydrolysis of DNA (Roberts and Halford, 1993; Vanamee and Aggarwal, 2004; Pingoud et al, 2005). To cleave another site, the dimer has to first dissociate and rebind at another recognition site. However, a growing number of restriction enzymes (REases) have now been shown to bind to two DNA sites simultaneously (Bilcock and Halford, 1999; Embleton et al, 2001; Bath et al, 2002; Gormley et al, 2002). These endonucleases fall into several different subclasses, including the type IIE enzymes such as EcoRII and NaeI, which are dimeric and cleave only one site during a single turnover but require a second DNA site for allosteric activation (Jo and Topal, 1995; Reuter et al, 1998), and the type IIF enzymes such as SfiI (Bilcock and Halford, 1999), NgoMIV (Deibert et al, 2000), and Cfr10I (Embleton et al, 2001), which are tetrameric and cleave both DNA sites concertedly. Another example is the type IIS endonuclease FokI that is monomeric in solution, but forms an active complex consisting of two protein and two DNA molecules (Vanamee et al, 2001; Bath et al, 2002). Altogether, these novel restriction endonucleases show similarities to various enzymes that bring distant DNA sites together. For example, a FokI-like fold has been identified in TnsA, one of the two proteins of the Tn7 transposase that mediates the release of the transposon (Hickman et al, 2000). EcoRII shows sequence homology to the integrase family of recombinases (Topal and Conrad, 1993), while NaeI has been shown to possess topoisomerase and recombinase activities (Jo and Topal, 1995). SfiI is not a recombinase, but like recombinases it catalyzes a four-strand DNA breakage (Wentzell and Halford, 1998).
Among type IIF enzymes, SfiI (31 kDa per monomer) is the best biochemically and functionally characterized endonuclease (Qiang and Schildkraut, 1984; Wentzell et al, 1994; Nobbs and Halford, 1995; Szczelkun and Halford, 1996; Nobbs et al, 1998a, 1998b; Wentzell and Halford, 1998; Bilcock and Halford, 1999; Embleton et al, 1999; Watson et al, 2000; Williams and Halford, 2002; Embleton et al, 2004). SfiI is also one of the few REases with an eight base-pair palindromic DNA recognition sequence (Bilcock et al, 1999), which is also unusual in containing a five base-pair interruption, 5′-GGCCNNNN↓NGGCC-3′, where N is any nucleotide and the arrow indicates the site of cleavage (Qiang and Schildkraut, 1984). SfiI, like other members of the type IIF family, becomes activated for cleavage after binding two copies of its recognition sequence, leading to the concerted cleavage of all four DNA strands (Bilcock and Halford, 1999). Intriguingly, the binding of a noncognate DNA to SfiI results in an inactive complex that cannot bind to another DNA site (Embleton et al, 1999). The structures of three type IIF enzymes have been reported, Cfr10I (Bozic et al, 1996), NgoMIV (Deibert et al, 2000), and Bse634I (Grazulis et al, 2002), an isoschisomer of Cfr10I, with only NgoMIV in complex with DNA. SfiI, like other members of the type IIF family, is a homotetramer, but its sequence is unrelated to that of other type IIF enzymes.
An understanding of SfiI's basis of DNA recognition and catalysis has been hindered by the lack of structural data. We report here crystal structures of SfiI bound to its DNA substrate. We obtained two different crystal forms of SfiI/DNA complex that reveal two different binding states of the enzyme: one with both DNA-binding sites occupied and the other with a fully and a partially bound DNA. Surprisingly, SfiI is in a catalytically incompetent state even when bound to two cognate DNAs. We discuss the implications of these structural intermediates for concerted cleavage. We also show that even though SfiI is a tetramer and belongs to the type IIF family of restriction enzymes, its subunit structure and DNA-binding arrangement is much more akin to the dimeric type IIP enzyme BglI.
Results
Structure determination
As described previously, we obtained two different crystal forms of SfiI/DNA complex depending upon whether we used native or selenomethionine (Se–Met) derivatized SfiI (Viadiu et al, 2003). Cocrystals of native SfiI with an iodinated 21-mer encompassing the SfiI recognition sequence (5′-ATGUIGGCCAACAAGGCCUIATT-3′ (top strand) and 5′-AAUIAGGCCTUIGTUIGGCCACAT-3′ (bottom strand)) belong to space group P3221, with unit cell parameters of a=b=85.7 Å, c=202.6 Å, and diffract to high 2.4 Å resolution. Cocrystals of Se–Met SfiI with the same DNA, on the other hand, belong to space group P6122, with unit cell dimensions of a=b=85.5 Å, c=419.6 Å, and diffract to medium 3.05 Å resolution. The Se–Met complex was used to measure multiwavelength anomalous diffraction (MAD) at two wavelengths, corresponding to the edge and peak of the Se absorption profile. Surprisingly, the structure revealed one side of SfiI tetramer with fully bound DNA, while the other side had a partially bound DNA (Figure 1). The structure of the higher resolution native complex was then solved by molecular replacement, using an SfiI monomer from the lower resolution Se–Met complex as search model in CNS (Brunger et al, 1998). In this case, both DNA-binding sites on the SfiI tetramer were found to be fully occupied. The overall structure of the native complex is very similar to the lower resolution Se–Met structure; the only significant change is in one of the loops that undergoes a conformational change upon ‘full' DNA binding (Figure 1). Given the similarity between the two structures, we describe below the structure of the higher resolution native complex (and refer to the Se–Met complex, as needed).
Figure 1.
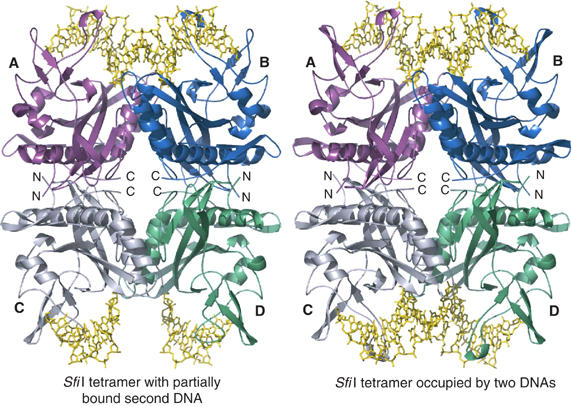
Schematic representation of SfiI–DNA complexes. On the right is shown the native structure with SfiI tetramer bound to two DNA molecules. Each subunit is color coded as follows: (A) magenta, (B) blue, (C) light gray, (D) (green); the DNA is shown in yellow. On the left is shown the Se–Met structure, wherein the A/B dimer is bound to fully occupied DNA and the C/D dimer is bound to partially occupied DNA. The nonspecific middle bases in the partially occupied DNA could not be built due to the lack of electron density. Note also that the loop contacting the partially occupied DNA in the C/D dimer adopts a different conformation.
Overall arrangement
The SfiI tetramer has a box-like shape (60 Å × 80 Å × 100 Å), wherein the four subunits (A, B, C, and D) are arranged into a dimer of dimers with D2 symmetry (Figure 1). In the native complex, two DNA molecules are bound to opposite sides of the SfiI tetramer, in a back-to-back arrangement. Subunits A and B comprising the A/B dimer bind one DNA molecule, while subunits C and D comprising the C/D dimer bind the second DNA molecule. The two DNAs are separated by ∼68 Å, and their axes are tilted relative to each other (by ∼60°) because the two-fold axis relating the A/B dimer to the C/D dimer is at an angle to the DNA axis. The local two-fold axes of the A/B and C/D dimers are, however, coincident with the pseudo two-fold axes of the bound DNAs, passing through the central base pairs (GGCCAACAAGGCC). This coincidence is from the minor groove side as in the case of EcoRV (Winkler et al, 1993) and PvuII (Cheng et al, 1994), but different from BamHI (Newman et al, 1995) and EcoRI (Kim et al, 1990), which approach DNA from the major groove side. Each SfiI subunit interacts primarily with a DNA half-site, and there is no ‘crossover' binding as in the case of BamHI and EcoRI, which recognize short DNA sequences. The cognate GGCC base pairs (GGCCAACAAGGCC) are recognized primarily in the major groove via a β-substructure that extends outward from the A/B and C/D dimers (Figure 2). There are no direct contacts to the non-cognate base pairs (GGCCAACAAGGCC). This DNA-binding arrangement of SfiI dimers is reminiscent of prokaryotic transcription factors, such as dimeric phage 434, and λ repressors that bind DNA operator sequences with ‘outer' cognate base pairs and ‘inner' noncognate base pairs (Aggarwal et al, 1988; Jordan and Pabo, 1988).
Figure 2.
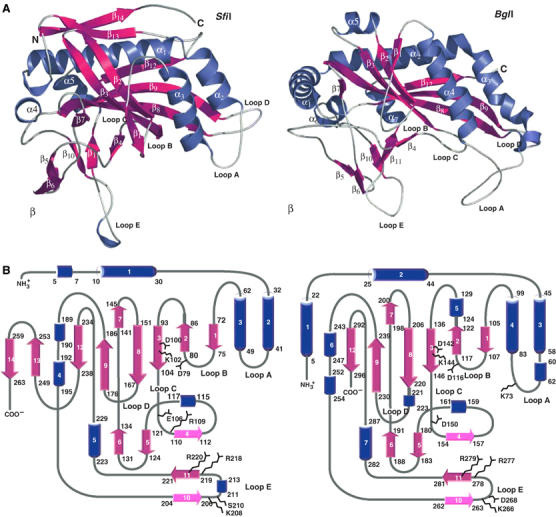
Comparisons between SfiI and BglI subunits. (A) Structure of SfiI (left) and BglI (right) monomers. The secondary structural elements are labeled and colored as follows: α helices are blue, β strands are magenta, and loops are white. The 3/10 helices are unlabeled. (B) Topology diagram of SfiI (left) and BglI (right) subunit. The color scheme is the same as in (A).
The most striking resemblance is with the type IIP enzyme BglI (Newman et al, 1998) (Figures 2 and 3). Interestingly, the SfiI recognition sequence (GGCCNNNN↓NGGCC) is a subset of the recognition sequence of BglI (GCCNNNN↓NGGC) (Figures 3 and 4), and both enzymes cleave their target DNAs to leave 3-base 3′ overhangs. Thus, even though SfiI is a tetramer and BglI is a dimer, and there is little sequence similarity between the two enzymes, their modes of DNA recognition are remarkably similar.
Figure 3.
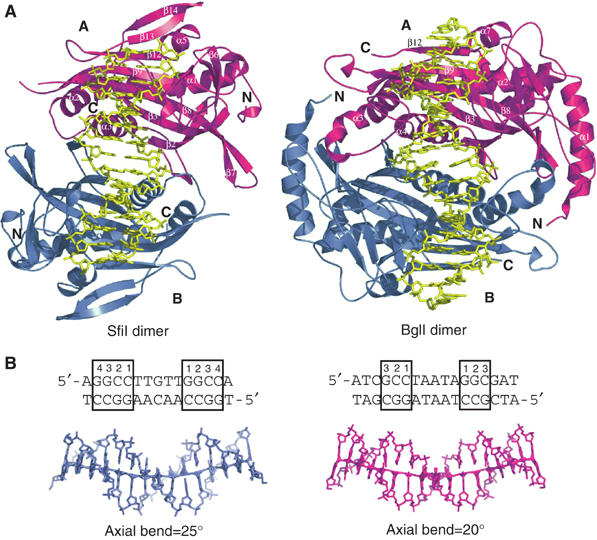
(A) Comparison between SfiI and BglI dimers. SfiI (left) and BglI (right) dimers bound to DNA. The monomers are colored magenta (A) and blue (B), and the DNA is shown in yellow. Both enzymes bind DNA in a similar fashion, with each monomer contacting one half site. (B) The structure of the DNA in SfiI (left) and BglI (right). The DNA molecules are represented in ‘stick' (SfiI in blue and BglI in magenta). The DNA sequences are listed on top, with the recognition sequences highlighted with a box around the base pairs. The cognate base-pairs are numbered from inside out. The SfiI and BglI DNAs are bent 25° and 20°, respectively, as calculated by CURVES (Lavery and Sklenar, 1988), and highlighted by the lines through the DNAs. In SfiI, electron density is seen for only 15 out of the 21 nucleotide residues.
Figure 4.
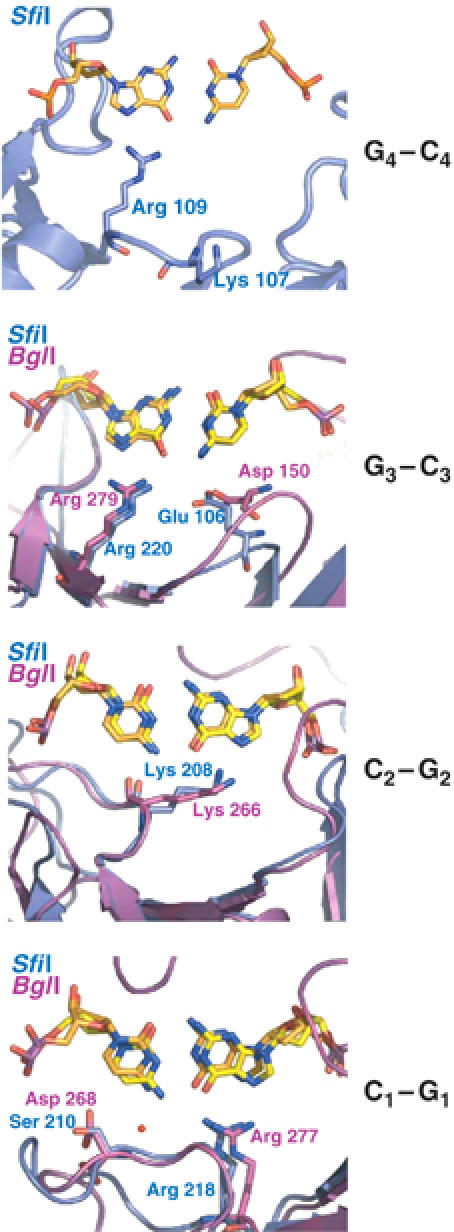
Comparison of base-specific DNA interactions in SfiI and BglI. The proteins are shown in ribbon representation (SfiI in blue and BglI in magenta). The nucleotides (SfiI DNA in orange and BglI DNA in yellow) and the base-specific residues are shown in ‘stick' representation. In each picture, only the base pairs in question are shown; other nucleotides are omitted for clarity.
Other tetrameric type IIF enzymes such as NgoMIV (Deibert et al, 2000), Cfr10I (Bozic et al, 1996), and Bse634I (Grazulis et al, 2002) also display D2 symmetry. Of these, only NgoMIV has been crystallized with DNA, and, like SfiI, the two DNA molecules are bound to opposite sides of the NgoMIV tetramer and are tilted with respect to each other to approximately the same degree as in SfiI (∼60°) (Deibert et al, 2000). However, the two DNA molecules are much closer (55 Å) than with SfiI (68 Å) even though the overall size of the NgoMIV tetramer is roughly similar (60 × 90 × 95 Å). In the NgoMIV complex, the DNAs are cleaved and the catalytic residues are abutted against the scissile phosphodiesters. In contrast, in the SfiI complex, the DNA backbone is ∼3 Å further away from the catalytic residues than in the NgoMIV complex and the enzyme is unlikely to cleave the DNA in this state. Thus, the structure of native SfiI/DNA complex presented here appears to be an intermediate on the path to concerted DNA cleavage.
The Se–Met complex offers a snapshot of an SfiI tetramer with fully and partially bound DNAs. Thus, whereas the A/B dimer binds DNA in much the same way as in the native complex, the DNA-binding site of the C/D dimer is only partially occupied. This is readily apparent from the lack of interpretable electron density for the middle base pairs, and the DNA base pairs that are seen have a higher average B-factor (85.6 Å2) than the corresponding base pairs in the A/B dimer (66.9 Å2). This suggests a highly mobile, partially bound DNA to the C/D dimer. Accordingly, a key portion of a loop (residues 211–219) in the β-substructure that helps to hold the DNA in place in the A/B dimer (and the native complex) is oriented away from the DNA on the C/D dimer (Figure 5).
Figure 5.
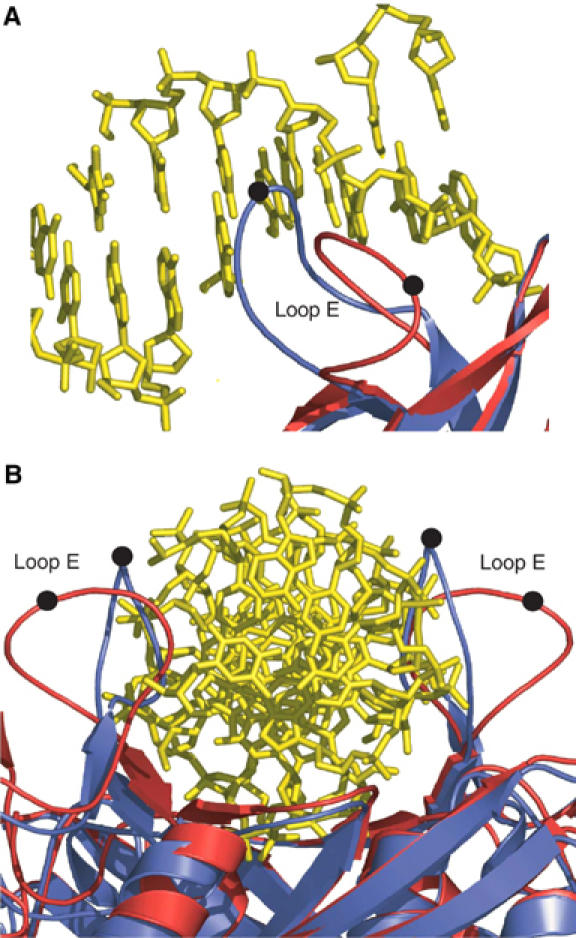
Change in loop E conformation. (A) Loop E enters the DNA major groove in the native complex (blue), but in the C/D dimer of the Se–Met complex (red) it packs away from the DNA. Black spheres mark the position of Arg 213. (B) View of C/D dimer looking down the DNA axis. In the native complex (blue), loop E's bracket the DNA and help to hold it in place, while in the Se–Met complex (red) the loops are positioned away from the DNA.
Protein conformation
The SfiI monomer has the familiar REase α/β core (Aggarwal, 1995) comprised of a central twisted β sheet (β1, β2, β3, β8, β9, and β12) surrounded by α helices (α1, α2, α3, and α5) (Figure 2). Typical of REases, the first three strands of this central β-sheet are antiparallel and form a β meander that carries the catalytic residues at one end. However, the other end of the β-meander is atypically associated with the SfiI tetramer interface. The α/β core is embellished by a β substructure consisting of several small β strands (β4, β5, β6, β10, and β11) and a long loop (loop E) that grazes the DNA major groove in the native complex. The residues responsible for specific recognition of the DNA are arranged on this β substructure. The β substructure can be viewed as an ‘insertion' between strands β3–β7 and α4–α5 of the α/β core. In the Se–Met complex, loop E in the A/B dimer is oriented in much the same way as in the native complex, but in the C/D dimer it has a different conformation, packed against strand β6 and away from the DNA (Figure 5).
The α/β core is further embellished on the backside by a β-hairpin (β13, β14) comprised of C-terminal residues. The A/B (or C/D) dimer interface is formed primarily by strands β1 and β2 and the connecting loop B from one subunit interacting with helices α2 and α3 from the other subunit, and vice versa. The interactions are mostly polar, and the dimer interface is stabilized by several hydrogen bonds (Asp56 OD2–Gly76 N and Tyr60 OH–Phe74 O, e.g.), as well as three salt bridges (Glu34 OE1–Arg73 NH1, Glu63 OE1–Arg82 NH2, and Lys81 NZ–Asp56 OD2). The amount of solvent-accessible area buried at the dimer interface (1650 Å2) is substantially smaller than that observed for dimeric REases such as BamHI (2300 Å2) and EcoRI (2350 Å2), or even tetrameric NgoMIV (2000 Å2). Interestingly, the dimer interface is much less than that observed in BglI (3500 Å2), which contains almost 40 hydrogen bonds as compared to the handful seen in SfiI. The paucity of dimer interactions in SfiI is made up by tetrameric interaction between the A/B and C/D dimers (Figure 1). In addition to the backside of the β-meander, helix α1 and several C-terminal residues are also intimately associated with the tetramer interface. These interactions are mainly nonpolar, in contrast to the predominant polar interaction at the dimer interface, allowing perhaps more ‘freedom' for movement at the tetramer interface. A total of 6900 Å2 of solvent accessible area is buried at the tetramer interface between the two primary A/B and C/D dimers, which is substantially larger than that observed for NgoMIV (5900 Å2). On the other hand, ‘cross' contacts between the A/C and B/D dimers in the NgoMIV complex are not seen in the SfiI complex, possibly due to an ∼15 Å cavity in the middle of the SfiI tetramer (Figure 1).
Over 80% of the SfiI residues can be structurally overlapped with those in BglI (r.m.s.d. of ∼2.4 Å), even though the sequence identity between the two enzymes is very low (<15%), as determined by distance matrix alignment using the DALI software (Holm and Sander, 1993). The way in which the BglI dimer binds DNA is very similar to the mode in which the SfiI A/B and C/D dimers dock with DNA (Figure 3). A set of analogous loops (loops A, B, C, and E) participates in DNA interactions in both enzymes. The major difference between the two enzymes is that dimeric interface in SfiI is much smaller. In BglI, a long N-terminal helix (α1) from one subunit wraps around the other subunit, providing additional surface contacts to stabilize the dimer. There is no equivalent of this helix in SfiI, resulting in far fewer dimer contacts (Figure 3). On the other hand, the C-terminal β-hairpin involved in tetramerization in SfiI is missing in BglI. Chmiel et al (2005) have used a threading approach to arrive at a homology model of SfiI in complex with DNA. The model anticipates the SfiI subunit structure quite well, with much of the error in the prediction of the tetramer interface.
DNA conformation
The DNA curves away from the SfiI α/β core in a relatively smooth fashion, with a total bend of ∼25° (Figure 3b). Overall, the DNA has a B-form conformation with average helical twist and rise of 34.35° and 3.35 Å, respectively. The BglI DNA is also B-form and curves away from the α/β core, though to a lesser extent (20°) (Figure 4a). There are no kinks in the SfiI and BglI DNA axes of the type seen in EcoRV and EcoRI DNAs, or any major unwinding at the central base-pair step as seen in EcoRV (Winkler et al, 1993), EcoRI (Kim et al, 1990), and BglII (Lukacs et al, 2000) DNAs. The direction of curvature is the same as in most restriction enzyme complexes, namely away from the α/β core. In contrast, dimeric transcription factors such as phage 434 repressor (Aggarwal et al, 1988) or Escherichia coli Trp repressor (Otwinowski et al, 1988) bend DNA towards the body of the protein. As a consequence, the minor groove at the center of the DNA is significantly narrower (∼3 Å) in the phage 434 DNA complex than in the SfiI complexes (∼6 Å).
DNA recognition
DNA recognition occurs in the major groove via residues located primarily on strands β4, β10, and β11 of the β substructure. Strands β10 and β11 track the major groove surface, with the loop between them (loop E) partially entering the groove. Three of the four G·C base pairs in the SfiI recognition half-site (G4G3C2C1) are in common with the BglI half-site, and the recognition of these is remarkably similar between the two enzymes (Newman et al, 1998) (Figure 4). Specifically, Arg218 and Arg220 in SfiI and Arg277 and Arg279 in BglI donate bidentate hydrogen bonds to the first and third guanines (GCC), respectively, while Lys208 in SfiI and Lys266 in BglI donate a single hydrogen bond to O6 of the second guanine (GCC). Moreover, the main-chain carbonyl of this same lysine accepts a hydrogen bond from the N4 of the second cytosine (GCC). In both enzymes, these arginines and lysines are located on strands β11 and β10 that bind tangentially to the major groove. There is, however, a difference in the recognition of the cytosines at the first and third positions (GCC), where SfiI utilizes a water molecule (mediated by Ser210) and a glutamate (Glu106), respectively, and BglI uses a water molecule (mediated via Asp268) and an aspartate (Asp150). A more striking difference between the enzymes is that whereas SfiI does not partake in any minor groove contacts in the recognition of its sequence, BglI makes a series of direct and water-mediated hydrogen bonds via Lys73 located on loop A between helices α3 and α4. Interestingly, the equivalent loop in SfiI is much shorter and it does not enter the minor groove or carry the equivalent of Lys73.
Altogether, the commonalities in DNA recognition between SfiI and BglI are more extensive than observed for other restriction enzymes pairs that recognize the same subset of base pairs, with the exception of MunI (Deibert et al, 1999) and EcoRI (Kim et al, 1990) that recognize their common inner and middle base pairs (NAATTN) in a nearly identical manner. This is due to the presence of a GNAXER sequence in MunI and EcoRI that lies along the major groove and is responsible for all of the direct contacts to the inner and middle base pairs. In contrast, BamHI and BglII, which also recognize identical inner and middle base pairs within their recognition sites (NGATCN), interact differently with these base pairs due in part to differences in DNA conformation (Lukacs et al, 2000). BstYI (Townson, 2005) also recognizes the same inner and middle base pairs as BamHI and BglII, but the amino acids that interact with these common base pairs are different as, for example, a lysine in place of an asparagine in BamHI (Newman et al, 1995) and BglII (Lukacs et al, 2000).
SfiI is unique in recognizing a fourth G:C base-pair (GGCC), making it one of the few restriction enzymes with an 8-bp recognition sequence (Bilcock et al, 1999). This outer G:C base pair is recognized by Arg109 that is located at the tip of strand β4. Arg109 makes bidentate hydrogen bonds with the outer guanine, its extended configuration buttressed by an intricate network of hydrogen bonds with Tyr222 and Asp106. Intriguingly, the structurally equivalent residue to Arg109 in BglI is Asp154, which not only lacks the functional groups to recognize a guanine in the major groove but also is far too short to reach the outer base. Thus, all four guanines in the SfiI recognition sequence are recognized in one to one correspondence with a basic residue, located on β-strands and connecting loops tangential to the major groove. Three of the basic residues are arginines (Arg109, Arg218, and Arg220), while the fourth is a lysine (Lys208); however, all four are in an extended conformation that allows them to reach the guanines. The guanidinium groups of the arginines lie in the planes of the respective guanine bases, allowing for ‘classical' bidentate hydrogen bonds with the O6 and N7 atoms. Arg109 is ordered in monomers A and C, but is disordered in monomers B and D. The A/B and C/D primary dimers are thus slightly asymmetric, with only one monomer in each dimer making all the base-specific hydrogen bonds with the DNA. (Conversely, residues 169–172 of loop D are disordered in monomers A and C, but are ordered in monomers B and D.) Although there is no hydrogen bonding interaction to the outer cytosine (GGCC), a lysine residue (Lys107) nearby could, through a slight reorganization of loop C, be reoriented to interact with the cytosine (as predicted by the SfiI homology model (Chmiel et al, 2005)).
SfiI makes no direct hydrogen bonds to the inner, variable base pairs (GGCCAACAAGGCC). SfiI approaches these base pairs from the minor-groove side, whereby loop A from subunit A and its counterpart from subunit B straddle the minor groove at the center of the DNA. Residue Ser46 from loop A makes a direct hydrogen bond with the sugar-phosphate backbone. Although these inner base pairs have been designated noncognate, they do influence the activity of SfiI. For example, a change in this sequence from AACAA to AAACA causes an ∼70-fold increase in the reaction rate, while the sequence ATATA has a similar rate (Williams and Halford, 2001). In addition, the sequences AAAAA and AAAAC show an ∼10-fold increase in reaction rate over the AACAA sequence. A-tracks in DNA are known for their rigidity and they tend to become more flexible with the insertion of the T and C bases (Travers, 1991). The AACAA and ATATA sequences are expected to be flexible, while the AAACA, AAAAC, and AAAAA sequences may be increasingly more rigid. It would seem that SfiI prefers the AAACA sequence, where flexibility is added at the site of cleavage over the more flexible AACAA and ATATA sequences or the more rigid AAAAA and AAAAC sequences. This ‘indirect' readout is again reminiscent of phage 434 repressor, where the sequence of the inner base pairs plays a key role in distinguishing one operator site from another (Aggarwal et al, 1988).
In the Se–Met complex, the A/B dimer interacts with fully occupied DNA in much the same way as described above for the native complex. In the C/D dimer, loop E is positioned away from DNA, and consequently Ser210 is unable to make a water-mediated contact to the first cytosine (GGCC) and Arg 213 is unable to stabilize the phosphate backbone around the nonspecific middle base pairs. Interestingly, many of the direct base-specific interactions are maintained because Lys208, Arg218, and Arg220, for example, adopt the same configuration as in the A/B dimer. The retention of these base-specific interactions may explain why on the C/D dimer the outer cognate base pairs are more ordered than the inner nonspecific base pairs (not visible in the electron density map). An interesting question is whether replacement of methionines with selenomethionines in the Se–Met complex contributes to the observed structural differences with the native complex. The N-terminal methionine from each subunit points toward the tetramer interface and it is conceivable that they impart a subtle change in the communication between the dimers to yield an SfiI variant with fully and partially bound DNAs. However, any such change must be highly subtle, as the tetramer interface in the Se–Met and native structures is very similar, superimposing with a low r.m.s.d., of 0.48 Å. We have also obtained crystals of the Se–Met complex with the same space group and cell parameters as the native complex (though at a lower resolution of 2.9 versus 2.4 Å), and a partially refined model of this complex is virtually identical to the native structure with two fully bound DNAs (data not shown). Taken together, it does not seem that the replacement of methionines with selenomethionines is the reason for the capture of SfiI with fully and partially bound DNAs.
Active site and cleavage mechanism
The active sites of type II restriction enzymes are similar, containing at least three overlapping residues that occur at one end of the β-meander. Most of the type II enzymes with known structures are classified as belonging to the PD-DXK superfamily of nucleases with the active site consensus of (P)D–Xn–(D/E)–X–K. However, with each new structure the consensus has weakened, such that the only strict coincidence is that the first catalytic residue that coordinates a catalytically important metal is an aspartate. The second catalytic residue is usually acidic, with the exception of the newly discovered REases MspI (Xu et al, 2004) and HinP1I (Yang et al, 2005), which have an asparagine (Asn 117) and glutamine (Glu 81), respectively, in the second position. Although the third catalytic residue is usually a lysine, it can also be replaced by a glutamate in BamHI (Newman et al, 1994, 1995) or a glutamine in BglII (Lukacs et al, 2000) and BstYI (Townson et al, 2004). Also, typical of almost all restriction enzymes, the second and third catalytic residues are separated by a single hydrophobic residue. The SfiI catalytic residues, Asp 79, Asp 100, and Lys 102, follow the general consensus and overlap with the catalytic residues in BglI, namely Asp 116, Asp 142, and Lys 144 (Figure 6). Intriguingly, in contrast to SfiI, in other type IIF restriction enzymes with known structures (NgoMIV, Cfr10I, and Bse634I) the second catalytic residue comes from a distant helix and not the β-meander (Bozic et al, 1996; Deibert et al, 2000; Grazulis et al, 2002). Thus, even though SfiI is tetrameric and belongs to the type IIF family of restriction enzymes, its subunit structure and DNA-binding arrangement is much more akin to the dimeric type IIP enzyme BglI.
Figure 6.
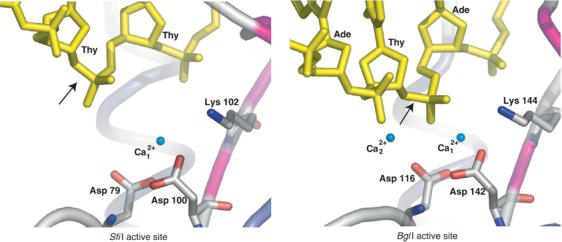
The active sites of SfiI (left) and BglI (right). The DNA and the active site residues of SfiI (Asp 79, Asp100, and Lys102) and BglI (Asp116, Asp142, and Lys144) are shown in ‘stick' representation. The scissile phosphodiester is indicated by arrows. The Ca2+ ions are shown as nonbonded spheres and colored aqua, water molecules are not shown. In SfiI, the second Ca2+ is missing and the scissile phosphodiester is ∼3 Å further away than in BglI, indicating that the enzyme is in an inactive state.
The BglI structure reveals two bound metals in the active site (Newman et al, 1998), matching the positions of metals in BamHI (Viadiu and Aggarwal, 1998) and NgoMIV (Deibert et al, 2000) DNA complexes. A two-metal mechanism of DNA cleavage has been suggested for these enzymes, which remains to be fully verified in solution. In SfiI, we see density for only a single metal, coordinated to Asp 79 and Asp 100, and corresponding to metal 1 in BglI. Identical results were obtained when SfiI was cocrystallized with MgCl2 (data not shown). Given the structural similarities between SfiI and BglI, it is likely that the two enzymes cleave DNA by a similar mechanism. The difference in the number of metals observed between SfiI and BglI active sites likely reflects the capture of SfiI in an inactive, intermediate state, wherein the scissile phosphodiester bond is displaced ∼3 Å further away from the active site residues. In BglI, metal 2 is coordinated by Thy1 (O3′), Ade2 (O2P), Asp116 (OD1), and four water molecules (Newman et al, 1998). Given the greater distance between the DNA and the active site residues in SfiI, it is not surprising that a second metal cannot be seen in the SfiI complex (Figure 6). The lack of a second metal could be the result of the lower pH of the SfiI/DNA crystals (pH: 4.6–5.0) compared to that used for the BglI/DNA complex, where metals were soaked in at pH 6.5. The binding of a second metal likely marks the activation of SfiI to bring the scissile phosphodiester and the active site residues closer to each other for catalysis.
Discussion
SfiI, like other members of the type IIF family, becomes activated for cleavage after binding two copies of its recognition sequence, leading to the concerted cleavage of all four DNA strands. The binding of noncognate DNA to SfiI results in an inactive complex that cannot bind to another DNA site (Williams and Halford, 2001). We report here structures of SfiI in two different binding states one with both DNA-binding sites occupied (native complex) and the other with fully and partially bound DNAs (Se–Met complex). Surprisingly, SfiI is in a catalytically incompetent state even when bound to two cognate DNAs as in the native complex. Together, these structures paint a more complex picture of concerted cleavage with structural intermediates that precede catalysis.
Compared to the BglI dimer, SfiI monomers in the A/B and C/D primary dimers are rotated ‘outward' by ∼10° with respect to each other along an axis perpendicular to the DNA axis. This results in a somewhat larger DNA-binding cleft, with the DNA less enveloped than in BglI. The binding of a second metal ion (as in the active site of BglI) may trigger a change in dimer configuration that leads to a tighter grip on the DNA, bringing the catalytic residues in closer proximity to the scissile phosphodiester. This change in dimer configuration may in turn nucleate other quaternary changes that activate all four SfiI subunits, with the tetramer interface as the conduit for this concerted change. Compared to BglI, SfiI has a minimal dimer interface, but a rather extensive tetramer interface. The tetramer interface is mediated by the β-meander that carries the catalytic residues at one end, as well as by protein–protein interactions between helix α1 at the N-terminus of one SfiI monomer and the C-terminus of another. Any tightening of the DNA binding and/or the active site cleft in the A/B dimer, for example, can be transmitted to the C/D dimer via these elements at the tetramer interface.
SfiI prefers to interact with two cognate DNA sites when they are on the same DNA molecule (in cis) with the intervening DNA looped out, rather than on different DNA molecules (in trans). Intriguingly, when SfiI binds to a DNA molecule with three recognition sites, all three sites are cleaved before the enzyme dissociates (Embleton et al, 2004). This is contrary to the initial expectation that two of the sites would be cleaved in concert, while the third site remains uncleaved. One suggested mechanism for this cleavage of all three sites is that, following the concerted cleavage of two of the sites, SfiI remains bound to one of the sites, allowing the third site to then fill the empty DNA-binding cleft (Embleton et al, 2004). The Se–Met structure concurs with this model, revealing one side of SfiI fully engaged with DNA (A/B dimer) and the other side with partially bound DNA (C/D dimer). Interestingly, A/B and C/D dimers have similar structures, with the exception of loop E in the C/D dimer that packs away from DNA. The correct positioning of this loop appears to be critical in modulating DNA binding in SfiI.
The tetrameric arrangement of SfiI is similar to that of NgoMIV (Deibert et al, 2000), including the angle between the axes of the two bound DNAs. However, in the SfiI native complex, the two DNA molecules are 13–15 Å further apart than in the NgoMIV complex. Interestingly, SfiI prefers to cleave two cognate sites in cis when the intervening loop is short (∼400 bp) rather than long (>2000 bp), particularly in supercoiled DNA (Embleton et al, 2004). It will be interesting to know whether NgoMIV also prefers shorter loops as well as supercoiled DNA. Intriguingly, Monte-Carlo simulations have shown that the probability of juxtaposing two sites in supercoiled DNA is highest when the angle between the sites is 120° (or 60° depending on how the angle is defined) (Vologodskii and Cozzarelli, 1996), the same as reported here for SfiI, and earlier for NgoMIV (Deibert et al, 2000). Thus, restriction enzymes that recognize and cleave two DNA sites simultaneously appear to have evolved to take advantage of this angular constraint of supercoiled DNA in forming a synaptic complex.
Can SfiI be modified to recognize another DNA sequence? There is substantial interest in modulating the specificities of restriction enzymes to cleave alternative DNA sites. Consequently, there has been a large effort to modify the specificities of restriction enzymes, particularly those with known structures such as BamHI, EcoRI, PvuII, and EcoRV (Alves et al, 1989; Heitman and Model, 1990; Osuna et al, 1991; Flores et al, 1995; Grabowski et al, 1995; Ivanenko et al, 1998; Dorner et al, 1999; Alves and Vennekohl, 2004). The SfiI recognition half-site is marked by four guanines, which are recognized in one-to-one correspondence with a basic residue. These basic residues are in an extended conformation, and given the distance they traverse in the complex it would be difficult to change the specificity of SfiI because no other residue (other than an arginine or a lysine) would be able to reach the bases. Altogether, SfiI appears exquisitely tailored for the recognition of G.C base pairs and for the concerted cleavage of two DNA sites.
Materials and methods
Crystallization
Production and purification of native SfiI was carried out as described earlier (Wentzell et al, 1995). Recombinant Se–Met SfiI was prepared by inhibiting the methionine synthetic pathway and expressing the protein in the presence of selenomethionine. The purified native and Se–Met proteins were stored in 0.2 M KCl, 10 mM KPO4 (pH 7.3), 0.1 mM EDTA, and 1 mM dithiothreitol, and were concentrated to a final concentration of 22 mg/ml.
Single-stranded oligonucleotides were synthesized for HPLC purification by leaving the trityl group attached to the 3′ end. The trityl group was then removed directly on the HPLC column. After purification, the oligonucleotides were desalted prior to annealing. Equimolar amounts of complementary oligonucleotides were mixed and annealed at room temperature overnight. The final concentration of the double-stranded oligonucleotides was ∼10 mg/ml.
Cocrystallization was achieved by the hanging-drop vapor-diffusion method at 20°C. Crystals of the SfiI/DNA complex were obtained with a 21-mer oligonucleotide containing the sequence 5′-ATGT*GGCCAACAAGGCCT*ATT-3′ (top strand) and 5′-AAT*AGGCCTT*GTT*GGCCACAT-3′ (bottom strand). Initially, small crystals grew from several Hampton screen conditions that contained MPD and diffracted to 3.0 Å on the home X-ray source. Interestingly, the replacement of several thymines with iodo-uracils (indicated by stars in the sequence) lead to an increase in resolution from 3.0 to 2.6 Å at home, and these crystals are referred hereafter as ‘native'. These native cocrystals belong to space group P3221 with cell dimensions of a=b=85.7 Å and c=202.6 Å, and with two SfiI monomers (subunits A and B) and one DNA molecule per asymmetric unit. The best diffracting crystals grow from solutions containing 0.1 M sodium acetate (pH 4.6–5.0), 30–32.5% MPD, and 5–20 mM CaCl2. The crystals grow overnight and reach their maximum size within 2–3 days. Crystals of the Se–Met derivative SfiI/DNA complex grow under identical conditions. The largest native crystals are 0.8 × 0.2 × 0.2 mm; the Se–Met derivative crystals are somewhat smaller, reaching a maximum size of 0.5 × 0.2 × 0.1 mm.
X-ray data collection and structure determination
All X-ray data were measured at cryogenic temperatures. The native data (extending to 2.4 Å resolution) were measured at the Cornell High Energy Synchrotron Source (CHESS). The Se–Met data were measured at the Advanced Photon Source (beamline 19-ID) at two wavelengths, corresponding to the edge and peak of the Se absorption profile. The Se–Met crystals diffracted to medium 3.05 Å resolution, and, most surprisingly, the space group changed to P6122 with cell dimensions of a=b=85.5 Å and c=419.6 Å, and with two SfiI monomers (subunits A and C) and two halves of a DNA molecule in the asymmetric unit. The positions of all eight selenium sites (four per monomer) were located and subsequently refined using CNS (Brunger et al, 1998). The initial phases were improved by density modification, yielding an electron density map of good quality, which was used to build the initial model with program O (Jones et al, 1991). Only monomers A and C were built in O, while B and D were generated using crystallographic symmetry operators. Since the DNA used for cocrystallization is nonpalindromic outside of the recognition sequence, it could potentially bind as a mixture of two orientations. We looked for iodine sites in an anomalous difference Fourier map, but the anomalous signal was too weak to define the orientation. The DNA pieces were built and refined in two orientations with 0.5 occupancy, consistent with the symmetry of the space group. Several cycles of simulated annealing, positional and B-factor refinement, led to an Se–Met structure that showed the A/B dimer with fully bound DNA and the C/D dimer with partially bound DNA (Figure 1). The final Se–Met structure contains residues 1–269 for monomers A and C, eight and seven nucleotides in the two DNA chains bound to monomer A, five–five nucleotides in the two chains that are bound to monomer C, two Ca2+ ions, 111 water molecules, and is refined to a crystallographic R-factor of 24% and Rfree of 29%. The model has an excellent stereochemistry, with over 86% of the residues in the most favored regions of the Ramachandran plot. The structure of the higher resolution native complex was then solved by molecular replacement, using an SfiI monomer from the lower resolution Se–Met complex as a search model in CNS. In this case, both DNA-binding sites on the SfiI tetramer were found to be fully occupied. Monomers A and B were built, while monomers C and D were generated using the crystallographic symmetry operators. The DNA orientation could be determined unambiguously in the native structure because the iodine positions were clearly visible in the anomalous Fourier map. Several cycles of simulated annealing, positional and B-factor refinement led to a structure (R-factor of 22% and Rfree of 27%) containing residues 1–169 and 172–269 in monomer A, residues 1–269 in monomer B, 15 of the 21 nucleotide residues in each DNA chain, two Ca2+ ions, and 184 water molecules. This model has an excellent stereochemistry, with 90% of the residues in the most favored regions of the Ramachandran plot. Data collection, phasing, and refinement statistics for the native and Se–Met data are summarized in Table I.
Table 1.
Crystallographic data collection, phasing and refinement
| Se–Met derivative |
|||
|---|---|---|---|
| ‘Native' | Peak | Edge | |
| A. Data collection and phasing statistics | |||
| Wavelength (Å) | 0.928 | 0.97931 | 0.97941 |
| Total no. of reflections | 807 714 | 709 329 | 719 313 |
| Resolution range (Å) | 50–2.4 | 50–3.05 | |
| No. of unique reflections | 34 814 (3445) | 18 452 (1714) | 17 729 (1653) |
| Rsym (last shell) | 0.087 (0.33) | 0.112 (0.455) | 0.11 (0.446) |
| Completeness (%) (last shell) | 98.7 (99.9) | 99.7 (97.7) | 99.6 (98.0) |
| I/σ(I) | 34.0 (7.8) | 18.0 (3.5) | 19.9 (3.8) |
| No. of Se sites | N/A | 8 | 8 |
| Phasing power (anomalous acentrics) | N/A | 1.567 | — |
| Mean overall figure of merit | |||
| Centric | N/A | 0.7562 | |
| Acentric | N/A | 0.6127 | — |
| B. Refinement statistics | |||
| Resolution range (Å) | 50–2.4 | 50–3.05 | |
| No. of reflections used in refinement | 33 075 | 31 321 | |
| Rcryst/Rfree | 0.22/0.27 | 0.24/0.29 | |
| No. of atoms | |||
| Protein | 4235 | 4297 | |
| DNA | 608 | 673 | |
| Water | 186 | 113 | |
| Average B factors (Å2) | 28.3 | 37.6 | |
| R.m.s.d. | |||
| Bonds (Å) | 0.0065 | 0.0071 | |
| Angles (deg) | 1.37 | 1.33 | |
| aRsym=∑∣In−〈In〉/∑In over all h, where In is the intensity of the reflection h. | |||
| bRcryst/Rfree=∑∣∣Fo∣−∣Fc∣∣/∑∣Fo∣. Rfree was calculated with 5% of data excluded from refinement. | |||
Structural analysis
Analysis of the stereochemical quality of the protein model and assignment of secondary structure were conducted with PROCHECK (Laskowski et al, 1993). DNA analysis was performed with 3DNA (Lu and Olson, 2003) and CURVES (Lavery and Sklenar, 1988). Solvent-accessible surface areas were calculated in CNS with the algorithm of Lee and Richards (1971) employing a 1.4 Å probe. Figures were prepared using PyMOL (DeLano, 2003).
Coordinates
Coordinates have been submitted to the RCSB Protein Data Bank with accession codes #2EZV for the native SfiI tetramer, and #2F03 for the Se–Met SfiI complex.
Acknowledgments
We thank the staff at Advanced Photon Source (beamline 19-ID) and at CHESS for help with data collection. This work was supported by NIH grants GM44006 (AKA) and GM20015 (ÉSV).
References
- Aggarwal AK (1995) Structure and function of restriction endonucleases. Curr Opin Struct Biol 5: 11–19 [DOI] [PubMed] [Google Scholar]
- Aggarwal AK, Rodgers DW, Drottar M, Ptashne M, Harrison SC (1988) Recognition of a DNA operator by the repressor of phage 434: a view at high resolution. Science 242: 899–907 [DOI] [PubMed] [Google Scholar]
- Alves J, Ruter T, Geiger R, Fliess A, Maass G, Pingoud A (1989) Changing the hydrogen-bonding potential in the DNA binding site of EcoRI by site-directed mutagenesis drastically reduces the enzymatic activity, not, however, the preference of this restriction endonuclease for cleavage within the site-GAATTC. Biochemistry 28: 2678–2684 [DOI] [PubMed] [Google Scholar]
- Alves J, Vennekohl P (2004) Protein engineering of restriction enzymes. In Restriction Endonucleases, Pingoud A (ed), Vol 14, pp 393–411. Berlin, Heidelberg: Springer-Verlag [Google Scholar]
- Bath AJ, Milsom SE, Gormley NA, Halford SE (2002) Many type IIs restriction endonucleases interact with two recognition sites before cleaving DNA. J Biol Chem 277: 4024–4033 [DOI] [PubMed] [Google Scholar]
- Bilcock DT, Daniels LE, Bath AJ, Halford SE (1999) Reactions of type II restriction endonucleases with 8-base pair recognition sites. J Biol Chem 274: 36379–36386 [DOI] [PubMed] [Google Scholar]
- Bilcock DT, Halford SE (1999) DNA restriction dependent on two recognition sites: activities of the SfiI restriction–modification system in Escherichia coli. Mol Microbiol 31: 1243–1254 [DOI] [PubMed] [Google Scholar]
- Bozic D, Grazulis S, Siksnys V, Huber R (1996) Crystal structure of Citrobacter freundii restriction endonuclease Cfr10I at 2.15 A resolution. J Mol Biol 255: 176–186 [DOI] [PubMed] [Google Scholar]
- Brunger AT, Adams PD, Clore GM, DeLano WL, Gros P, Grosse-Kunstleve RW, Jiang JS, Kuszewski J, Nilges M, Pannu NS, Read RJ, Rice LM, Simonson T, Warren GL (1998) Crystallography & NMR system: a new software suite for macromolecular structure determination. Acta Crystallogr D 54 (Part 5): 905–921 [DOI] [PubMed] [Google Scholar]
- Cheng X, Balendiran K, Schildkraut I, Anderson JE (1994) Structure of PvuII endonuclease with cognate DNA. EMBO J 13: 3927–3935 [DOI] [PMC free article] [PubMed] [Google Scholar]
- Chmiel AA, Bujnicki JM, Skowronek KJ (2005) A homology model of restriction endonuclease SfiI in complex with DNA. BMC Struct Biol 5: 2. [DOI] [PMC free article] [PubMed] [Google Scholar]
- Deibert M, Grazulis S, Janulaitis A, Siksnys V, Huber R (1999) Crystal structure of MunI restriction endonuclease in complex with cognate DNA at 1.7 A resolution. EMBO J 18: 5805–5816 [DOI] [PMC free article] [PubMed] [Google Scholar]
- Deibert M, Grazulis S, Sasnauskas G, Siksnys V, Huber R (2000) Structure of the tetrameric restriction endonuclease NgoMIV in complex with cleaved DNA. Nat Struct Biol 7: 792–799 [DOI] [PubMed] [Google Scholar]
- DeLano WL (2003) The PyMOL Molecular Graphics System. San Carlos, CA, USA: DeLano Scientific LLC http://www.pymol.org [Google Scholar]
- Dorner LF, Bitinaite J, Whitaker RD, Schildkraut I (1999) Genetic analysis of the base-specific contacts of BamHI restriction endonuclease. J Mol Biol 285: 1515–1523 [DOI] [PubMed] [Google Scholar]
- Embleton ML, Siksnys V, Halford SE (2001) DNA cleavage reactions by type II restriction enzymes that require two copies of their recognition sites. J Mol Biol 311: 503–514 [DOI] [PubMed] [Google Scholar]
- Embleton ML, Vologodskii AV, Halford SE (2004) Dynamics of DNA loop capture by the SfiI restriction endonuclease on supercoiled and relaxed DNA. J Mol Biol 339: 53–66 [DOI] [PubMed] [Google Scholar]
- Embleton ML, Williams SA, Watson MA, Halford SE (1999) Specificity from the synapsis of DNA elements by the Sfi I endonuclease. J Mol Biol 289: 785–797 [DOI] [PubMed] [Google Scholar]
- Flores H, Osuna J, Heitman J, Soberon X (1995) Saturation mutagenesis of His114 of EcoRI reveals relaxed-specificity mutants. Gene 157: 295–301 [DOI] [PubMed] [Google Scholar]
- Gormley NA, Hillberg AL, Halford SE (2002) The type IIs restriction endonuclease BspMI is a tetramer that acts concertedly at two copies of an asymmetric DNA sequence. J Biol Chem 277: 4034–4041 [DOI] [PubMed] [Google Scholar]
- Grabowski G, Jeltsch A, Wolfes H, Maass G, Alves J (1995) Site-directed mutagenesis in the catalytic center of the restriction endonuclease EcoRI. Gene 157: 113–118 [DOI] [PubMed] [Google Scholar]
- Grazulis S, Deibert M, Rimseliene R, Skirgaila R, Sasnauskas G, Lagunavicius A, Repin V, Urbanke C, Huber R, Siksnys V (2002) Crystal structure of the Bse634I restriction endonuclease: comparison of two enzymes recognizing the same DNA sequence. Nucleic Acids Res 30: 876–885 [DOI] [PMC free article] [PubMed] [Google Scholar]
- Heitman J, Model P (1990) Substrate recognition by the EcoRI endonuclease. Proteins 7: 185–197 [DOI] [PubMed] [Google Scholar]
- Hickman AB, Li Y, Mathew SV, May EW, Craig NL, Dyda F (2000) Unexpected structural diversity in DNA recombination: the restriction endonuclease connection. Mol Cell 5: 1025–1034 [DOI] [PubMed] [Google Scholar]
- Holm L, Sander C (1993) Protein structure comparison by alignment of distance matrices. J Mol Biol 233: 123–138 [DOI] [PubMed] [Google Scholar]
- Ivanenko T, Heitman J, Kiss A (1998) Mutational analysis of the function of Met137 and Ile197, two amino acids implicated in sequence-specific DNA recognition by the EcoRI endonuclease. Biol Chem 379: 459–465 [DOI] [PubMed] [Google Scholar]
- Jo K, Topal MD (1995) DNA topoisomerase and recombinase activities in Nae I restriction endonuclease. Science 267: 1817–1820 [DOI] [PubMed] [Google Scholar]
- Jones TA, Zou JY, Cowan SW, Kjeldgaard (1991) Improved methods for building protein models in electron density maps and the location of errors in these models. Acta Crystallogr A 47 (Part 2): 110–119 [DOI] [PubMed] [Google Scholar]
- Jordan SR, Pabo CO (1988) Structure of the lambda complex at 2.5 A resolution: details of the repressor–operator interactions. Science 242: 893–899 [DOI] [PubMed] [Google Scholar]
- Kim YC, Grable JC, Love R, Greene PJ, Rosenberg JM (1990) Refinement of Eco RI endonuclease crystal structure: a revised protein chain tracing. Science 249: 1307–1309 [DOI] [PubMed] [Google Scholar]
- Laskowski RA, MacArthur MW, Moss DS, Thornton JM (1993) PROCHECK: a program to check the stereochemical quality of protein structures. J Appl Crystallogr 26: 283–291 [Google Scholar]
- Lavery R, Sklenar H (1988) The definition of generalized helicoidal parameters and of axis curvature for irregular nucleic acids. J Biomol Struct Dyn 6: 63–91 [DOI] [PubMed] [Google Scholar]
- Lee B, Richards FM (1971) The interpretation of protein structures: estimation of static accessibility. J Mol Biol 55: 379–400 [DOI] [PubMed] [Google Scholar]
- Lu XJ, Olson WK (2003) 3DNA: a software package for the analysis, rebuilding and visualization of three-dimensional nucleic acid structures. Nucleic Acids Res 31: 5108–5121 [DOI] [PMC free article] [PubMed] [Google Scholar]
- Lukacs CM, Kucera R, Schildkraut I, Aggarwal AK (2000) Understanding the immutability of restriction enzymes: crystal structure of BglII and its DNA substrate at 1.5 A resolution. Nat Struct Biol 7: 134–140 [DOI] [PubMed] [Google Scholar]
- Newman M, Lunnen K, Wilson G, Greci J, Schildkraut I, Phillips SE (1998) Crystal structure of restriction endonuclease BglI bound to its interrupted DNA recognition sequence. EMBO J 17: 5466–5476 [DOI] [PMC free article] [PubMed] [Google Scholar]
- Newman M, Strzelecka T, Dorner LF, Schildkraut I, Aggarwal AK (1994) Structure of restriction endonuclease BamHI and its relationship to EcoRI. Nature 368: 660–664 [DOI] [PubMed] [Google Scholar]
- Newman M, Strzelecka T, Dorner LF, Schildkraut I, Aggarwal AK (1995) Structure of Bam HI endonuclease bound to DNA: partial folding and unfolding on DNA binding. Science 269: 656–663 [DOI] [PubMed] [Google Scholar]
- Nobbs TJ, Halford SE (1995) DNA cleavage at two recognition sites by the SfiI restriction endonuclease: salt dependence of cis and trans interactions between distant DNA sites. J Mol Biol 252: 399–411 [DOI] [PubMed] [Google Scholar]
- Nobbs TJ, Szczelkun MD, Wentzell LM, Halford SE (1998a) DNA excision by the Sfi I restriction endonuclease. J Mol Biol 281: 419–432 [DOI] [PubMed] [Google Scholar]
- Nobbs TJ, Williams SA, Connolly BA, Halford SE (1998b) Phosphorothioate substrates for the SfiI restriction endonuclease. Biol Chem 379: 599–604 [PubMed] [Google Scholar]
- Osuna J, Flores H, Soberon X (1991) Combinatorial mutagenesis of three major groove-contacting residues of EcoRI: single and double amino acid replacements retaining methyltransferase-sensitive activities. Gene 106: 7–12 [DOI] [PubMed] [Google Scholar]
- Otwinowski Z, Schevitz RW, Zhang RG, Lawson CL, Joachimiak A, Marmorstein RQ, Luisi BF, Sigler PB (1988) Crystal structure of trp repressor/operator complex at atomic resolution. Nature 335: 321–329 [DOI] [PubMed] [Google Scholar]
- Pingoud A, Fuxreiter M, Pingoud V, Wende W (2005) Type II restriction endonucleases: structure and mechanism. Cell Mol Life Sci 62: 685–707 [DOI] [PMC free article] [PubMed] [Google Scholar]
- Qiang BQ, Schildkraut I (1984) A type II restriction endonuclease with an eight nucleotide specificity from Streptomyces fimbriatus. Nucleic Acids Res 12: 4507–4516 [DOI] [PMC free article] [PubMed] [Google Scholar]
- Reuter M, Kupper D, Meisel A, Schroeder C, Kruger DH (1998) Cooperative binding properties of restriction endonuclease EcoRII with DNA recognition sites. J Biol Chem 273: 8294–8300 [DOI] [PubMed] [Google Scholar]
- Roberts RJ, Halford SE (1993) Type II restriction endonucleases. In Nucleases, Roberts RJ (ed) Cold Spring Harbor, NY: Cold Spring Harbor Laboratory Press [Google Scholar]
- Roberts RJ, Vincze T, Posfai J, Macelis D (2005) REBASE—restriction enzymes and DNA methyltransferases. Nucleic Acids Res 33 (database issue): D230–D232 [DOI] [PMC free article] [PubMed] [Google Scholar]
- Szczelkun MD, Halford SE (1996) Recombination by resolvase to analyse DNA communications by the SfiI restriction endonuclease. EMBO J 15: 1460–1469 [PMC free article] [PubMed] [Google Scholar]
- Topal MD, Conrad M (1993) Changing endonuclease EcoRII Tyr308 to Phe abolishes cleavage but not recognition: possible homology with the Int-family of recombinases. Nucleic Acids Res 21: 2599–2603 [DOI] [PMC free article] [PubMed] [Google Scholar]
- Townson SA, Samuelson JC, Xu SY, Aggarwal AK (2005) Implications for switching restriction enzyme specificities from the structure of BstYI bound to a BglII DNA sequence. Structure (Cambridge) 13: 791–801 [DOI] [PubMed] [Google Scholar]
- Townson SA, Samuelson JC, Vanamee ES, Edwards TA, Escalante CR, Xu SY, Aggarwal AK (2004) Crystal structure of BstYI at 1.85A resolution: a thermophilic restriction endonuclease with overlapping specificities to BamHI and BglII. J Mol Biol 338: 725–733 [DOI] [PubMed] [Google Scholar]
- Travers AA (1991) DNA bending and kinking—sequence dependence and function. Curr Opin Struct Biol 1: 114–122 [Google Scholar]
- Vanamee ES, Aggarwal AK (2004) Metal-dependent type II restriction endonucleases. In Handbook of Metalloproteins, Cygler M (ed), Vol 3, pp 742–756. Chichester, UK: John Wiley and Sons, Ltd [Google Scholar]
- Vanamee ES, Santagata S, Aggarwal AK (2001) FokI requires two specific DNA sites for cleavage. J Mol Biol 309: 69–78 [DOI] [PubMed] [Google Scholar]
- Viadiu H, Aggarwal AK (1998) The role of metals in catalysis by the restriction endonuclease BamHI. Nat Struct Biol 5: 910–916 [DOI] [PubMed] [Google Scholar]
- Viadiu H, Vanamee ES, Jacobson EM, Schildkraut I, Aggarwal AK (2003) Crystallization of restriction endonuclease SfiI in complex with DNA. Acta Crystallogr D 59: 1493–1495 [DOI] [PubMed] [Google Scholar]
- Vologodskii A, Cozzarelli NR (1996) Effect of supercoiling on the juxtaposition and relative orientation of DNA sites. Biophys J 70: 2548–2556 [DOI] [PMC free article] [PubMed] [Google Scholar]
- Watson MA, Gowers DM, Halford SE (2000) Alternative geometries of DNA looping: an analysis using the SfiI endonuclease. J Mol Biol 298: 461–475 [DOI] [PubMed] [Google Scholar]
- Wentzell LM, Halford SE (1998) DNA looping by the Sfi I restriction endonuclease. J Mol Biol 281: 433–444 [DOI] [PubMed] [Google Scholar]
- Wentzell LM, Nobbs TJ, Halford SE (1995) The SfiI restriction endonuclease makes a four-strand DNA break at two copies of its recognition sequence. J Mol Biol 248: 581–595 [DOI] [PubMed] [Google Scholar]
- Wentzell LM, Oram M, Halford SE (1994) Purification and characterisation of the SfiI restriction endonuclease. Biochem Soc Trans 22: 302S. [DOI] [PubMed] [Google Scholar]
- Williams SA, Halford SE (2001) SfiI endonuclease activity is strongly influenced by the non-specific sequence in the middle of its recognition site. Nucleic Acids Res 29: 1476–1483 [DOI] [PMC free article] [PubMed] [Google Scholar]
- Williams SA, Halford SE (2002) Communications between catalytic sites in the protein–DNA synapse by the SfiI endonuclease. J Mol Biol 318: 387–394 [DOI] [PubMed] [Google Scholar]
- Winkler FK, Banner DW, Oefner C, Tsernoglou D, Brown RS, Heathman SP, Bryan RK, Martin PD, Petratos K, Wilson KS (1993) The crystal structure of EcoRV endonuclease and of its complexes with cognate and non-cognate DNA fragments. EMBO J 12: 1781–1795 [DOI] [PMC free article] [PubMed] [Google Scholar]
- Xu QS, Kucera RB, Roberts RJ, Guo HC (2004) An asymmetric complex of restriction endonuclease MspI on its palindromic DNA recognition site. Structure (Cambridge) 12: 1741–1747 [DOI] [PubMed] [Google Scholar]
- Yang Z, Horton JR, Maunus R, Wilson GG, Roberts RJ, Cheng X (2005) Structure of HinP1I endonuclease reveals a striking similarity to the monomeric restriction enzyme MspI. Nucleic Acids Res 33: 1892–1901 [DOI] [PMC free article] [PubMed] [Google Scholar]