

Abstract
The highly condensed chromosomes and chromosome breaks in mitotic cells of a Drosophila mutant, spotted-dick/pita, are the consequence of defects in DNA replication. Reduction of levels of Spotted-dick protein, by either RNAi or mutation, leads to the accumulation of cells that have DNA content intermediate to 2N and 4N in proliferating tissues and also compromises endoreduplication in larval salivary glands. The Spotted-dick Zinc-finger protein is present in the nuclei of cells committed to proliferation but necessary in cells undertaking S phase. We show that Spotted-dick/Pita functions as a transcription factor and that, in cultured S2 cells, it is an activator of expression of some 30 genes that include the Orc4 gene, required for initiation of DNA replication. Chromatin immunoprecipitation indicates that it associates with the genes that it activates in S2 cells together with other sites that could represent genes activated in other tissues. We discuss the role of Spotted-dick in the coordination of cellular growth and DNA replication.
Keywords: chromatin immunoprecipitation, endoreduplication, microarray, mitotis, S phase
Introduction
Although proper transcriptional regulation of the cell cycle is vital to the developmental programmes of metazoans, relatively little is known about the mechanisms that coordinate these processes. A core of conserved transcriptional regulators control expression of genes required for the G1 to S transition in metazoans. CDKs bound by cyclin D or E can phosphorylate the retinoblastoma protein (RB) resulting in its dissociation from E2F1-DP heterodimers and the replacement of transcriptional corepressors with coactivators in this complex. Thus, upon S phase entry, the transcription of genes regulated by E2F can be ‘switched on' (reviewed by Dyson, 1998). There are two known E2F genes in the Drosophila genome, E2F1 and E2F2. The product of the DP gene serves as a common binding partner for both (Dynlacht et al, 1994; Sawado et al, 1998b). Functional antagonism between E2F1 and E2F2 has been demonstrated (Frolov et al, 2001), although E2F2 appears not to be central to cell cycle control in normal somatic Drosophila cells (Cayirlioglu et al, 2001). Among the S phase genes regulated by E2F1 is Orc1, which encodes the largest subunit of the origin recognition complex (Asano & Wharton, 1999). The cell cycle regulatory genes cyclin E and string are also E2F1 targets (Duronio & O'Farrell, 1995; Neufeld et al, 1998).
It has been suggested that E2F1 may perform an important homeostatic role in maintaining cell cycle period in the face of mild perturbations, rather than simply being necessary for the expression of its target genes. A rise in CDK activity (CDK1 or CDK2) was seen to inhibit transcription of the E2F1 gene in the cells of the wing imaginal disc (Reis & Edgar, 2004). Thus, an increase in CDK2 accelerating progression through G1 would lead to a decrease in E2F1, a resulting decrease in string expression and a compensatory lengthening of G2.
In addition to the E2F family, another transcription factor, the Drosophila protein DREF, has been shown to regulate specific DNA replication genes. DREF binds to an 8 base pair palindromic ‘DNA replication-related element' (DRE) present in the regulatory regions of the genes encoding PCNA and DNA pol α (Hirose et al, 1993). DREF is coexpressed in proliferating larval cells expressing PCNA (Yamaguchi et al, 1995) and its ectopic expression was seen to induce DNA synthesis, as well as apoptosis and abnormal morphogenesis, in Drosophila eye imaginal discs (Hirose et al, 2001). One-third of genes upregulated in a proliferating population of eye imaginal disc cells have been shown to have a DRE within 1000 bp of their upstream DNA. By contrast, only one of 23 genes upregulated in a differentiating population of eye disc cells had such a sequence in its regulatory regions (Jasper et al, 2002). The DREF-mediated regulation of D-raf, e2f1 and Dm myb (Ryu et al, 1997; Sawado et al, 1998a; Sharkov et al, 2002) points further to its role in cellular proliferation. Moreover, the activation of cyclin A (Ohno et al, 1996) links DREF function to progression through both S phase and G2. Finally, the activation of the mitochondrial genes mtSSB (Ruiz de Mena et al, 2000) and D-mtTFA (Takata et al, 2001) provides a link between the transcriptional regulation of cellular proliferation and of organelle biogenesis.
Undoubtedly, further factors required for the transcriptional regulation of S phase remain to be discovered and the roles of known transcription factors are likely to be expanded to include aspects of S phase transcriptional regulation. Thus, for example, the proposed common regulatory factor for DNA replication and DREF genes is as yet unidentified (Hayashi et al, 1997), while Grainyhead exemplifies a specific transcription factor that is a positive regulator of mus209 (PCNA) transcription (Hayashi et al, 1999).
As mutants showing S phase defects in Drosophila also lead to subsequent characteristic mitotic abnormalities, we wondered whether transcriptional activators of S phase genes might be identified within a screen for such mutants. In this report, we show that the spotted-dick (spdk) gene, originally identified in a screen of second chromosomal P-element insertion mutants showing such mitotic phenotypes (Ohkura et al, 1995), encodes a transcriptional regulator of the crucial S phase gene Orc4. We demonstrate that expression of the Orc4 gene is dependent upon Spdk and that Spdk binds to the genomic DNA in the region of Orc4. We discuss a possible role for Spdk as a downstream effector of DREF function.
Results
Downregulation of spdk and not dcp-1 leads to aberrant mitosis
The spdk1 mutant (line Pk14408) was first identified in a screen of a collection of second chromosomal P-element insertions (Török et al, 1993) for mutants with a mitotic phenotype. The highly condensed mitotic chromosomes seen in mutants resembled pieces of fruit in the British puddings after which they were named. spdk1 mutant larvae developed melanotic tumours, had imaginal discs greatly reduced in size and failed to develop to the pupal stage. All of these aspects of the phenotype were reverted when the P-element was mobilised permitting us to use plasmid rescue as a means of mapping the insertion site of the P-element responsible for the mutation to within the coding region of the caspase gene dcp-1. Several other lines with P-elements inserted within this genomic region were identified of which two allelic mutants, spdk2 (P02121) and spdk3 (P08859), were selected for further analysis (Figure 1).
Figure 1.
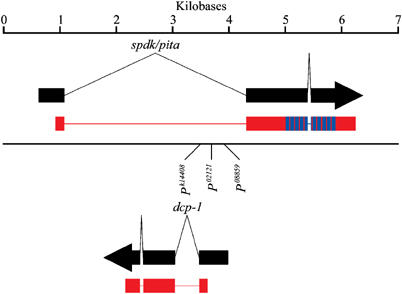
Arrangement of genes in the vicinity of spdk. Transcripts of spdk and dcp-1 are shown in black, with the predicted coding regions being shown in red. The 10 zinc-finger domains in the spdk-coding region are shown in blue. The insertion sites of the Pk14408 (spdk1), P02121 (spdk2) and P08859 (spdk3) P-elements within the genomic DNA are shown.
We found that the P-element insertions resulted in downregulation of transcripts from both the dcp-1 gene and a longer transcription unit within which dcp-1 is a cryptic gene. Thus, to determine which gene corresponded to spdk, we attempted to rescue spdk2 mutants using the UAS-GAL4 bipartite system to drive expression of cDNAs for either dcp-1 or its surrounding gene. Whereas we found that expression of dcp-1 cDNA failed to rescue the cell cycle phenotype, cDNA of the gene surrounding dcp-1 gave full rescue (Table I, see also Figures 3 and 4). Thus, the surrounding gene corresponds to spdk.
Table 1.
Summary of the brain squash data
| Oregon R | Rescueda spdk2 | spdk1 | spdk2 | spdk3 | spdk1/Dfb | spdk2/Dfb | spdk3/Dfb | |
|---|---|---|---|---|---|---|---|---|
| (A) | ||||||||
| Cells | 24 463 | 8208 | 8674 | 6560 | 7186 | 6038 | 6531 | 6815 |
| Prophase & prometaphase (%c) | 0.45 | 0.45 | 0.13 | 0.26 | 0.19 | 0.18 | 0.21 | 0.19 |
| Normal metaphased (%c) | 0.54 | 0.50 | 0.08 | 0.11 | 0.06 | 0.10 | 0.09 | 0.07 |
| Defective metaphase (%c) | 0 | 0.02 | 0.99 | 1.00 | 0.95 | 1.24 | 1.13 | 1.12 |
| Normal anaphase (%c) | 0.07 | 0.05 | 0 | 0 | 0 | 0 | 0 | 0 |
| Defective anaphase (%c) | 0 | 0 | 0.03 | 0.02 | 0.01 | 0.02 | 0.02 | 0 |
| Telophase (%c) | 0.11 | 0.19 | 0.01 | 0.02 | 0.01 | 0.02 | 0.02 | 0.03 |
| Mitotic indexe (%c) | 1.17 | 1.22 | 1.25 | 1.40 | 1.22 | 1.56 | 1.47 | 1.41 |
| Metaphase/anaphasef | 5.4 | 4.0 | 22.3 | 39.5 | 37.5 | 40.0 | 40.5 | 41.5 |
| (B) | ||||||||
| Defects | 0 | 2 | 89 | 67 | 69 | 76 | 75 | 76 |
| Irregular condensation (%g) | — | 0 | 24 | 25 | 33 | 24 | 19 | 21 |
| Premature separation (%g) | — | 0 | 7 | 7 | 7 | 4 | 5 | 7 |
| Over-condensation (%g) | — | 100 | 26 | 28 | 25 | 29 | 32 | 34 |
| Both separation & condensationh (%g) | — | 0 | 3 | 7 | 1 | 7 | 8 | 9 |
| Tangled chromatin (%g) | — | 0 | 15 | 9 | 13 | 14 | 11 | 8 |
| PCCi (%g) | — | 0 | 17 | 16 | 16 | 16 | 17 | 14 |
| Chromosome breaks (%g) | — | 0 | 6 | 4 | 3 | 5 | 7 | 7 |
| Defective anaphase (%g) |
— |
0 |
3 |
1 |
1 |
1 |
1 |
0 |
| aspdk2 mutants expressing the spdk cDNA. | ||||||||
| bDf(2R)bw5. | ||||||||
| cPercentages of the total number of cells counted for the different genotypes. | ||||||||
| dIncludes late prometaphase and true metaphase figures. | ||||||||
| eThe proportion of all mitotic cells, including defective figures, as a percentage of total cells. | ||||||||
| fThe total number of prophase, prometaphase, metaphase and defective metaphase-like figures divided by the total number of anaphase, telophase and defective anaphase figures. | ||||||||
| gPercentages of the total number of defective figures counted for the different genotypes. | ||||||||
| hCells that have irregularly condensed chromatin and prematurely separated sister chromatids. | ||||||||
| iPrematurely condensed chromatin. | ||||||||
Figure 3.
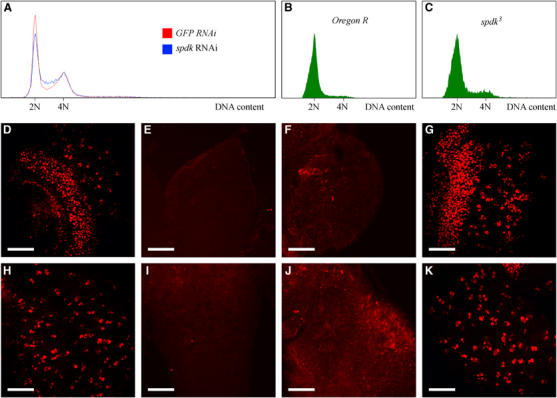
DNA replication defects in spdk mutant or RNAi cells. (A) Flow cytometric analysis of DNA content of propidium iodide stained S2 cells treated with GFP (control) dsRNA (red line) or spdk dsRNA (blue line). Note the elevated proportion of cells with DNA content intermediate to 2N and 4N DNA content following spdk RNAi. (B, C) Flow cytometric analysis of cells dissociated from wild type (B) and spdk3 mutant (C) larval brains and stained with Hoechst 33342. (D–G) Third instar larval brains immunostained to reveal incorporated BrdU (red). White scale bars represent 50 μm. (D) Wild-type optic lobe with distinct red punctae corresponding to nuclei that have incorporated BrdU. (E, F) Optic lobes from spdk2 and spdk3 mutants respectively that have been overexposed relative to panel D. (G) Optic lobe from an spdk2 mutant larva expressing the spdk cDNA. (H–K) Ventral ganglia from brains of the same genotypes as those shown in panels D–G respectively, treated similarly.
Figure 4.
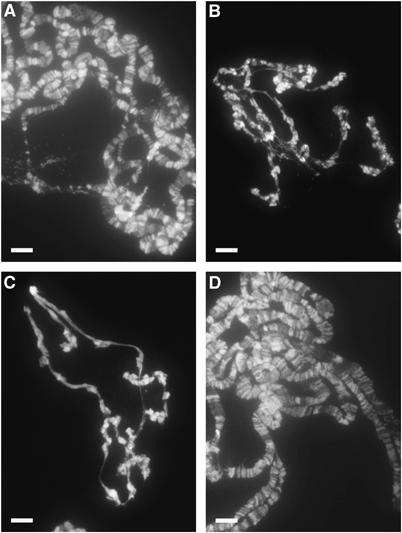
Endoreduplication is compromised in spdk mutants. DAPI stained polytene chromosomes from salivary glands of (A) wild type, (B) spdk1, (C) spdk2, and (D) spdk-cDNA-expressing spdk2 third instar larvae. White scale bars represent 100 μm.
P-element insertions in the dcp-1 gene, which encodes a caspase, have been previously described and associated with larval lethality and nurse cell death in germline clones (Song et al, 1997; McCall & Steller, 1998). While our present work was in progress, EMS mutants of the surrounding gene, which was termed pita by these workers, were identified as well as EMS mutants of dcp-1 only (Laundrie et al, 2003). In agreement with our findings, dcp-1 mutants were shown to be viable with no visible somatic phenotype while pita mutants were seen to have a similar gross phenotype to pita dcp-1 double mutants.
Mitotic defects of spdk neuroblasts
To gain an understanding of the potential effects of mutations in spdk/pita upon cell cycle progression, we first undertook a quantitative analysis of the mitotic defects shown in spdk mutant larval brains (Table I). We found the mitotic phenotypes displayed by the three spdk alleles to be very similar. Moreover, we observed no significant difference in the strength of the mitotic phenotype of either homozygous or hemizygous spdk mutants indicating that they are either very strong hypomorphic or amorphic mutants. We also showed that the mitotic defects were rescued in spdk2 homozygotes that were expressing the spdk cDNA transgene. Typically, spdk mitotic cells showed highly condensed chromosomes suggesting that cells had been delayed in mitosis for a prolonged period of time. However, the mitotic index showed no significant increase over that seen in wild-type cells. This suggested that defects in other phases of cell cycle progression may be preventing mitotic cells from accumulating. The defects seen in the mutant brains fell into several different classes (Table IB; Figure 2C–F). In addition to overcondensation of chromatin, we found mitotic figures could also show premature separation of sister chromatids, irregular chromatin condensation or chromosome breaks. Moreover, none of the anaphase figures observed in mutant brains were normal and showed overcondensation of chromatin, lagging chromosomes and chromosome bridges.
Figure 2.
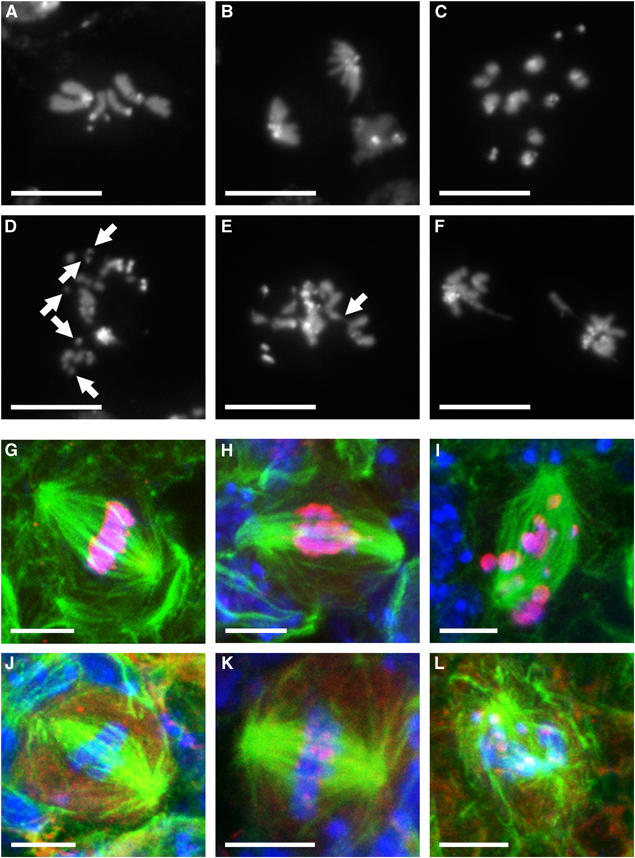
Mitotic defects in spdk cells. (A–F) DAPI-stained mitotic figures from third instar larval brains. White scale bars represent 10 μm. (A, B) Mitotic figures from squashed preparations of wild-type brains in metaphase and anaphase, respectively. (C) Metaphase-like figure with highly overcondensed chromosomes from an spdk1 mutant brain. Some pairs of sister chromatids appear to have undergone premature separation. (D, E) Metaphase-like figures from spdk2 mutant brains. The figure in (D) has overcondensed chromosomes and at least five small chromosome fragments (indicated by arrows), suggesting that a chromosome break has occurred. The figure in (E) has chromatin with a tangled appearance and a string of insufficiently condensed chromatin (indicated by the arrow). (F) Anaphase figure from an spdk3 mutant brain. A broken anaphase bridge can be seen. (G–I) Mitotic figures from whole mount preparations of third instar larval brains immunostained to reveal α-tubulin (green), phospho-histone H3 (red) and DNA (blue). White scale bars represent 5 μm. (G) Wild-type metaphase figure. (H) An spdk1 mutant metaphase-like figure with abnormal spindle structure and stretched chromatin. (I) An spdk2 mutant mitosis with highly overcondensed chromosomes scattered on a degenerating anastral spindle. (J–L) Mitotic figures from third instar larval brains immunostained to reveal α-tubulin (green), BubR1 (red) and DNA (blue). White scale bars represent 5 μm. (J) Wild-type metaphase or early anaphase figure that lacks BubR1 staining at the kinetochores. (K) An spdk1 mutant metaphase figure with strong BubR1 staining. (L) An spdk2 mutant mitosis with highly overcondensed chromosomes and collapsed spindle structure. BubR1 staining is again apparent.
To determine whether there were additional defects in the mitotic apparatus, we examined whole mount preparations of larval brains from homozygous spdk mutants immunostained to reveal microtubules and phospho-histone H3 as a marker of mitotic chromatin (Figure 2G–I). This revealed that 29% of all mitotic spindles in the spdk mutants (134 mitoses scored) had a seemingly normal metaphase-like morphology. In total, 48% of the figures observed had spindle microtubules of relatively normal metaphase-like appearance that were associated with hyper-condensed and mis-aligned chromosomes. Some 23% of mitotic cells had highly overcondensed chromosomes associated with what appeared to be disintegrating and frequently anastral spindles. A similar proportion of mitotic spindles (20%) also showed some degree of centrosome fragmentation at the poles when stained for either CP190 or γ-tubulin (Page, 2004).
To assess the state of the mitotic spindle integrity checkpoint, we stained whole mount preparations of spdk larval brains to reveal BubR1, known to localise to kinetochores that have not attached appropriately to the mitotic spindle (Basu et al, 1999). In wild-type brains, we only found BubR1 present at the kinetochores of mitotic figures at prophase and prometaphase together with a low proportion of metaphase figures. In contrast, all of the 100 spdk mutant figures that we scored had strong BubR1 staining at their kinetochores (Figure 2J–L). This suggests that chromosome alignment is either incorrectly established or maintained in spdk cells delayed in mitosis or that a BubR1-dependent mitotic DNA damage checkpoint pathway exists.
Downregulation of spdk slows the progression of diploid cells through S phase
The apparent delay of mitosis in the absence of an increase in mitotic index suggested that spdk mutant cells might have a decreased rate of proliferation through an effect on some other aspects of cell cycle progression. We first tested this idea by performing spdk RNAi on cultured S2 cells, which was shown to result in efficient knockdown of Spotted-dick by means of a Western blot (Figure 5A), and assessed the proportions of cells at different cell cycle phases by flow cytometry. We observed an increase in the proportion of cells with DNA content intermediate to 2N and 4N 5 days after the initial treatment (Figure 3A; Table IIA). This is characteristic of an increase in the proportion of cells in S phase. It was accompanied by a decrease in the rate of cell proliferation such that after 5 days the doubling time of spdk RNAi treated cells was on average 1.2 times that of the control cells.
Figure 5.
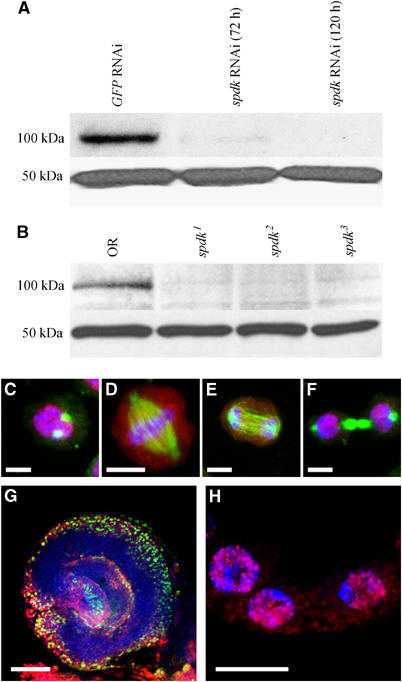
Spotted-dick protein is present in nuclei of proliferating cells. (A) Western blot with anti-Spdk serum (upper panel) indicating reduction in levels of the Spdk protein in spdk RNAi S2 cells compared to control GFP RNAi cells. Anti-Actin staining is used as a loading control (lower panel). (B) Western blot with anti-Spdk serum (upper panel) indicating reduction in levels of the Spdk protein in spdk mutant compared to wild-type larval brains. Anti-Actin staining is used as a loading control (lower panel). (C–F) S2 cells in (C) prophase, (D) metaphase, (E) anaphase and (F) cytokinesis that have been immunostained to reveal Spdk (red), α-tubulin (green) and DNA (blue). White scale bars represent 5 μm. (G) Optic lobe from a third instar larval brain incubated with BrdU for 15 min and immunostained to reveal Spdk (red), BrdU (green) and DNA (blue). White scale bar represents 50 μm. (H) Stage 10B follicle cells from a Drosophila ovary immunostained to reveal Spdk (red) and DNA (blue). White scale bar represents 10 μm.
Table 2.
Summary of the FACS cell cycle profile data for S2 cells treated with spdk or GFP dsRNA and for wild type and homozygous spdk mutant third instar larval brainsa
| |
G1 (%) |
S phase (%) |
G2 & mitosis (%) |
Polyploid (%) |
|---|---|---|---|---|
| (A) | ||||
| dsRNA used | ||||
| GFP | 45.9 | 19.3 | 19.3 | 6.2 |
| spdk | 34.4 | 43.6 | 14.5 | 7.5 |
| (B) | ||||
| Genotype | ||||
| Oregon R | 90.3 | 5.5 | 4.2 | — |
| spdk1 | 80.5 | 10.6 | 8.8 | — |
| spdk2 | 79.7 | 9.9 | 10.4 | — |
| spdk3 |
80.5 |
9.3 |
10.2 |
— |
| aCell cycle proportions calculated using Multicycle software. | ||||
We wished to determine whether spdk mutants also showed an increase in the proportions of cells at particular cell cycle stages. Flow cytometric approaches have been applied to analyse the cell cycle profile of cells dissociated from Drosophila imaginal discs (Neufeld et al, 1998). As imaginal discs fail to proliferate in spdk mutants, we adapted this approach to dissociate cells from third instar larval brains (Page, 2004). Whereas in wild-type brains, the proportions of cells in S phase or G2/M phases were very low (5.5 and 4.2% respectively; Figure 3B; Table IIB), brains from spdk larvae showed approximately two-fold greater proportions of apparently S phase and G2/M cells (Figure 3C; Table IIB). As the mitotic index was not significantly changed between wild type and mutant brains, we conclude that the increase in G2/M cells represents predominantly cells that are delayed in G2.
As a means of testing ongoing DNA replication in spdk mutants relative to wild type, we assessed the incorporation of the thymidine analogue, BrdU, into larval brains in short-term culture. We found that cells from the optic lobes and ventral ganglia from both wild-type larvae and spdk2 mutant larvae expressing spdk cDNA incorporated BrdU to a similar extent (Figure 3D, G, H and K). In contrast, incorporation of BrdU into spdk mutant brains was almost completely abolished compared to both wild type and rescued mutant brains (Figure 3E, F, I and J). This indicates that the replication of the genomic DNA is greatly perturbed by mutation of spdk during the course of development.
Endoreduplication of larval salivary gland chromosomes is perturbed by spdk mutations
We wished to determine whether DNA replication was also affected in endocycling tissues of spdk mutants. The chromosomes of wild-type Drosophila salivary glands undergo 9–10 rounds of endoreduplication to form large polytene chromosomes with ploidies of up to 1024N. The size of the polytene chromosomes acts as an indication of the extent of endoreduplication of DNA within these cells. When we stained salivary glands from wild type and spdk larvae with DAPI, we found that the spdk mutant salivary glands were very much smaller than wild-type glands and their polytene chromosomes appeared highly under-replicated and lacked the normal banding pattern (Figure 4). This phenotype was rescued in spdk2 mutants by expression of the spdk cDNA (Figure 4D). This suggests that mutations in spdk not only affect DNA replication in diploid but also polytene tissues.
Spdk localises to interphase nuclei of dividing cells but does not specifically colocalise with those undergoing S phase
We wished to determine whether the expression of Spdk protein correlated in any way with the onset of DNA replication. To this end we raised an antiserum against Spdk following its expression in bacterial cells. In Western blots we found that this antiserum would recognise a band of approximately 100 kDa from extracts of control S2 cells and wild-type larval brains that was absent or barely detectable in extracts of spdk RNAi S2 cells and spdk1, spdk2 or spdk3 mutant brains (Figure 5A and B). This not only demonstrates the specificity of the antiserum but also confirms the genetic observations that each of the spdk P-element insertions severely disrupts expression of the spdk gene.
When we used this antiserum to localise Spdk protein in cultured S2 cells, we found that the protein was present in all interphase nuclei. However, when combined with a short pulse of BrdU, we found no correlation between DNA replication, assessed by immunostaining to reveal incorporated BrdU, and either levels or subnuclear localisation of Spdk (Page, 2004). Mitotic S2 cells showed localisation of Spdk to prophase and telophase nuclei, with diffuse staining visible around the chromatin of metaphase and anaphase figures (Figure 5C–F). Similar patterns of localisation were seen in the mitotic cells of embryos and third instar larval brains (Page, 2004). Spdk staining identified the proliferating centres within the larval brain. However, when brains were allowed to incorporate BrdU, we found only partial overlap between Spdk localisation and BrdU incorporation, with Spdk always being seen in some proportion of cells with no BrdU staining (Figure 5G). This suggests that Spdk localises to proliferating cells within the larval brain, but that it is present for a more extensive time period than S phase alone.
The chorion gene loci of follicle cells are known to undergo amplification after stage 10B of oogenesis. During this time they undergo several rounds of DNA replication at four discrete loci to which proteins involved in the process of DNA replication are localised. We were not able to see any specific localisation of Spdk protein to these loci at any stage, but rather localisation of Spdk throughout the follicle cell nuclei (Figure 5H). This suggests that, although required for DNA replication, the Spdk protein is restricted neither temporally to S phase nor spatially to the punctate DNA replication ‘factories'.
Genes downregulated following spdk RNAi identify potential transcriptional targets
Laundrie et al (2003) have previously noted that Spdk/Pita is a 683 amino-acid protein with 10 C2H2 Zinc fingers and a potential acidic transactivation domain. Our current finding that Spdk is essential for DNA replication but not associated with replication punctae would be consistent with its having a role as a transcription factor. To determine whether Spdk might regulate the expression of one or more genes critical for DNA replication, we chose to downregulate spdk expression in cultured S2 cells and examine changes in gene expression by microarray analysis. Our choice of tissue culture cells was made in order to avoid monitoring secondary changes in transcription likely to result from developmental perturbations in tissues from mutant animals. We extracted RNA from three separate batches of spdk RNAi-treated cells and from three control groups in which cells underwent GFP RNAi. The results of this analysis are summarised in Table III, which includes all those genes that were expressed at a sufficient level and that showed statistically significant (P<0.01) greater than two-fold changes in expression.
Table 3.
Gene expression microarray data for S2 cells treated with either spdk or GFP (control) dsRNAa,b
| Flybase gene name | Expression M-valuec | Expression P-value | ChIP M-valued | ChIP Ranke | ChIP P-value |
|---|---|---|---|---|---|
| CG15715 | −6.2 | 1.77 × 10−06 | — | — | — |
| CG32446 | −4.6 | 6.03 × 10−06 | 1.86 | 116 | 6.68 × 10−03 |
| CG11671 | −4.5 | 2.20 × 10−06 | — | — | — |
| CG3703 | −4.2 | 1.36 × 10−03 | — | — | — |
| CG9216 | −4.0 | 1.09 × 10−05 | — | — | — |
| CG13707 | −4.0 | 5.60 × 10−03 | — | — | — |
| Orc4 | −4.0 | 1.59 × 10−04 | 1.95 | 97 | 9.25 × 10−03 |
| CG30086 | −3.6 | 3.50 × 10−06 | — | — | — |
| CG18528 | −3.4 | 4.03 × 10−05 | — | — | — |
| TfIIEα | −3.2 | 2.39 × 10−05 | 1.08 | 293 | 6.99 × 10−02 |
| CG7824 | −3.0 | 1.59 × 10−04 | — | — | — |
| Pita | −3.0 | 1.38 × 10−04 | 1.41 | 208 | 3.08 × 10−02 |
| scarface | −3.0 | 2.08 × 10−03 | 2.37 | 60 | 1.37 × 10−02 |
| CG14968 | −2.2 | 8.48 × 10−03 | — | — | — |
| mRpL1 | −2.1 | 2.15 × 10−06 | 2.04 | 89 | 5.77 × 10−03 |
| Gip | −1.9 | 2.08 × 10−04 | — | — | — |
| CG18081 | −1.8 | 2.04 × 10−03 | — | — | — |
| MtnA | −1.8 | 5.43 × 10−04 | — | — | — |
| CG30148 | −1.8 | 1.51 × 10−03 | — | — | — |
| CG4893 | −1.7 | 1.83 × 10−03 | — | — | — |
| CG5149 | −1.6 | 3.84 × 10−04 | 3.03 | 19 | 1.50 × 10−03 |
| CG9717 | −1.6 | 4.41 × 10−04 | — | — | — |
| CG16888 | −1.6 | 1.15 × 10−03 | — | — | — |
| C11.1 | −1.5 | 4.17 × 10−06 | 0.40 | 835 | 4.25 × 10−02 |
| CkIIα-i3 | −1.3 | 2.88 × 10−04 | 0.80 | 426 | 2.10 × 10−03 |
| CG8776 | −1.3 | 3.02 × 10−04 | 1.40 | 210 | 8.84 × 10−03 |
| Timp | −1.2 | 2.74 × 10−03 | −0.06 | 2295 | 5.50 × 10−01 |
| CG15092 | −1.2 | 1.62 × 10−03 | −0.48 | 4926 | 1.33 × 10−01 |
| CG8500 | −1.2 | 1.36 × 10−03 | — | — | — |
| CG3117 | −1.1 | 8.43 × 10−03 | — | — | — |
| CG14545 | −1.1 | 5.20 × 10−03 | — | — | — |
| CG18145 | −1.1 | 2.18 × 10−03 | — | — | — |
| CG14444 | −1.1 | 3.41 × 10−03 | 0.52 | 686 | 3.23 × 10−02 |
| R | 1.1 | 5.75 × 10−04 | −0.15 | 2825 | 7.57 × 10−01 |
| Kat80 | 1.1 | 3.34 × 10−03 | 1.82 | 125 | 1.86 × 10−02 |
| CG14795 | 1.1 | 6.19 × 10−04 | — | — | — |
| CG16876 | 1.4 | 5.94 × 10−03 | — | — | — |
| CG17681 | 1.8 | 4.87 × 10−04 | — | — | — |
| CG7900 | 1.9 | 1.19 × 10−04 | — | — | — |
| RpS10a | 2.0 | 1.96 × 10−03 | −0.02 | 2052 | 8.37 × 10−01 |
| Pxn | 2.0 | 2.70 × 10−03 | −0.36 | 4410 | 1.66 × 10−01 |
| CG3085 | 3.4 | 1.03 × 10−03 | 0.27 | 1055 | 7.47 × 10−02 |
|
CG15434 |
8.6 |
6.01 × 10−05 |
— |
— |
— |
| aGenes listed show at least a two-fold change in average renormalized signal between control and experimental samples (P<0.01). In addition, genes for which neither experimental nor control average renormalized signals were at least 25 were excluded to ensure that changes are not simply caused by low expression levels. | |||||
| bUnderlined text indicates those genes with significant changes in expression level and that are significantly enriched by anti-Spdk ChIP. | |||||
| clog[2] of the average renormalized experimental (spdk RNAi) signal over the average renormalized control (GFP RNAi) value. Thus, a negative number shows reduced expression in the experimental sample relative to the control. | |||||
| dlog[2] of the average renormalized experimental (anti-spdk ChIP) signal over the average renormalized control (prebleed ChIP) value. Thus, a positive number shows enrichment of the DNA in the experimental sample relative to the control. | |||||
| eThe rank of the ChIP value in the list of all cDNAs tested (a total of nearly 5400) from highest to lowest value. | |||||
We found that 33 genes showed consistent downregulation and 10 genes were significantly upregulated. Reassuringly, we found spdk/pita among the downregulated genes, suggesting that the RNAi treatment was effective. Of the other downregulated genes, 23 have essentially never been characterised and are named through ‘CG' designations assigned by the genome sequencing project. Similarly, little is known of the functions of scarface, mutants of which have distorted mouthparts, and of c11.1, mutants of which have no visible phenotype. One of the downregulated genes of known function is Orc4, which encodes a conserved member of the Origin Recognition Complex. Downregulation of Orc4 would be expected to lead to cell cycle phenotypes as seen in the spdk mutants. The gene Gip, also downregulated, encodes a protein inferred to have endonuclease activity that might also have a role in DNA metabolism, while two other downregulated genes, MtnA and mRpL1, encode a metallothionein and a protein of the large mitochondrial ribosome subunit, respectively. Further genes downregulated include CKIIα-i3, which encodes a protein that interacts with Casein Kinase II, and Timp, which encodes an inhibitor of metalloproteinases and thus may be involved in the regulation of cellular adhesion. Finally, the gene for the general transcription factor TfIIEα was also downregulated.
To confirm that levels of Orc4 RNA were substantially reduced both in mutant versus wild-type larval brains and in spdk RNAi versus GFP RNAi treated S2 cells, we assessed its mRNA levels by RT–PCR. To provide controls, we also assessed levels of the housekeeping gene Actin 5C, as a gene expected to be irrelevant to DNA replication, and mus209, as a gene required for S phase progression but not shown by the microarray analysis to be regulated by Spdk (Figure 6A). Whereas Orc4 transcripts were severely depleted in spdk mutant extracts and spdk dsRNA-treated S2 cells, neither mus209 nor Actin 5C showed changes in expression levels.
Figure 6.
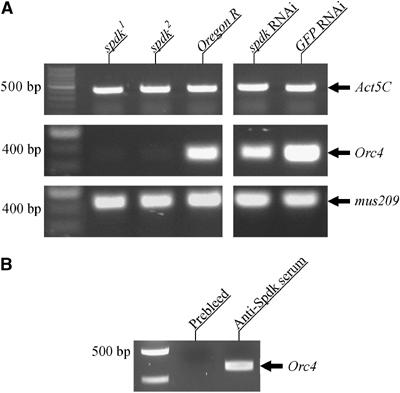
Spotted-dick binds to DNA upstream of the Orc4 gene and is required for its transcription. (A) Agarose gels showing RT–PCR amplified fragments from extracts of wild type and mutant larvae and S2 cells treated with either GFP or spdk dsRNA. The genes from which transcripts have been amplified are indicated. 100 bp ladders are shown in the leftmost lanes for each gel. (B) Agarose gels showing PCR products from chromatin immunoprecipitions with either anti-Spdk serum or its prebleed. The region amplified was upstream from the Orc4 gene. A 100 bp ladder is shown in the left lane.
As a Zinc-finger protein, Spdk might be expected to bind upstream of the genes it regulates. To test this we carried out chromatin immunoprecipitation (ChIP) with the anti-Spdk serum and assessed whether the precipitated chromatin fragments (average length approximately 500 bp) would identify genes in a custom array of 5372 full-length cDNA clones from the Drosophila Gene Collection V1.0 (representing 5073 genes). Of the 33 genes identified as being downregulated in the above experiment, 13 were represented on this microarray. Of these, six genes showed statistically significant (P<0.01) average renormalised intensity ratios that were greater than 1.6 (M>0.68) (Table III). In conjunction with the statistical criterion, a threshold for average renormalised intensity ratio of 1.6 had been found to give no false positives by Birch-Machin et al (2005) in their study using this technique with Heat Shock Factor antisera. Of the other represented genes, TfIIEα, scarface and spdk/pita showed high levels of enrichment of their chromatin in the anti-Spdk ChIP sample but these did not show the required level of statistical significance. Given that TfIIEα and scarface transcripts are depleted in the absence of Spdk, it seems likely that Spdk does indeed bind to their regulatory regions. It is also possible that Spdk directly regulates its own transcription. Thus, it might be expected that, of all of the genes identified as being downregulated in S2 cells as a result of Spdk depletion, roughly 15–23 would show detectable binding by this method with full genome coverage. In contrast, none of those genes seen to be upregulated as a result of Spdk depletion showed statistically significant enrichment of their DNA in the Spdk ChIP sample.
The results of the ChIP experiment suggest that Spdk interacts with genomic regions associated with at least 144 genes represented on the custom microarray in embryos (see Supplementary Table I). If extended to the whole genome, it might be expected that of the order of 350 Spdk binding sites in the proximity of coding regions exist. Indeed, immunolocalisation of Spdk on larval salivary gland polytene chromosomes also suggested the existence of a large number of genomic binding sites (Page, 2004). In total, we have identified between six and 10 genes that have their DNA bound by Spdk and undergo significant changes in their expression levels in S2 cells on treatment with spdk dsRNA. Thus, we conclude that only a fraction (approximately 4–7%) of genes associated with regions able to bind Spdk are under its strong positive control in S2 cells. Orc4 is one such gene both downregulated by depletion of Spdk and with sequences able to bind to Spdk as indicated by ChIP. We were able to confirm the binding of Spdk to chromatin in the vicinity of the Orc4 gene by PCR amplification of sequences upstream from the Orc4 gene in the Spdk ChIP sample (Figure 6B).
It should be noted that it is not possible to use the ChIP microarray data to draw quantitative conclusions. The reasons for this are discussed by Birch-Machin et al (2005). Thus, a list of the genes showing the highest levels of statistically significant enrichment of their DNA in the Spdk ChIP sample, as in Table IV, contains those binding sites that are least likely to be false positives. For a comprehensive list of genes showing significant enrichment in the Spdk ChIP sample, see Supplementary Table I. Among the genes bound but seemingly not regulated by Spdk in S2 cells are genes implicated in the regulation of cell proliferation, the cell cycle, transcription and ubiquitinylation. These genes include dref, Ras85D, Rca1, CLIP-190, nod, Jra, NFAT and Ubc-E2H. It is possible that Spdk plays a role in the regulation of these genes in other tissue types.
Table 4.
ChIP microarray data for DNA immunoprecipitated with either anti-Spdk serum or its prebleeda,b,c
| Flybase gene name | ChIP M-value | ChIP P-value | Expression M-value | Expression P-value |
|---|---|---|---|---|
| CG2121 | 4.58 | 1.98 × 10−03 | 0.60 | 4.00 × 10−01 |
| Ufd1-like | 4.37 | 1.06 × 10−03 | 0.10 | 5.13 × 10−01 |
| CG5646 | 4.22 | 7.21 × 10−04 | 0.56 | 3.09 × 10−01 |
| CG33008 | 3.74 | 4.15 × 10−03 | 0.05 | 8.61 × 10−01 |
| Rca1 | 3.65 | 6.11 × 10−03 | −0.10 | 4.50 × 10−01 |
| CG32810 | 3.64 | 2.41 × 10−03 | −0.04 | 6.92 × 10−01 |
| CG9723 | 3.46 | 2.09 × 10−03 | 0.37 | 7.19 × 10−03 |
| l(1)G0022 | 3.44 | 3.06 × 10−03 | 0.03 | 5.70 × 10−01 |
| klar | 3.32 | 1.68 × 10−03 | −0.13 | 4.46 × 10−01 |
| Amph | 3.32 | 6.21 × 10−05 | 0.03 | 8.32 × 10−01 |
| l(1)G0269 | 3.30 | 2.46 × 10−03 | −0.11 | 1.63 × 10−01 |
| gnu | 3.29 | 3.27 × 10−03 | −0.15 | 8.31 × 10−01 |
| skpA | 3.26 | 1.08 × 10−03 | −0.08 | 2.20 × 10−01 |
| ctp | 3.19 | 9.05 × 10−04 | −0.09 | 5.61 × 10−02 |
| CG6393 | 3.15 | 2.53 × 10−03 | −0.16 | 1.07 × 10−01 |
| MTF-1 | 3.11 | 3.44 × 10−03 | −0.03 | 3.65 × 10−01 |
| CG12026 | 3.04 | 3.52 × 10−03 | −0.61 | 5.08 × 10−01 |
| CG5149 | 3.03 | 1.50 × 10−03 | −1.62 | 3.84 × 10−04 |
| CG14005 | 3.03 | 4.33 × 10−03 | −0.70 | 2.04 × 10−02 |
| Jra | 3.02 | 3.72 × 10−04 | −0.11 | 1.20 × 10−01 |
| phl | 3.01 | 6.12 × 10−03 | 0.11 | 2.57 × 10−01 |
| unk | 2.99 | 5.08 × 10−03 | −0.42 | 6.48 × 10−02 |
| CG6234 | 2.99 | 4.40 × 10−03 | 0.09 | 9.48 × 10−01 |
| L(2)gl | 2.96 | 4.16 × 10−03 | −0.16 | 3.09 × 10−01 |
| CG6412 | 2.95 | 4.60 × 10−03 | 0.08 | 2.08 × 10−01 |
| mthl8 | 2.95 | 6.42 × 10−03 | 0.39 | 6.26 × 10−01 |
| CG32536 | 2.91 | 4.27 × 10−03 | 0.13 | 5.02 × 10−01 |
| CLIP-190 | 2.90 | 6.48 × 10−04 | 0.11 | 4.65 × 10−01 |
| FKBP59 | 2.90 | 6.94 × 10−03 | 0.18 | 8.99 × 10−02 |
| CG3038 | 2.88 | 8.82 × 10−04 | 0.90 | 1.72 × 10−03 |
| CG2091 | 2.85 | 4.03 × 10−03 | 0.10 | 2.38 × 10−01 |
| RpL17 | 2.85 | 2.73 × 10−03 | 0.15 | 2.22 × 10−01 |
| Prosap | 2.84 | 4.72 × 10−03 | −0.17 | 3.61 × 10−02 |
| CG7668 | 2.77 | 4.88 × 10−03 | −0.05 | 5.10 × 10−01 |
| CG3918 | 2.77 | 4.69 × 10−03 | 0.04 | 6.97 × 10−01 |
| CG10602 | 2.76 | 9.55 × 10−03 | 0.05 | 4.29 × 10−01 |
| CG9448 | 2.74 | 4.81 × 10−03 | −0.19 | 2.32 × 10−01 |
| CG11586 | 2.70 | 3.51 × 10−03 | 0.06 | 6.90 × 10−01 |
| CG6693 | 2.64 | 2.08 × 10−03 | 0.07 | 7.14 × 10−01 |
| Ubc-E2H | 2.63 | 3.55 × 10−04 | −0.16 | 1.03 × 10−01 |
| CG1745 | 2.61 | 2.43 × 10−03 | 0.14 | 4.13 × 10−01 |
|
nod |
2.59 |
5.47 × 10−03 |
0.77 |
1.84 × 10−02 |
| aGenes listed show at least a six-fold change in average renormalized signal between control and experimental samples (P<0.01). | ||||
| bUnderlined text indicates those genes with significant changes in expression level and that are significantly enriched by anti-Spdk ChIP. | ||||
| cColumn headings have the same meanings as in Table III. | ||||
Expression of the Orc4 cDNA recues the cell cycle phenotype of DMEL cells treated with spdk dsRNA
Several potentially important transcriptional targets of Spdk, including Orc4, TFIIEα and mRpL1, were identified using the combination of expression microarray and ChIP experiments described above. In an attempt to demonstrate the importance of these targets in the phenotype of cells with reduced levels of Spdk, DMEL cells were transiently transfected with constructs that caused expression of cDNAs of these genes from an Spdk-independent promoter. Such cells were then treated with spdk dsRNA and their cell cycle phenotypes were assayed by flow cytometry 5 days after spdk RNAi. DMEL cells were used as they grow in serum-free medium, enabling transfection to occur at higher efficiency.
Expression of neither TFIIEα nor mRpL1 was seen to rescue the cell cycle phenotype of spdk dsRNA-treated cells. However, expression of Orc4 rescued the phenotype such that the cell cycle profile was indistinguishable from that of control cells. These data are summarised in Table V.
Table 5.
Summary of the FACS cell cycle profile data for DMEL cells expressing various cDNAs and treated with spdk dsRNAa
| dsRNA used | cDNA expressed | G1 (%) | S phase (%) | G2 & mitosis (%) |
|---|---|---|---|---|
| GFP | — | 16.6 | 11.6 | 71.8 |
| spdk | — | 15.2 | 17.5 | 67.3 |
| spdk | Orc4 | 16.1 | 11.9 | 72.0 |
| spdk | TFIIEα | 16.6 | 16.6 | 66.8 |
|
spdk |
mRpL1 |
15.4 |
17.1 |
67.6 |
| aCell cycle proportions calculated using Multicycle Software. | ||||
Discussion
Here we have identified the gene affected in spdk mutants and shown it to correspond to a gene that Laundrie et al (2003) subsequently called pita. Although the gene surrounds the dcp-1 caspase gene that is also downregulated by P-element insertions affecting spdk/pita, we show that all of the mitotic and S phase phenotypes characteristic of spdk mutations can be rescued by expression of the spdk cDNA. We show that, consistent with the presence of 10 C2H2 Zn fingers in the Spdk protein, it is required to regulate the expression of a number of genes in S2 cells including Orc4, a gene essential for DNA replication.
The mitotic phenotype of spdk mutants bears a striking resemblance to the mitotic phenotype described for other Drosophila DNA replication mutants. Thus, Orc2, Orc5, mus209 and mcm4 all show delayed metaphases with a variety of abnormal figures similar to those found in spdk mutants (Pflumm & Botchan, 2001). As our analysis of BrdU incorporation in combination with flow cytometry pointed to the perturbation of DNA replication in spdk mutants, this mitotic phenotype is likely to be secondary to the DNA replication phenotype. The increase in G2/M cells coupled with a normal mitotic index suggests that the replication defects result in a G2 delay and thus point to the presence of such a checkpoint in larval neuroblasts. Those cells that escape this checkpoint appear to be delayed in mitosis as a result of activation of a checkpoint related to the spindle integrity checkpoint, as indicated by the presence of BubR1 on metaphase chromosomes. It should be noted that the mitotic index rises in older spdk mutant third instar larvae, with some brains showing a mitotic index higher than 15% (Page, 2004), presumably as G2/M checkpoint adaptation results in more cells delayed by this mitotic checkpoint. Thus, the raised mitotic index of some Drosophila DNA replication mutants is not inconsistent with the phenotype of spdk mutants.
The failure to incorporate BrdU together with the increase in cells of DNA content intermediate to 2N and 4N, seen both in spdk mutant brains and following spdk RNAi in S2 cells, suggest that some cells can enter S phase but are very slow to, or become unable to, complete it presumably through reduced origin activity as a result of low levels of Orc4. The failure of larval salivary gland polytene chromosome endoreduplication in spdk mutants indicates that DNA replication also fails in endocycling tissues. In their study of pita mutant germline clones, Laundrie et al (2003) observed defects in the development of egg chambers (degeneration, abnormal or absent nurse cell nuclei followed by cell death). These can be explained by a failure in the division cycles of the germarium or a failure of endoreduplication cycles of nurse cells. Although the Spdk protein is found in nuclei of the proliferating or endoreduplicating cell types, its localisation suggests it is not directly involved in DNA replication as it is not found at replication punctae in either diploid S2 cells or the polyploid ovarian follicle cells. Thus, a role for Spdk/Pita in the regulation of transcription as originally suggested by Laundrie et al (2003) seems more probable. Indeed, our present data suggest that at least one of the genes activated by Spdk is absolutely required for passage through S phase.
Microarray analysis suggests that a relatively small number of genes are regulated by Spdk in S2 cells. Of these, 33 are downregulated upon reduction of Spdk levels and 10 are upregulated. ChIP suggests that, in contrast to the upregulated genes, most of those downregulated (6–9 of 13 represented) are likely to have Spdk binding sites in their flanking chromatin. This suggests that most of those genes significantly downregulated by reduction of Spdk are directly regulated by Spdk through its binding to regulatory regions to presumably activate transcription. However, the majority of significantly upregulated genes are likely not to be direct targets of Spdk-mediated repression. Despite the apparently small number of Spdk target genes in S2 cells, both precipitation of chromatin with anti-Spdk serum and the immunolocalisation of Spdk on polytene chromosomes of larval salivary glands point to its having a large number of genomic binding sites. It is possible that the majority of Spdk binding sites have relatively little or no effect on the transcription of nearby genes and so only subtle changes in the transcription of such genes would result from Spdk depletion. Alternatively, these binding sites may only be important in specific developmental or physiological contexts. If this were the case, expression studies in a range of tissue types, rather than just in S2 cells, may reveal regulation of a larger number of genes by Spdk.
Of the known putative target genes we identified to be activated by Spdk, perhaps the most interesting are Orc4, TFIIEα and mRpL1. Not only has Spdk been shown to be likely to bind to chromatin in the region of these genes, but their expression was also greatly reduced following downregulation of spdk by mutation or RNAi. This suggests that Spdk may act as a factor that promotes cellular proliferation, by activating expression of Orc4, while also activating cellular and mitochondrial growth, by activation of TFIIEα and mRpL1, respectively. By analogy with the cyclin D-Cdk4-mediated regulation of mRpL12, the Spdk-mediated activation of mRpL1 transcription may be important in the activation of cellular growth as well as mitochondrial biogenesis (Frei et al, 2005). Given that Orc4 mRNA levels are extremely low in spdk mutants, and that expression of Orc4 in spdk dsRNA-treated DMEL cells can rescue their cell cycle defects, it seems likely that the cell cycle phenotype of spdk mutants is caused by a lack of Orc4 protein. However, we cannot rule out that other proteins required for DNA replication are also depleted in these mutants.
To date, DREF and E2F1 are the principal Drosophila transcription factors known to be important in regulating G1 and S phases. Examination of the genomic DNA flanking spdk revealed one perfect match for the Drosophila DNA replication-related element (DRE) 54–61 base pairs upstream from the putative transcription start site. As Spdk is expressed in proliferating cells, it seems likely that transcriptional regulation by DREF alone, or in combination with autoregulation by Spdk (as suggested by its own precipitation by anti-Spdk ChIP), could explain the expression pattern of spdk. This would place Spdk as a probable downstream effector of DREF-mediated transcriptional regulation. Given that DREF has been implicated in the activation of cell proliferation and its coordination with mitochondrial growth (Ruiz de Mena et al, 2000; Takata et al, 2001), the identified targets of Spdk fit well with this role. Intriguingly, we have shown that Spdk may also bind to the regulatory regions of dref. This may enable mutual regulation of Spdk and DREF, although this is highly speculative. It will be of future interest to see how the expression of other genes activated by Spdk might contribute to the coordination of cell proliferation with S phase progression.
As many of the factors involved in the transcriptional regulation of the cell cycle are conserved, it seems likely that Spdk might have its counterpart in human cells as, for example, does DREF (Ohshima et al, 2003). Anopheles gambiae has a clear orthologue of spdk, XP319587, which shares 45% identity with residues 225–506 of Spdk with homology extending beyond this most conserved region. A similar region of Spdk shares 41% identity with a region of Human Zinc-Finger Protein 155. However, given that the gene that encodes this protein is a member of a cluster of paralogous genes (Shannon et al, 2003), future work will be necessary to downregulate each of these genes to identify a functional orthologue of Spdk.
Materials and methods
Genetic characterisation of the spdk mutants
The P-lacW insertion Pk14408 generated by Török et al (1993) and the PZ insertion P02121 are described in Flybase (http://flybase.bio.indiana.edu/). The PZ insertion P08859 is described by Laundrie et al (2003). Df(2R)bw5 is also described in Flybase. Mutant stocks were kept balanced over T(2;3)TSTL, CyO:TM6B, Tb1. The mitotic screen that identified spdk was described by Ohkura et al (1997). Plasmid rescue was as described by Pirrotta (1986). Using this method, Pk14408, P02121 and P08859 were shown to be inserted 106–113 bp downstream, 62 bp upstream and 297 bp upstream of the translation start site of dcp-1 respectively.
Reversion was carried out by crossing individual jumpstarter males of the genotype w1118;spdk1/CyO, H[w+mC=PΔ2–3]HoP2.1 to females of the genotype w1118;Sco/CyO. Single white-eyed males from this cross with remobilised spdk1 chromosomes balanced over CyO were collected and crossed back to mutant females from the original stock. In this manner, it was possible to score reversion and set up stocks balanced over T(2;3)TSTL, CyO:TM6B, Tb1.
The dcp-1 cDNA rescue construct was made by digesting the LD10653 cDNA clone with NotI and XhoI. The insert was cloned into similarly digested pP[UAST] DNA. The spdk cDNA rescue construct was made by digesting the LD15650 cDNA clone with NotI and KpnI. The insert was cloned into similarly digested pP[UAST] DNA. Transformation of w1118 flies with these constructs was performed using standard methods. Third or X chromosomal inserts of rescue constructs were crossed into spdk2 mutant backgrounds. A variety of different driver lines were used to attempt rescue of the mutant phenotype. However, leaky expression of the spdk cDNA in the absence of a GAL4 driver in one particular insertion line was found to give best rescue of the mutant phenotype.
Generation of Spdk antisera and Western blot analysis
Spdk antisera were generated in rabbits against a C-terminal fragment of the protein (the final 125 amino acids) fused to an N-terminal 6 × His tag that was purified on a Ni-NTA column. Two rabbits were injected with the protein and Spdk antisera were produced. One of these antisera showed reactivity to native Spdk. It was used at a concentration of 1:1500 for Western blotting and 1:100 for immunostaining. Samples for Western blot analysis were produced by homogenising larval brains or S2 cells in Laemmli buffer. The homogenate was boiled for 10 min, frozen, boiled for a further 5 min and centrifuged for 1 min in a desktop centrifuge. Supernatants from these samples were then loaded on 10% acrylamide gels and transferred onto PVDF membranes. Loading controls were performed using rabbit anti-Actin antibody (Sigma-Aldrich) at a dilution of 1:100.
Immunofluorescence
Brain squash analyses were performed as described by Pflumm & Botchan (2001) except that DAPI staining was achieved by mounting samples in Vectashield containing DAPI (Vector Laboratories).
Brain immunostaining was performed as described by Donaldson et al (2001), except that Triton X-100 was used instead of Tween-20. DNA was stained by incubation in 2 μM TOTO-3 iodide (Molecular Probes) in PBS for 1 h. The following antibodies were used as previously described: rabbit antiphospho-histone H3 (Upstate); anti-α-tubulin YL1/2 (Sigma-Aldrich); rabbit anti-Bub1 (Basu et al, 1999); anti-BrdU BU-33 (Sigma-Aldrich); appropriate Alexa-conjugated secondary antibodies (Molecular Probes).
BrdU incorporation analysis in larval brains was performed as described by Pflumm & Botchan (2001). Brains were then immunostained to reveal BrdU as usual except that, after fixation, chromatin was denatured by soaking brains in 2 M HCl for 30 min and then brains were neutralised by soaking in 0.1 M sodium tetraborate for 2 min.
Larval salivary glands were squashed similarly to larval brains and then mounted in Vectashield containing DAPI (Vector Laboratories).
Ovarian follicle cells were immunostained as described by Royzman et al (1999), while embryos were immunostained as described by Riparbelli et al (2000).
Fluorescence microscopy was performed using a Zeiss Axiovert 200 microscope with a × 63 objective (N.A.=1.4). Images were captured with a CoolSNAP HQ CCD camera (PhotoMetrics) using MetaMorph software (Universal Imaging Corporation). Confocal microscopy was performed using a 1024 confocal microscope (Bio-Rad Laboratories).
Tissue culture methods
S2 cells (∼2 × 10⁶) were transfected with 50 μg dsRNA as described by D'Avino et al (2004) except that the transfection was repeated after 48 h. The following primers were used to produce the spdk dsRNA:
5′-TAATACGACTCACTATAGGGAGACCCTCCTGC GCCAGTATCCGCTCACGGGTAACT
5′-TAATACGACTCACTATAGGGAGACTGCGCGAG CGAGTGTGATTCAGCCGATGGAT.
FACS was performed as described by D'Avino et al (2004) with the data presented here being averaged from 15 replicates, each of 30 000 events. Analysis was performed 5 days after transfection.
Transient transfection of DMEL cells (∼2 × 10⁶) with cDNA expression constructs (5 μg) was performed using Cellfectin (Invitrogen) in accordance with the manufacturer's instructions. RNAi was performed 24 h after DNA transfection. Expression of full-length cDNAs was driven by the actin 5C promoter. Control cells were transfected with the expression construct lacking any cDNA. Such experiments were performed in triplicate.
FACS cell cycle analysis of cells dissociated from larval brains
The protocol used was adapted from that used for FACS of cells dissociated from wing imaginal discs (Neufeld et al, 1998). In total, 15 brains were dissected and pooled in 0.5 ml of the staining solution described by Neufeld et al (1998), modified to use Hoechst 33342 at 10 μg/ml. The brains were incubated for 3 h with occasional agitation, after which cells were filtered through a plastic mesh to remove large particles and the strained material was placed in a FACS tube (Falcon). Propidium iodide was added to a final concentration of 2.5 μg/ml and the cells were incubated for 5 min prior to analysis. FACS was performed using an LSR cytometer (Becton Dickinson). The excitatory wavelengths were 488 nm (PI) and 325 nm (Hoechst 33342). In total, 20 000 events were measured per sample and analysis and gating was performed using Summit software (DakoCytomation). Gating of data was necessary to remove dead cells (PI positive), cell doublets (high pulse width) and cellular debris/yeast (significantly lower Hoechst 33 342 fluorescence and forward scatter than G1 cells). The number of events after gating was ∼14 000 for wild-type brains and ∼7500 for each of the mutant lines.
Gene expression analysis and ChIP
Total RNA samples were extracted from cells and larvae using the RNeasy kit (Qiagen) with an on column DNAse step. RT–PCR reactions were performed using the SuperScript III one-step RT–PCR kit (Invitrogen). Samples of each reaction were taken after 20, 25, 30, 35 and 40 cycles to ensure that reactions had not reached their end point at the time of analysis. In total, 10 μl of each sample was run on a 1% agarose gel and bands were quantified using a ChemiDoc transilluminator (Bio-Rad) and Quantity One software. Gene expression microarrays were performed by the UK Drosophila Affymetrix Array Facility.
ChIP was performed as described by Birch-Machin et al (2005).
P-values for both expression and ChIP microarray data were calculated using Cyber-T software (Baldi & Long, 2001; http://visitor.ics.uci.edu/genex/cybert/).
Supplementary Material
Supplementary Table I
Acknowledgments
We wish to thank Dr M Page for her comments on the manuscript. The Cancer Research Campaign, more recently Cancer Research UK supported the work throughout this project's duration. We also thank Fundação para a Ciência e a Tecnologia (Portugal) for support to RG. Gene expression analysis was possible through FlyChip, a BBSRC funded project to provide a nonprofit microarray resource for the UK Drosophila research community, and was performed by Dr J Wang.
References
- Asano M, Wharton RP (1999) E2F mediates developmental and cell cycle regulation of ORC1 in Drosophila. EMBO J 18: 2435–2448 [DOI] [PMC free article] [PubMed] [Google Scholar]
- Baldi P, Long AD (2001) A Bayesian framework for the analysis of microarray expression data: regularized t-test and statistical inferences of gene changes. Bioinformatics 17: 509–519 [DOI] [PubMed] [Google Scholar]
- Basu J, Bousbaa H, Logarinho E, Li Z, Williams BC, Lopes C, Sunkel CE, Goldberg ML (1999) Mutations in the essential spindle checkpoint gene bub1 cause chromosome missegregation and fail to block apoptosis in Drosophila. J Cell Biol 146: 13–28 [DOI] [PMC free article] [PubMed] [Google Scholar]
- Birch-Machin I, Gao S, Huen D, McGirr R, White RAH, Russell S (2005) Genomic analysis of heat shock factor targets in Drosophila. Genome Biol 6: R63. [DOI] [PMC free article] [PubMed] [Google Scholar]
- Cayirlioglu P, Bonnette PC, Dickson MR, Duronio RJ (2001) Drosophila E2f2 promotes the conversion from genomic DNA replication to gene amplification in ovarian follicle cells. Development 128: 5085–5098 [DOI] [PubMed] [Google Scholar]
- D'Avino PP, Savoian MS, Glover DM (2004) Mutations in sticky lead to defective organization of the contractile ring during cytokinesis and are enhanced by Rho and suppressed by Rac. J Cell Biol 166: 61–71 [DOI] [PMC free article] [PubMed] [Google Scholar]
- Donaldson MM, Tavares AA, Ohkura H, Deak P, Glover DM (2001) Metaphase arrest with centromere separation in polo mutants of Drosophila. J Cell Biol 153: 663–676 [DOI] [PMC free article] [PubMed] [Google Scholar]
- Duronio RJ, O'Farrell PH (1995) Developmental control of the G1 to S transition in Drosophila, cyclin E is a limiting downstream target of E2F. Genes Dev 9: 1456–1468 [DOI] [PubMed] [Google Scholar]
- Dynlacht BD, Brook A, Dembski M, Yenush L, Dyson N (1994) DNA-binding and trans-activation properties of Drosophila E2F and DP proteins. Proc Natl Acad Sci USA 91: 6359–6363 [DOI] [PMC free article] [PubMed] [Google Scholar]
- Dyson N (1998) The regulation of E2F by pRB-family proteins. Genes Dev 12: 2245–2262 [DOI] [PubMed] [Google Scholar]
- Frei C, Galloni M, Hafen E, Edgar BA (2005) The Drosophila mitochondrial ribosomal protein mRpL12 is required for Cyclin D/Cdk4-driven growth. EMBO J 24: 623–634 [DOI] [PMC free article] [PubMed] [Google Scholar]
- Frolov MV, Huen DS, Stevaux O, Dimova D, Balczarek-Strang K, Elsdon M, Dyson NJ (2001) Functional antagonism between E2F family members. Genes Dev 15: 2146–2160 [DOI] [PMC free article] [PubMed] [Google Scholar]
- Hayashi Y, Hirose F, Nishimoto Y, Shiraki M, Yamagishi M, Matsukage A, Yamaguchi M (1997) Identification of CFDD (common regulatory factor for DNA replication and DREF genes) and role of its binding site in regulation of the proliferating cell nuclear antigen gene promoter. J Biol Chem 272: 22848–22858 [DOI] [PubMed] [Google Scholar]
- Hayashi Y, Yamagishi M, Nishimoto Y, Taguchi O, Matsukage A, Yamaguchi M (1999) A binding site for the transcription factor Grainyhead/Nuclear Transcription Factor-1 contributes to regulation of the Drosophila Proliferating Cell Nuclear Antigen gene promoter. J Biol Chem 274: 35080–35088 [DOI] [PubMed] [Google Scholar]
- Hirose F, Ohshima N, Shiraki M, Inoue YH, Taguchi O, Nishi Y, Matsukage A, Yamaguchi M (2001) Ectopic expression of DREF induces DNA synthesis, apoptosis, and unusual morphogenesis in the Drosophila eye imaginal disc: possible interaction with Polycomb and trithorax group proteins. Mol Cell Biol 21: 7231–7242 [DOI] [PMC free article] [PubMed] [Google Scholar]
- Hirose F, Yamaguchi M, Handa H, Inomata Y, Matsukage A (1993) Novel 8-base pair sequence (Drosophila DNA replication-related element) and specific binding factor involved in the expression of Drosophila genes for DNA polymerase alpha and proliferating cell nuclear antigen. J Biol Chem 268: 2092–2099 [PubMed] [Google Scholar]
- Jasper H, Benes V, Atzberger A, Sauer S, Ansorge W, Bohmann D (2002) A genomic switch at the transition from cell proliferation to terminal differentiation in the Drosophila eye. Dev Cell 3: 511–521 [DOI] [PubMed] [Google Scholar]
- Laundrie B, Peterson JS, Baum JS, Chang JC, Fileppo D, Thompson SR, McCall K (2003) Germline cell death is inhibited by P-element insertions disrupting the dcp-1/pita nested gene pair in Drosophila. Genetics 165: 1881–1888 [DOI] [PMC free article] [PubMed] [Google Scholar]
- McCall K, Steller H (1998) Requirement for DCP-1 caspase during Drosophila oogenesis. Science 279: 230–234 [DOI] [PubMed] [Google Scholar]
- Neufeld TP, de la Cruz AF, Johnston LA, Edgar BA (1998) Coordination of growth and cell division in the Drosophila wing. Cell 93: 1183–1193 [DOI] [PubMed] [Google Scholar]
- Ohkura H, Torok T, Tick G, Alvarado M, Kiss I, Glover D (1995) Screening for mitotic mutants on the second chromosome. Eur Dros Res Conf 14: 254 [Google Scholar]
- Ohkura H, Torok T, Tick G, Hoheisel J, Kiss I, Glover DM (1997) Mutation of a gene for a Drosophila kinesin-like protein, Klp38B, leads to failure of cytokinesis. J Cell Sci 110: 945–954 [DOI] [PubMed] [Google Scholar]
- Ohno K, Hirose F, Sakaguchi K, Nishida Y, Matsukage A (1996) Transcriptional regulation of the Drosophila CycA gene by the DNA replication-related element (DRE) and DRE binding factor (DREF). Nucleic Acids Res 24: 3942–3946 [DOI] [PMC free article] [PubMed] [Google Scholar]
- Ohshima N, Takahashi M, Hirose F (2003) Identification of a human homologue of the DREF transcription factor with a potential role in regulation of the histone H1 gene. J Biol Chem 278: 22928–22938 [DOI] [PubMed] [Google Scholar]
- Page AR (2004) The roles of spotted-dick in the Drosophila melanogaster cell cycle. PhD Thesis, University of Cambridge
- Pflumm MF, Botchan MR (2001) Orc mutants arrest in metaphase with abnormally condensed chromosomes. Development 128: 1697–1707 [DOI] [PubMed] [Google Scholar]
- Pirrotta V (1986) Cloning Drosophila genes. In Drosophila, A Practical Approach, Roberts DB (ed), pp 83–110. Oxford: IRL Press [Google Scholar]
- Reis T, Edgar BA (2004) Negative regulation of dE2F1 by cyclin-dependent kinases controls cell cycle timing. Cell 117: 253–264 [DOI] [PubMed] [Google Scholar]
- Riparbelli MG, Callaini G, Glover DM (2000) Failure of pronuclear migration and repeated divisions of polar body nuclei associated with MTOC defects in polo eggs of Drosophila. J Cell Sci 113: 3341–3350 [DOI] [PubMed] [Google Scholar]
- Royzman I, Austin RJ, Bosco G, Bell SP, Orr-Weaver TL (1999) ORC localization in Drosophila follicle cells and the effects of mutations in dE2F and dDP. Genes Dev 13: 827–840 [DOI] [PMC free article] [PubMed] [Google Scholar]
- Ruiz de Mena I, Lefai E, Garesse R, Kaguni LS (2000) Regulation of mitochondrial single-stranded DNA-binding protein gene expression links nuclear and mitochondrial DNA replication in Drosophila. J Biol Chem 275: 13628–13636 [DOI] [PubMed] [Google Scholar]
- Ryu JR, Choi TY, Kwon EJ, Lee WH, Nishida Y, Hayashi Y, Matsukage A, Yamaguchi M, Yoo MA (1997) Transcriptional regulation of the Drosophila-raf proto-oncogene by the DNA replication-related element (DRE)/DRE-binding factor (DREF) system. Nucleic Acids Res 25: 794–799 [DOI] [PMC free article] [PubMed] [Google Scholar]
- Sawado T, Hirose F, Takahashi Y, Sasaki T, Shinomiya T, Sakaguchi K, Matsukage A, Yamaguchi M (1998a) The DNA replication-related element (DRE)/DRE-binding factor system is a transcriptional regulator of the Drosophila E2F gene. J Biol Chem 273: 26042–26051 [DOI] [PubMed] [Google Scholar]
- Sawado T, Yamaguchi M, Nishimoto Y, Ohno K, Sakaguchi K, Matsukage A (1998b) dE2F2, a novel E2F-family transcription factor in Drosophila melanogaster. Biochem Biophys Res Commun 251: 409–415 [DOI] [PubMed] [Google Scholar]
- Shannon M, Hamilton AT, Gordon L, Branscomb E, Stubbs L (2003) Differential expansion of zinc-finger transcription factor loci in homologous human and mouse gene clusters. Genome Res 13: 1097–1110 [DOI] [PMC free article] [PubMed] [Google Scholar]
- Sharkov NV, Ramsay G, Katzen AL (2002) The DNA replication-related element-binding factor (DREF) is a transcriptional regulator of the Drosophila myb gene. Gene 297: 209–219 [DOI] [PubMed] [Google Scholar]
- Song Z, McCall K, Steller H (1997) DCP-1, a Drosophila cell death protease essential for development. Science 275: 536–540 [DOI] [PubMed] [Google Scholar]
- Takata K, Yoshida H, Hirose F, Yamaguchi M, Kai M, Oshige M, Sakimoto I, Koiwai O, Sakaguchi K (2001) Drosophila mitochondrial transcription factor A: characterization of its cDNA and expression pattern during development. Biochem Biophys Res Commun 287: 474–483 [DOI] [PubMed] [Google Scholar]
- Török T, Tick G, Alvarado M, Kiss I (1993) P-lacW insertional mutagenesis on the second chromosome of Drosophila melanogaster: isolation of lethals with different overgrowth phenotypes. Genetics 135: 71–80 [DOI] [PMC free article] [PubMed] [Google Scholar]
- Yamaguchi M, Hirose F, Nishimoto Y, Naruge T, Ikeda M, Hachiya T, Tamai K, Kuroda K, Matsukage A (1995) Expression patterns of DNA replication enzymes and the regulatory factor DREF during Drosophila development analyzed with specific antibodies. Biol Cell 85: 147–155 [DOI] [PubMed] [Google Scholar]
Associated Data
This section collects any data citations, data availability statements, or supplementary materials included in this article.
Supplementary Materials
Supplementary Table I