

Abstract
Background:
This study was designed to investigate the early outcomes after surgical treatment of malignant large bowel obstruction (MBO) and to identify risk factors affecting operative mortality.
Methods:
Data were prospectively collected from 1046 patients with MBO by 294 surgeons in 148 UK hospitals during a 12-month period from April 1998. A predictive model of in-hospital mortality was developed using a 3-level Bayesian logistic regression analysis.
Results:
The median age of patients was 73 years (interquartile range 64–80). Of the 989 patients having surgery, 91.7% underwent bowel resection with an overall mortality of 15.7%. The multilevel model used the following independent risk factors to predict mortality: age (odds ratio [OR] 1.85 per 10 year increase), American Society of Anesthesiologists grade (OR for American Society of Anesthesiologists grade I versus II,III,IV-V = 3.3,11.7,22.2), Dukes’ staging (OR for Dukes’ A versus B,C,D = 2.0, 2.1, 6.0), and mode of surgery (OR for scheduled versus urgent, emergency = 1.6, 2.3). A significant interhospital variability in operative mortality was evident with increasing age (variance = 0.004, SE = 0.001, P < 0.001). No detectable caseload effect was demonstrated between specialist colorectal and other general surgeons.
Conclusions:
Using prognostic models, it was possible to develop a risk-stratification index that accurately predicted survival in patients presenting with malignant large bowel obstruction. The methodology and model for risk adjusted survival can set the reference point for more accurate and reliable comparative analysis and be used as an adjunct to the process of informed consent.
Malignant large bowel obstruction is a high-risk condition, occurring in 15% of patients presenting with colorectal cancer. We describe a prospective multicenter study, describing a prognostic model for quantifying operative risk for such patients. The model can be applied in everyday practice as an adjunct to the process of informed consent.
Malignant large bowel obstruction (MBO) is a high-risk condition, which occurs in 15% of patients presenting with colorectal cancer.1,2 It is associated with a high postoperative morbidity and mortality and has a poor 5-year survival.3,4 Population studies5,6 have shown that 25% of all postoperative deaths after surgery for bowel cancer occur in patients who present with bowel obstruction. It therefore provides an ideal condition in which to study the general problem of quantifying surgical risk according to case-mix, including the preoperative morbid state of the patient. There is increasing emphasis on objective assessment and transparency of clinical outcomes with the intention of comparison between hospitals and clinicians.7,8 Such assessments can be truly objective only if careful adjustment for patient risk factors is undertaken.
The present study was set up by the Association of Coloproctology of Great Britain and Ireland to investigate the results of surgery for malignant large bowel obstruction and to present broad, overall benchmarks by which future standards may be set. The study was also used to identify risk factors that determine postoperative survival of patients with MBO and to develop a risk-stratification system to be used as an adjunct to the process of informed consent.
METHODS
The MBO study was undertaken during a 1-year period from April 1998 to March 1999. The participating surgeons and their teams, who joined the study on a voluntary basis, collected prospective data locally. A 2-side A4 proforma was used to collect data, which included demographic details, preoperative assessment and clinical staging, the nature of surgical treatment, postoperative course, and pathology. Proformas were returned centrally and data entered into a Microsoft Access 2000 (Microsoft Corporation, Redmond, WA) database for analysis.
Target Population
Patients undergoing surgery for MBO, including palliative or diagnostic procedures, using general or regional anesthesia. MBO was defined as clinical or radiologic evidence of distended large and/or small bowel secondary to colorectal cancer and presenting as an emergency.
Outcomes
Primary outcome was in-hospital postoperative mortality, defined as death during the same hospital admission as the operation, regardless of cause. Secondary outcome included the length of hospital stay measured in days and defined as the time from the date of the main operative procedure to the discharge date or death. The patient and procedural risk-factors included: (1) age; (2) gender; (3) American Society of Anesthesiologists (ASA) grade; (4) surgical procedure categorized according to the OPCS4 system;9 (5) operative urgency classified as emergency, urgent, scheduled or elective according to the National Confidential Enquiry into Perioperative Deaths (NCEPOD) classification;10 (v6) cancer staging according to the clinical findings and histologic Dukes’ classification for Colorectal cancer;11 (7) timing of surgery during a twenty 4 hour period; (8) whether the cancer was excised; (9) grade of operating surgeon (10) consultant ACPGBI membership. Each risk-factor was assigned a “reference” category which represents the subcategory with the lowest impact on in-hospital mortality (odds ratio of 1): eg, age ≤ 65 years for “age group” or scheduled surgery for “operative urgency” as shown in Table 1.
TABLE 1. Patient Demographic Characteristic and Univariate and Multivariate Analysis for Prediction of Operative Mortality for Patients Presenting With Malignant Large Bowel Obstruction Model

Statistical Analysis
Unifactorial logistic regression was used to identify risk factors for in-hospital operative mortality. Continuous variables such as age were categorized into appropriate subgroups representing age strata of increasing operative risk. A three-level hierarchical logistic regression model was used for identifying independent risk factors of operative mortality and their interactions terms, as well as adjusting for the clustering of adverse outcomes within individual hospitals. The initial model estimates were derived using a second order penalized quasi likelihood estimation.12 Subsequently, a Bayesian approach was used, utilizing diffuse priors (Gamma (ε,ε) prior distribution, where ε was set to 0.001) and the Gibb's resampling method with 50,000 iterations to calculate confidence limits and to correct bias in the parameter estimation.13 The probability of operative mortality (log it yijk) of patient i, operated by surgeon j, in hospital k was calculated using by the equation shown in Figure 1.
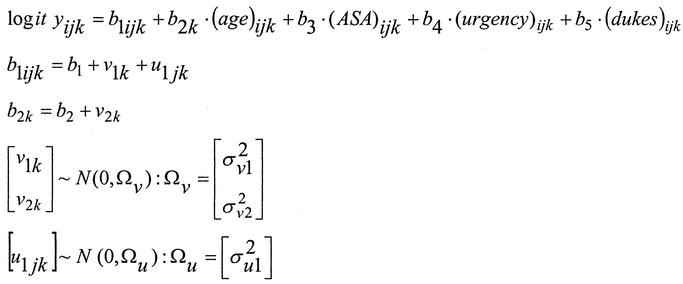
FIGURE 1. Hierarchical logistic regression equation used for calculating the probability of death in patients undergoing surgery for malignant large bowel obstruction.
This technique provided separate risk-models and prediction lines to fit each individual surgeon at each hospital. A special weighted average of these models, so called “random effect” model was then used to derive the composite MBO model. The performance of the MBO model was evaluated by measures of calibration, discrimination and subgroup analysis. Calibration or goodness-of-fit refers to the ability of the model to assign the correct probabilities of outcome to individual patients and was measured by the Hosmer-Lemeshow statistic.14 Model discrimination refers to the ability of the model to assign higher probabilities of death to patients who actually die compared with those who live. This was measured by the area under the receiver operator characteristic curve or c-index.15 The ratio of the observed to expected operative mortality rate for each unit was multiplied by the mean overall operative mortality from the pooled data from all hospitals to derive the unit risk-adjusted operative mortality rate.
Software
The following statistical software packages were used to develop the risk model: “Statistical Package for the Social Sciences” version 11 for Windows (SPSS, Chicago, IL), MLwiN Version 1.2 (University of London), and WinBUGS Version 1.4 (Imperial College & MRC, UK).
RESULTS
Patients, Surgeons and Hospitals in the Study
A total of 294 surgeons from 148 hospitals contributed 1046 cases to the study. Data analysis was based on 989 (94.6%) of 1046 patients satisfying the inclusion criteria. Excluded from the analysis were patients managed without surgery (n = 13) and patients whose operative mortality was not recorded (n = 44; 0.4%).
The median number of cases per center was 6 (range 1 to 41) and the median number of cases per consultant was 3 (range 1 to 19). The average age of male patients was 69.7 years (range 21 to 93 years) and of female patients 72.9 years (range 22 – 99). The median length of hospital stay was 14 days (range 1–141 days). Demographic characteristics and postoperative mortality for the various patient related risk factors are shown in Table 1 with their unadjusted odds ratios calculated relative to each risk factor's reference category.
The Relationship Between Age and In-Hospital Mortality
This is shown in Figure 2 for scheduled and urgent procedures among individual units. The hierarchical regression model provided individual prediction lines for each hospital with different gradients and intercepts on the vertical-axis. The median regression line for the study population was superimposed on the prediction lines for individual hospitals. Increasing age was shown to be associated with a higher operative mortality among the strata of operative urgency, with adjusted odds ratio of 1.85 per 10 years increase in age, confidence interval 1.52–2.26.
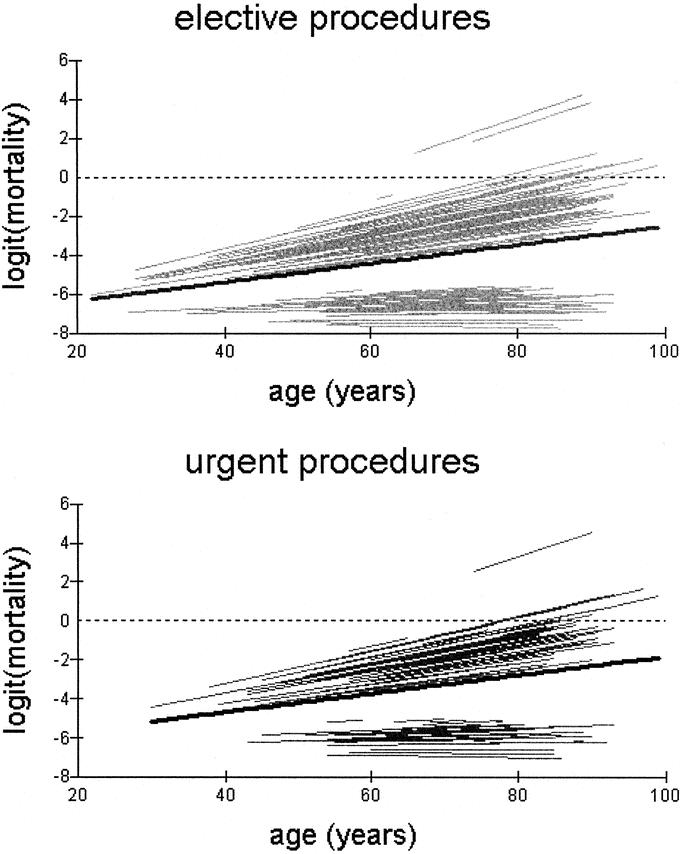
FIGURE 2. Variation of in-hospital operative mortality (plotted on the logit scale) with age across scheduled and urgent procedures. Each line represents individual prediction curves for each hospital. The median regression line (bold black) is superimposed on the prediction curves for individual hospitals.
Variation of Postoperative Mortality by Age, ASA Grade, and Operative Urgency
This is shown in Figure 3. Operations performed on an urgent or emergency basis were associated with a higher operative mortality in all 4 ASA strata compared with scheduled operations having adjusted for age, ASA and unit effect.
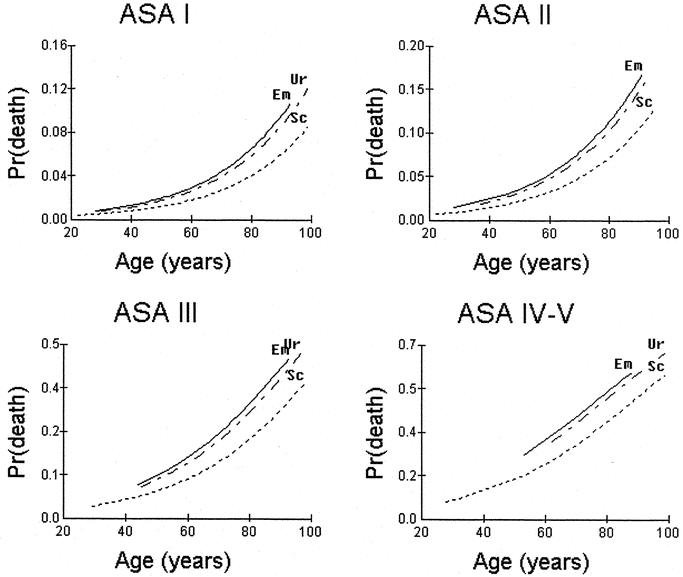
FIGURE 3. Variation of operative mortality by age, ASA grade and operative urgency. The regression lines have been adjusted for age, ASA, operative urgency using a 3-level hierarchical logistic regression model. Sc, scheduled procedure; Ur, urgent procedure, Em, emergency procedure.
Identification of Independent Risk Factors
In the MBO model, 4 risk factors were found to be independent predictors of operative mortality. Their adjusted odds ratios and 95% confidence intervals are shown in Table 1. Cancer excision, timing of surgery and type of operative procedure did not appear to confer any added advantage by introducing them into the model. On further testing no significant first order interactions between the risk factors were identified in the dataset. The model fitted the data well (calibration Hosmer-Lemeshow statistic; χ2=7.606, 8df, P = 0.473), and had adequate discriminant ability (area under the receiver operator characteristic curve 0.801, standard error=0.019). The MBO model-predicted operative mortality for 6 types of operative procedures, was well within the confidence limits of the observed outcome as shown in Figure 4. (Hosmer-Lemeshow statistic: 3.21, 5df, P = 0.668). No significant differences were obtained between the observed and expected mortality rates among the strata of age, ASA, Dukes’ stage and urgency of the procedure.
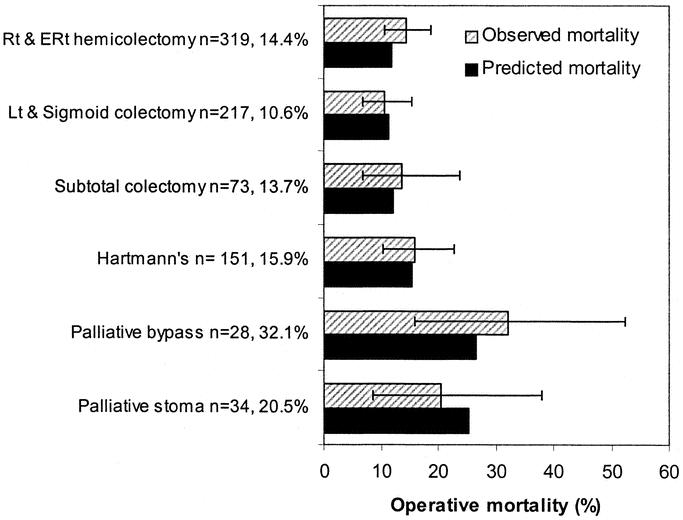
FIGURE 4. Bar charts comparing the observed and predicted in-hospital operative mortality by type of operative procedure. 95% confidence intervals are displayed around the observed outcome. (Hosmer-Lemeshow statistic: 3.21, 5df, P = 0.668).
Comparison Between Hospitals and Surgeons
A greater variation in operative mortality was evident in the elderly patients between centers. With increasing age, the individual hospital prediction lines diverged away from the average prediction line for both elective and emergency procedures (Fig. 2). The between-hospital variability for the line gradient or slope, was formally tested by the level-3 variance and was found to be statistically significant. (
= 0.004, SE 0.001, χ2 = 0.303, 1df, P < 0.001). No significant interhospital variability was demonstrated for the line intercepts or constants (
= 0.024, SE 0.030, χ2 = 0.346, 2df, P = 0.556). In hospital mortality was also compared between consultant surgeons who were members (cases 545) and nonmembers (cases 444) of the ACPGBI. The median number of operated cases per ACPGBI member was 4 (range 1 to 19) compared with 2 (range 1 to 11) for nonmembers. There was no difference in the adjusted operative mortality rate between the 2 groups.
DISCUSSION
Patients with MBO are biologically a continuum ranging from complete obstruction to an incidental finding at elective operation with fecal loading in a nondilated bowel proximal to a tight stricture and outcomes may vary greatly, according to the degree of obstruction. In the present study, the definition of MBO was first presentation of a colorectal cancer as an emergency with radiologic or clinical evidence of distended large and / or small bowel as suggested by Fielding et al.16 The study was conducted on a voluntary basis in hospitals scattered throughout the UK. Since these units were not selected at random, inferences about how representative the outcomes are of the overall UK population cannot be made. However, outcome results were similar to the total population studies in Wessex,5 Trent and Wales.6
A relatively new statistical method called hierarchical regression analysis was adopted to develop the MBO model. This method is particularly useful in modeling observations that have a hierarchical or clustered structure. Such data are routinely found in various fields, such as patients within hospitals17,18 or pupils within schools.19 Older approaches tend to simply ignore the hierarchical structure of the data, performing the analysis by disaggregating all the data to the lowest level and subsequently applying standard methodologies. The penalty for ignoring the clustered nature of patients within hospitals is that the standard error of the regression coefficients, which describes the performance of each hospital, is lower.20 Nonhierarchical models are unable to allow for the distorting potential of small numbers of operated cases, deprived catchment populations and other possible risk factors. Such units may be divergent or under-perform by chance, rather than provide suboptimal care. Hierarchical models work on the basic principle that the true performance rates for different centers are drawn from a normal distribution and, as a consequence, the performance rate (unit coefficient) of each hospital is weighted according to the number of cases submitted. This may allow for risk factors, which may be specific to an individual center, such as deprivation. The unit coefficients are therefore shrunk towards the population mean with greater shrinkage for smaller centers. The shrinkage attempts to simulate the regression to the mean, thus providing a more realistic and accurate estimate of long-term performance.
The use of operative mortality to compare quality of care between providers demands comprehensive, accurate and reliable information that is clinically valid. At present, data quality was limited by the observational nature of the study. Implementation of such prediction systems within hospitals should lead to an increased awareness in the use of such data, with subsequent improvement in the quality of the data collection.
It is no longer safe to define standards such as postoperative mortality in terms of a single number without adjustment for risk factors. The present study demonstrated that although the average postoperative mortality was 16.5% (95% confidence interval 14.3–18.9), it ranged from 1.0% in a fit 60-year-old having a curative right hemicolectomy, to near 50% in an 80-year-old ASA III patient having a palliative left hemicolectomy. This separation of patients according to risk is becoming increasingly important, particularly in elderly patients, when the benefits of surgery may be outweighed by the risk. Difficult clinical decisions may be easier if the MBO model is applied in the preoperative setting to provide patients with an estimated numerical probability of survival as part of the counseling and decision-making process of informed consent. This is relevant as the recent advances in colonic stenting offers an alternative definitive treatment to potentially high-risk surgery. In the present study we identified 4 important predictors of outcome, namely age, ASA grade, operative urgency and Dukes’ staging which are in agreement with previously published work.2,4,21 Using unadjusted and risk-adjusted outcomes, we demonstrated that the mortality following surgery for MBO was similar between ACPGBI and non-ACPGBI members and between hospitals. This can be used to reassure the public and health providers that immediate survival after surgery for MBO is not greatly affected by these factors.
CONCLUSIONS
The present study is an example of the means by which a professional body can conduct outcomes research at a national level. We demonstrated the feasibility of central data harvesting using precise definitions to ensure standardization and uniformity of data collection. Hierarchical regression analysis identified factors that were most important in determining mortality of patients with obstructed colorectal cancer and provided accurate risk-adjusted outcomes.
ACKNOWLEDGMENTS
The study was set up by J.D.S. and M.R.T, initial data analysis was undertaken by Sarah Fowler and R.K. The raw data was analyzed and collated by R.K. and Dendrite Clinical Systems and is freely available in a report published jointly with the Association of Coloproctology (www.acpgbi.org). The development of the hierarchical risk model was conducted by P.P.T. and the drafting of this publication was undertaken by P.P.T. and edited by R.K., M.R.T., and J.D.S. All investigators contributed comments and corrections on the final draft. A large number of individuals have supported this National study and we are most grateful for their help. We specifically wish to thank those surgical colleagues, listed in the National MBO report,22 who returned data and thus made the project possible and Helen Chave who presented some of the initial results. The authors thank The Royal College of Surgeons of England for funding Mr. Paris Tekkis through the “Hue Falwasser” research fellowship. The study would not have been possible without the help of Dendrite Clinical Systems, which is gratefully acknowledged.
Footnotes
Supported by the “Hue Falwasser” research fellowship of The Royal College of Surgeons of England.
Orally presented at the research forum at The American Society of Colon and Rectal Surgeons Annual Convention, Chicago, June 3-8, 2002.
Reprints: Mr Jeffrey D. Stamatakis, MS, FRCS(Eng), FRCS(Ed), Department of Surgery, Princess of Wales Hospital, Coity Road, Bridgend, CF31 1RQ, UK. E-mail: jeff.stamatakis@bromor-tr.wales.nhs.uk.
REFERENCES
- 1.Ohman U. Prognosis in patients with obstructing colorectal carcinoma. Am J Surg. 1982;143:742–747. [DOI] [PubMed] [Google Scholar]
- 2.Irvin TT, Greaney MG. The treatment of colonic cancer presenting with intestinal obstruction. Br J Surg. 1977;64:741–744. [DOI] [PubMed] [Google Scholar]
- 3.Phillips RK, Hittinger R, Fry JS, et al. Malignant large bowel obstruction. Br J Surg. 1985;72:296–302. [DOI] [PubMed] [Google Scholar]
- 4.Mulcahy HE, Skelly MM, Husain A, et al. Long-term outcome following curative surgery for malignant large bowel obstruction. Br J Surg. 1996;83:46–50. [DOI] [PubMed] [Google Scholar]
- 5.Wessex Colorectal Cancer Audit. First Report. Wessex Cancer Intelligence Unit, Highcroft, Romsey Road, Winchester SO2 5DH; 1993.
- 6.Mella J, Biffin A, Radcliffe AG, et al. Population-based audit of colorectal cancer management in two health regions. Br J Surg. 1997;84:1731–1736. [PubMed] [Google Scholar]
- 7.Khuri SF, Daley J, Henderson W, et al. The Department of Veterans Affairs’ NSQIP: the first national, validated, outcome-based, risk-adjusted, and peer-controlled program for the measurement and enhancement of the quality of surgical care. National VA Surgical Quality Improvement Program. Ann Surg. 1998;228:491–507. [DOI] [PMC free article] [PubMed] [Google Scholar]
- 8.Khuri SF, Najjar SF, Daley J, et al. Comparison of surgical outcomes between teaching and nonteaching hospitals in the Department of Veterans Affairs. Ann Surg. 2001;234:370–382. [DOI] [PMC free article] [PubMed] [Google Scholar]
- 9.Hospital Episode Statistics, Main operations 2000/01, Department of Health. In: Available at: http://www.doh.gov.uk/hes/free_data/index.html Accessed April 30, 2004.
- 10.Appendix A. In: Then and Now: The 2000 Report of the National Confidential Enquiry into Perioperative Deaths. London; 2000. p. 125–126.
- 11.Dukes CE. The classification of cancer of the rectum. J Pathol Bacteriol. 1932;35:323–332. [Google Scholar]
- 12.In: Rasbash J, Browne W, Goldstein H, et al., editors. A User's Guide to MLwiN. London: University of London; 2001. [Google Scholar]
- 13.Spiegelhalter DJ, Aylin P, Best NG, et al. Commissioned analysis of surgical performance by using routine data: lessons from Bristol inquiry. J R Statist Soc A. 2002;165:1–31. [Google Scholar]
- 14.Hosmer DW, Lemeshow S. Applied Logistic Regression. 2nd ed. New York: John Wiley & Sons Inc; 2000. [Google Scholar]
- 15.Hanley JA, McNeil BJ. The meaning and use of the area under a receiver operating characteristic (ROC) curve. Radiology. 1982;143:29–36. [DOI] [PubMed] [Google Scholar]
- 16.Fielding LP, Stewart-Brown S, Blesovsky L. Large-bowel obstruction caused by cancer: a prospective study. BMJ. 1979;2:515–17. [DOI] [PMC free article] [PubMed] [Google Scholar]
- 17.Spiegelhalter DJ, Myles JP, Jones DR, et al. Bayesian methods in health technology assessment: a review. Health Technol Assess. 2000;4:1–130. [PubMed] [Google Scholar]
- 18.Marshall EC, Spiegelhalter DJ. Reliability of league tables of in vitro fertilisation clinics: retrospective analysis of live birth rates. BMJ. 1998;316:1701–1704; discussion 1705. [DOI] [PMC free article] [PubMed] [Google Scholar]
- 19.Goldstein H, Thomas S. Using examination results as indicators of school and college performance. J R Statist Soc A. 1996;159:149–163. [Google Scholar]
- 20.Greenland S. Principles of multilevel modelling. Int J Epidemiol. 2000;29:158–167. [DOI] [PubMed] [Google Scholar]
- 21.Runkel NS, Schlag P, Schwarz V, et al. Outcome after emergency surgery for cancer of the large intestine. Br J Surg. 1991;78:183–188. [DOI] [PubMed] [Google Scholar]
- 22.Stamatakis JD, Thompson MR, Chave H. National Audit of Bowel Obstruction due to Colorectal Cancer April 1998 - March 1999. London: Association of Coloproctogy of Great Britain and Ireland; 2000. [Google Scholar]