

Abstract
Objective:
We sough to quantitate the course of specific cytokine mRNA expression in tissues that exhibit increasing histopathological changes in time in an animal model for the multiple organ dysfunction syndrome (MODS).
Summary Background Data:
The development of treatment protocols for MODS requires elucidation of the mechanisms and mediators involved. To devise logical interventions, it is necessary to collect data on cytokine expression at tissue level during the development of MODS.
Methods:
Ninety-four C57BL/6 mice were given an intraperitoneal injection of 40 μg of lipopolysaccharide (LPS), followed by zymosan at a dose of 0.8 mg/g body weight 6 days later (day 0). Six additional animals did not receive zymosan and acted as controls. At several time points after zymosan injection, 6 randomly assigned, zymosan-treated animals were killed, and their livers, lungs, spleens, and kidneys were collected. mRNA expression of tumor necrosis factor-α, interleukin (IL)-1β, IL-6, macrophage migration inhibiting factor, IL-12, interferon-γ, and IL-10 was measured using a real-time reverse transcription-polymerase chain reaction assay.
Results:
The injection of zymosan induced an acute peritonitis, followed by an apparent recovery. From approximately day 6 onwards, animals started to display MODS-like symptoms. During the peritonitis phase, up-regulation of cytokine mRNA was limited. During the period of apparent recovery, cytokine mRNA expression strongly increased, mostly reaching its maximum at day 9 when deterioration of the clinical condition had already set in. The up-regulation of tumor necrosis factor-α mRNA was most pronounced, especially in the lungs and liver.
Conclusions:
Interventions should preferentially be targeted against multiple cytokines and, at least in this model, there may be a treatment window well after the initial challenge.
Intraperitoneal zymosan induced the gradual development of multiple organ dysfunction syndrome in mice. Up-regulation of mRNA for specific cytokines was tissue- and time-dependent and progressed well after the initial challenge. Next to the strong induction of tumor necrosis factor-α mRNA, the message for interleukin (IL)-1β, IL-6, IL-12, interferon-γ, and IL-10 was significantly enhanced, indicating roles for multiple mediators in the pathophysiology.
Multiple organ dysfunction syndrome (MODS) is widely considered to be the leading cause of morbidity and mortality for patients admitted to the intensive care unit. MODS is not a specific disease with a well-characterized pathophysiology but rather a common destructive pathway that may be encountered after a variety of serious insults like major trauma, severe bacterial infection, or pancreatitis. It is characterized by a complex and overwhelming host response that usually occurs after massive injury or infection.1 This overwhelming host response results in systemic inflammation, which is generally believed to be the cause of MODS. Treatment of patients with MODS is still largely supportive. The development of adequate treatment protocols requires elucidation of the mechanisms and mediators involved in its pathophysiology. Lately, many efforts have focused on the identification of endogenous mediators that participate in the inflammatory cascade of MODS.2,3 Circulating inflammatory mediators are relatively easy to measure but may be a poor reflection of processes at organ level, where the damage occurs. Because measurements at tissue sites require invasive procedures that cannot be easily performed in humans, our group has developed an animal model4–6 that is acknowledged as the only one to produce, on a consistent basis, pathologic changes that mimic both the sequence and intensity of those occurring in human MODS.7–9 After a single insult in the form of an intraperitoneal challenge with zymosan rodents suffer an acute, peritonitis-like phase that is followed by an apparent recovery. Thereafter, a gradual deterioration occurs, characterized by increasing organ damage and dysfunction.5 Previous measurements, in the circulation and on isolated peritoneal cells, have suggested an important role in this process for proinflammatory cytokines, especially tumor necrosis factor (TNF)-α.10 Although mortality is significantly reduced, TNF-α knockout mice still exhibit MODS-like symptoms indicating the involvement of other mediators.6
To devise logical interventions, possibly directed at multiple cytokines, it is necessary to collect data on their expression at tissue level during the development of MODS. For this purpose, we have performed a comprehensive study quantitating the course of specific cytokine mRNA expression in lung, liver, spleen, and kidney, tissues that exhibit increasing histopathological changes in time.5
A large number of proinflammatory mediators have been implicated in the systemic inflammatory response. Specific neutralization of interleukin (IL)-1, TNF-α, interferon-γ (IFN-γ), macrophage migration inhibiting factor (MIF), and IL-12 has been shown to improve survival during murine endotoxemia.11 Also, studies in critically ill patients have demonstrated that increased circulatory levels of TNF and IL-6 are associated with organ dysfunction.12–15 During inflammation, IL-10 is also produced. It is regarded as an anti-inflammatory cytokine and its function is probably to mitigate the inflammatory response.16 To gain insight into the possible role of these cytokines in its pathogenesis, we have measured the expression of TNF-α, IL-1β, IL-6, MIF, IL-12, IFN-γ, and IL-10 mRNA in the livers, lungs, spleens and kidneys during the development of MODS in mice.
MATERIALS AND METHODS
Animals
The experiment was performed using 100 C57BL/6 mice, 7 to 9 weeks old weighing 20–25 g. The animals were fed standard chow (Hope Farms RMB-H, Woerden, The Netherlands) and acidified water ad libitum. The day/night cycle was 12/12. Before use, the animals were allowed to acclimatize for 5 days. The experiment was approved by the Animal Ethics Review Committee of the University Medical Center Nijmegen.
Zymosan-Induced Generalized Inflammation (ZIGI)
The ZIGI model for MODS has been described previously.4–6 Briefly, mice were given an aseptic intraperitoneal injection of 40 μg lipopolysaccharide (LPS; Escherichia coli, Sigma Chemical, St Louis, MO) dissolved in 200 μL of phosphate-buffered saline, followed 6 days later by zymosan administration (day 0). Zymosan A (Sigma Chemical Co.) was sterilized by gamma radiation (5 kGray) and homogeneously suspended in sterile paraffin oil (25 mg/mL) by high-frequency vibration during 1 hour. After sonification, the suspension was sterilized again in a waterbath at 100°C for 80 minutes. All suspensions were freshly made before use. Zymosan was given intraperitoneally in a dose of 0.8 mg/g body weight.
Experimental Design
From a pool of 100 animals, mice were randomly divided into 3 groups. Group 1 consisted of 84 mice that were treated with LPS and zymosan. Six additional animals did not receive any experimental treatment and acted as controls (group 2). To monitor the clinical course due to zymosan treatment, a group of 10 additional mice (group 3) was treated with LPS and zymosan and their body temperature, body weight and survival were monitored until day 17, when surviving animals were killed.
At days 2, 5, 7, 9, 11, 13, and 15 after zymosan injection 6 randomly assigned animals from group 1 were killed, and their livers, lungs, spleens and kidneys were collected. This was also done with the surviving animals at day 17 (11 zymosan-treated mice and the 6 control mice from group 2), when the experiment was ended. Lung damage was assessed macroscopically, using an arbitrary lung score: 0: no hemorrhages; 1: hemorrhagic spots covering approximately 1–25% of the lung surface; 2: confluent hemorrhagic spots covering approximately 25–50% of the lung surface; 3: great areas of hemorrhage covering 50–75% of the lung surface; 4: completely hemorrhage lungs (75–100% of the surface covered with hemorrhages).
Quantitative Reverse-Transcriptase Polymerase Chain Reaction (RT-PCR)
After collection, organs were snap-frozen in liquid nitrogen and stored at −80°C. Frozen organs were homogenized and total RNA was extracted with the guanidinium thiocyanate-phenol-chloroform method according to Chomczynski and Sacci.17 RNA concentration was determined by spectrophotometric measurements with a GeneQuant II RNA/DNA calculator (Amersham Pharmacia Biotech, Uppsala, Sweden). The purity of precipitated total RNA was ascertained by 1% agarose gel electrophoresis.
Isolated RNA was used as a template for the production of first strand cDNA using random hexamers. Relative quantification of target mRNA was performed with a TaqMan real-time RT-PCR assay on an ABI PRISM 7700 Sequence Detector (Applied Biosystems, Foster City, CA). Briefly, this method uses the 5′-3′ exonuclease activity of Taq polymerase to cleave a dually labeled nonextendable TaqMan probe designed to hybridize to a sequence between the forward and the reverse primer. The probe has a quencher dye (6-carboxytetramethylrhodamine) on its 3′ end and a reporter dye (6-carboxyfluorescein) at its 5′ end. Fluorescence emission of the reporter dye is quenched by the quencher dye until nuclease degradation by Taq polymerase during the extension phase of the PCR separates the 2 dyes and enables detection of the reporter dye fluorescence. The threshold cycle (Ct) is defined as the fractional cycle number at which the reporter fluorescence reaches 10x the standard deviation of the baseline. Quantification of the amount of target in unknown samples is accomplished with measurement of Ct and use of a standard curve to determine the starting concentration of target. Standard curves for TNF-α, IL-1β, IL-6, MIF, and IL-10 were generated using RNA from a mouse macrophage cell line (J774-A1) that was stimulated with LPS (1 μg/mL) for 6 hours (TNF-α, IL-1β, MIF) or 4 hours (IL-6, IL-10), respectively. Standard curves for IL-12 were generated using RNA for J774-A1 cells that were stimulated with LPS (1 μg/ml) and hIFN-γ (10 ng/mL) for 9 hours. Standard curves for IFN-γ were generated using RNA from murine spleen cells that were stimulated with anti-CD3 (10μg/ml) for 12 hours.
To correct for variations in cDNA concentration between samples, target gene expression was normalized by dividing the starting concentration of target by the starting concentration of constitutively expressed 18S ribosomal RNA (endogenous control). There were differences in the expression of different target genes in organs of untreated control mice (Table 1). Because in this study we were interested in changes of gene expression during the course of the animal model, the results in figures are represented as upregulations of gene expression. Up-regulation of gene expression at any time point was calculated as the median of normalized gene expressions divided by the median of normalized gene expressions of untreated control mice.
TABLE 1. Constitutive Gene Expression of Target Genes in Organs of Untreated Control Mice

Oligonucleotide primers and TaqMan probes were designed with use of the Primer Express 1.0 software (Applied Biosystems Inc). To avoid amplification of genomic DNA, cDNA specific primer sets were used when possible (TNF-α, IL-1β, IL-6, IL-12, IFN-γ, and IL-10) or, when impossible (MIF), contaminants of genomic DNA was removed from the RNA samples using DNase I (Boehringer Mannheim) before cDNA synthesis. Primers for IL-12 were selected using the gene sequence of the p40 subunit of IL-12. The sequences of primers and probes are represented in Table 2.
TABLE 2. Sequences (5′–3′) of Primers and Probes used in Polymerase Chain Reactions

The PCR conditions were as follows: for amplification of the target product, 25 ng of cDNA (except MIF: 2.5 ng) was added to the PCR mixture consisting of 25 μL TaqMan Mastermix (Applied Biosystems), 12.5 pmol fluorescent probe (Applied Biosystems) and 15 pmol of each primer in a final volume of 50 μL. For amplification of the 18S rRNA product, the PCR mixture consisted of 25 μL TaqMan Mastermix and 2.5 μL of predeveloped TaqMan 18S rRNA control kit (Applied Biosystems). Again, the final volume was 50 μL. Thermal cycling conditions were 2 minutes at 50°C and 10 minutes of initial denaturation at 95°C to activate Taq Gold polymerase, followed by 40 cycles of 2-step PCR consisting of 15 seconds at 95°C and 1 minute at 60°C.
RESULTS
Clinical Course
Survival, body temperature, and body weight of mice in group 3 are represented in Figure 1. The clinical course of the animal model was similar as described previously.5,6 Briefly, after the injection of LPS the animals became ill for 1 day, but by the time they received zymosan (day 0) the mice had recovered completely. The injection of zymosan induced an acute peritonitis rendering all animals very ill during the first 2 days, as reflected by a ruffled fur, diarrhea, lethargic behavior, and a decrease in body weight and temperature. During the second phase of the illness (days 3–5), the condition of the surviving animals appeared to return to normal, with an increase in body weight and temperature. From approximately day 6 onward, mice entered the third -MODS-like- phase, indicated by lethargic behavior, breathing difficulties, weight loss, and a decrease in body temperature. The survival curve of mice in group 1 was similar to that of mice in group 3 (Fig. 2A). Lung scores of mice in group 1 that were killed at different time points indicate progressive organ damage from day 5 onwards (Fig. 2B).
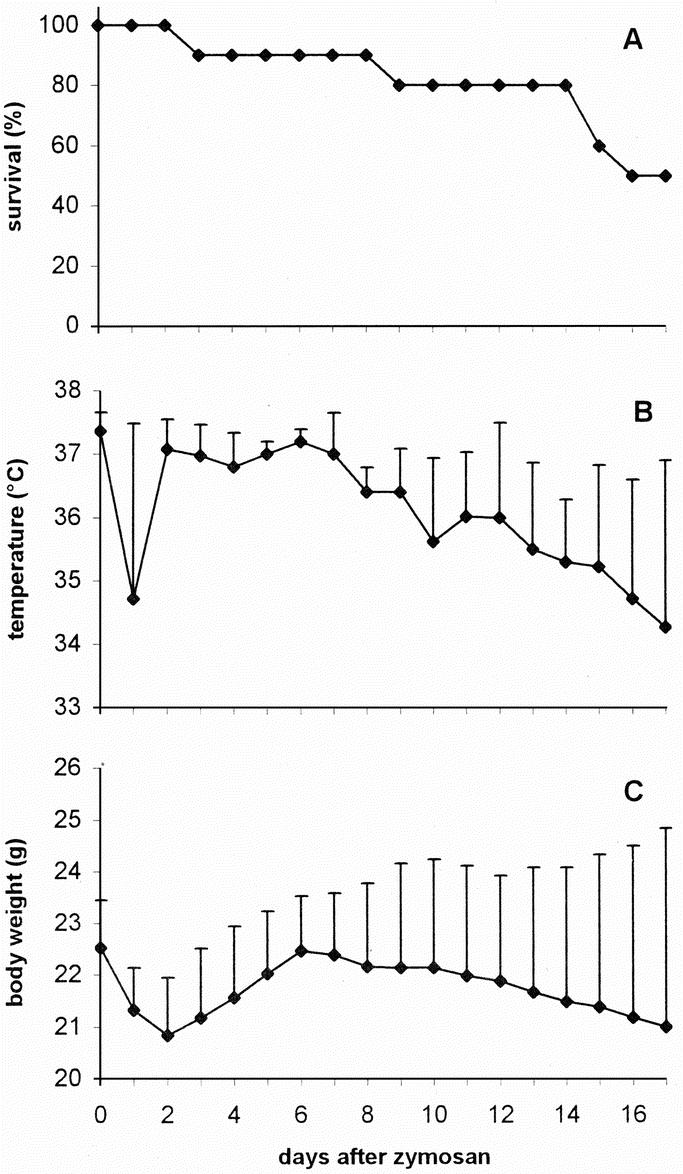
FIGURE 1. Clinical course after zymosan administration. A group of 10 animals (group 3) was followed to monitor survival (A), body temperature (B), and body weight (C). The latter are depicted as average + SD.
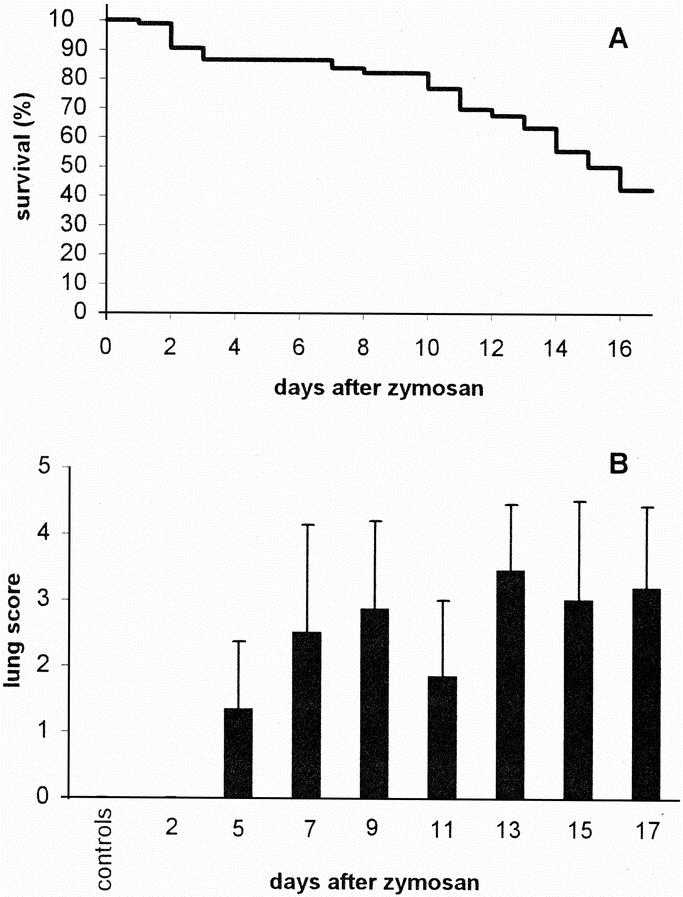
FIGURE 2. Survival and development of lung damage after zymosan administration. A, Kaplan-Meier survival curve in group 1 (n = 84 at day 0), which was used for cytokine mRNA quantitation; B, Lung score for mice in groups 1 and 2 (controls). Bars represent average values (+ SD, n = 6 for controls and days 2–15 and n = 11 for day 17).
TNF-α mRNA Expression
TNF-α mRNA was strongly up-regulated in all organs, except for the spleen (Fig. 3A). Figure 3 gives, for reasons of clarity, median values only. To demonstrate the degree of variation observed between animals, the expression of TNF-α (and IL-1β) mRNA in the liver of all individual animals is illustrated in Figure 4. In the liver, TNF-α message started to increase strongly between days 5 and 7, and peaked around day 9 with a mRNA expression that was 85 times higher than in control animals. After day 9, the expression of TNF-α message in the liver gradually decreased, but remained high until the end of the experiment. In the lungs, the increase in TNF-α message was even higher than in the liver and significant up-regulation was observed earlier: at day 2, the increase in TNF-α message was already 16-fold. At day 9, there was a transient and extremely high peak of TNF-α message (237 times the level of controls), but the expression was reduced quickly again over the next 2 days, whereafter the up-regulation slowly decreased further. However, it was still substantial at day 17. The up-regulation of TNF-α message at day 2 was higher in the kidneys than in the other organs. It peaked again at day 11 and gradually declined afterward.
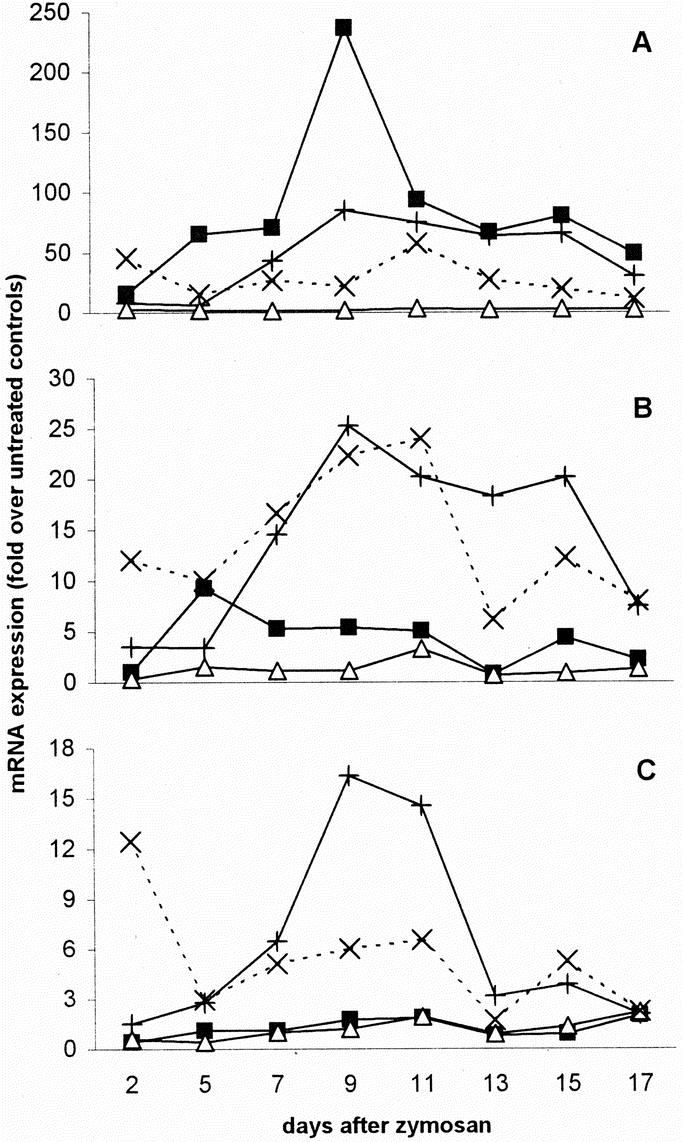
FIGURE 3. Up-regulation of TNF-α (A), IL-1β (B), and IL-6 (C) mRNA. The degree of up-regulation was calculated for each animal as the mRNA expression at any time point in relation to the median mRNA expression in control mice. Data are represented as medians. +, liver; ▪, lungs; Δ, spleen; ×, kidneys, n = 6 per organ per time point.
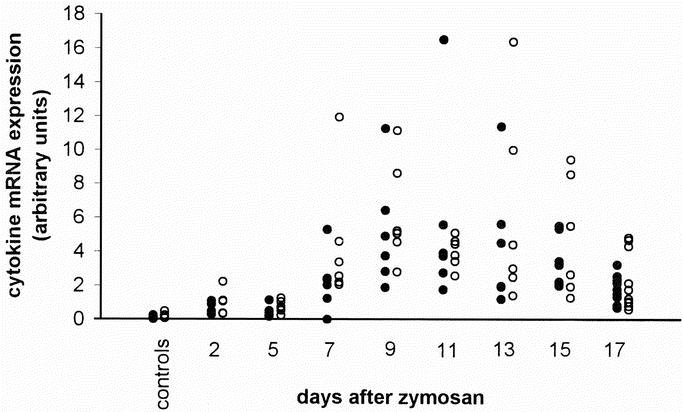
FIGURE 4. Cytokine mRNA expression in the liver. Individual values of mRNA for TNF-α (•) and IL-1β (○), quantitated by a real-time RT-PCR, in livers from untreated control mice and zymosan-treated animals.
IL-1β mRNA Expression
The expression of IL-1β message was also substantially increased in all organs, again with exception of the spleen (Fig. 3B). In the liver, a strong increase started from day 5 onwards, reaching a peak at day 9, when the expression of IL-1β mRNA was 25 times the level of controls. Up-regulation decreased significantly only after day 15 (Figs. 3B and 4). In contrast, there was only a limited increase in IL-1β message in the lungs, showing a maximum at day 5. In the kidneys, however, there was already a remarkable up-regulation of IL-1β mRNA at day 2, which reached a peak at day 11 (24-fold).
IL-6 mRNA Expression
Significant up-regulation of IL-6 mRNA appeared to be limited to liver and kidneys. The expression of IL-6 mRNA in the liver started to increase after day 2 and reached a maximum at days 9 to 11, when the expression was around 15 times the level of controls (Fig. 3C); thereafter, the level of mRNA quickly decreased to values approximately 3 times the level of controls. The expression of IL-6 message in the kidneys was up-regulated 12-fold at day 2, after which it dropped rapidly.
MIF mRNA Expression
In general, the expression of MIF mRNA in the collected organs was very high. However, MIF mRNA was also abundantly expressed in the organs of control animals, as reflected by low Ct values of organs of control mice (Table 1). Therefore, there was no substantial up-regulation of MIF mRNA in any organ at any time point (Fig. 5A).
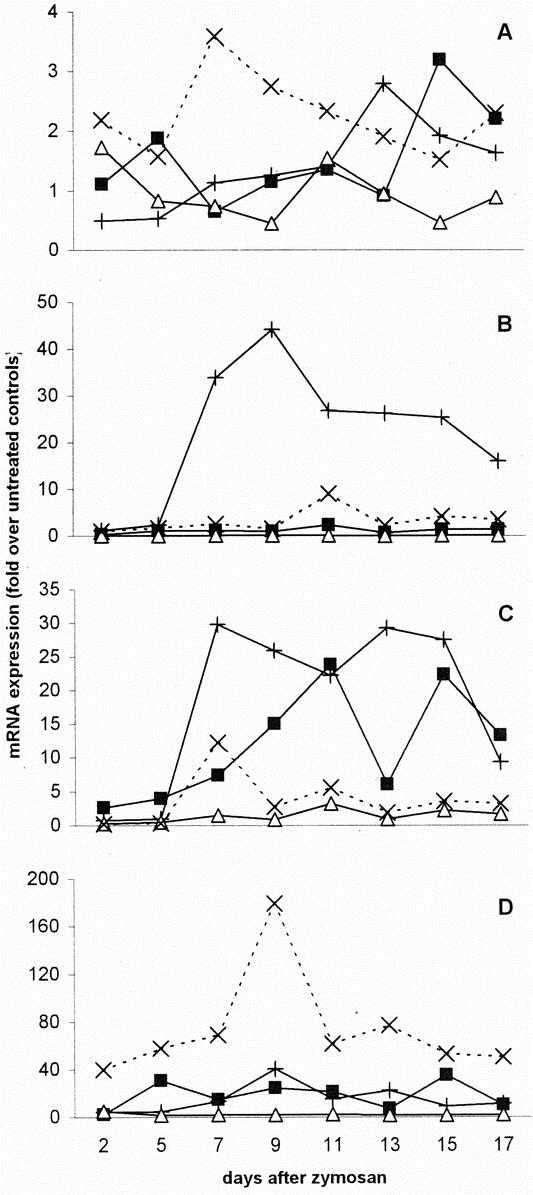
FIGURE 5. Up-regulation of MIF (A), IL-12 (B), IFN-γ (C), and IL-10 (D) mRNA. The degree of up-regulation was calculated for each animal as the mRNA expression at any time point in relation to the median mRNA expression in control mice. Data are represented as medians. +, liver; ▪, lungs; Δ, spleen; ×, kidneys, n = 6 per organ per time point.
IL-12 mRNA Expression
The up-regulation of IL-12 message in the liver was high: after day 5, the level of mRNA quickly increased to 44 times the level in control animals at day 9 (Fig. 5B). Thereafter it slowly subsided but remained significantly elevated until day 17. In neither lungs nor spleen, an increase of IL-12 message was observed. In fact, in the spleen there appeared to be a substantial down-regulation of IL-12 message. In the kidneys, IL-12 mRNA did not change until day 11, when there was a 9-fold increase which slowly disappeared with time.
IFN-γ mRNA Expression
There was an increased expression of IFN-γ mRNA in all organs except for the spleen (Fig. 5C). In the liver, the mRNA level sharply increased after day 5, and remained high until day 15. In the lungs, the presence of IFN-γ mRNA gradually increased until day 11, where levels were 24-fold up-regulated. In the kidneys, the IFN-γ mRNA expression increased from a 6-fold down-regulation at day 2 to a 12-fold up-regulation at day 7. After that, the level of mRNA fluctuated around 3 times the levels of controls.
IL-10 mRNA Expression
In most organs, IL-10 mRNA expression was substantially elevated (Fig. 5D). Up-regulation was most explicit in the kidneys. However, here the constitutive expression in control animals was extremely low. In the liver, the level of up-regulation increased from 4-fold at day 2 to 40-fold at day 9. After that, the IL-10 mRNA expression decreased again. In the lungs, the expression of IL-10 mRNA was also up-regulated, but it strongly fluctuated with time. It was maximal at day 15, when the expression was 35 times the level of controls. The IL-10 mRNA expression in the spleen was not much higher than in control animals.
DISCUSSION
The development of MODS in this animal model is accompanied by massive up-regulation of the mRNAs for multiple proinflammatory cytokines in several organs. In the early days after zymosan administration, during the acute peritonitis phase, up-regulation appears to be limited. During the period of apparent recovery, cytokine mRNA expression strongly increases, mostly reaching its maximum at day 9 when deterioration of the clinical condition has already set in.
The cytokines that were examined in this study have all been related to systemic inflammation2 and could therefore play a role in the pathophysiology of MODS. Of the cytokines examined, the up-regulation of TNF-α mRNA is most pronounced, especially in the lungs and liver. The rise in TNF-α mRNA in the lungs precedes that in the liver, which agrees with the general observation that the lungs are the first organs affected during the development of MODS.
These findings, which indicate a major role for TNF-α in the pathophysiology, extend and support data previously reported. We have found elevated levels of TNF-α in the circulation during the third phase as well as a significantly enhanced LPS-stimulated production of TNF-α by peritoneal cells, predominantly macrophages, over the entire experimental period.10 Moreover, in TNF-α-lymphotoxin-α knockout (TNF/LT−/−) mice both survival and clinical condition were improved after zymosan challenge if compared with their wild-type controls.18 Similar results have been reported by others for TNF receptor p55 knockout mice.19 Although all these data suggest an important role for TNF-α in the development of organ damage, it is unlikely to be the only mediator responsible since TNF/LT−/− mice still develop organ damage.18 Also, intervention studies directed at TNF-α using a specific antibody, chlorpromazine and IL-10, respectively, could mitigate but not prevent the symptoms of zymosan-induced MODS.20–22
The results of the current study underscore a role for other cytokines. In several organs the mRNA expression of the proinflammatory cytokines IL-1β, IL-6, IL-12, and IFN-γ was elevated at certain time points, although the degree of up-regulation was not as high as for TNF-α. Plasma concentrations of IL-1β and IL-6 are consistent predictors of outcome in patients with the adult respiratory distress syndrome.23 Because TNF-α induces the synthesis of IL-1 and IL-6 in many cell types, the up-regulation of these 2 cytokines in this study might be explained by the up-regulation of TNF-α. However, this effect cannot occur in TNF knockout mice, and these mice still develop organ damage. Cuzzocrea et al24 found an improved clinical condition in a nonseptic shock model using either IL-6 knockout mice or antibodies against IL-6, suggesting a major role of IL-6 in systemic inflammation. Also, concentrations of circulating IL-6 have been found to parallel disease severity in septic patients.25 However, IL-6 is fairly well tolerated when given to dogs,26 making it unlikely that IL-6 is the driving force behind the physiology of inflammatory diseases.
IL-12 and IFN-γ are produced during sepsis and endotoxemia,27–29 and are necessary for an adequate immune response against invading microorganisms.30,31 However, IL-12 and IFN-γ may also play a detrimental role in a systemic inflammatory response. Administration of anti-IL-12 antibodies in a murine model of endotoxemia resulted in a lower mortality.32 Also, Lauw et al33 found that a single injection of IL-12 caused a delayed and sustained activation of multiple inflammatory pathways in the absence of detectable plasma concentrations of TNF and IL-1β, suggesting that these pathways are independent of these 2 potent proinflammatory cytokines. Since IL-12 induces IFN-γ production by T cells and natural killer cells,30 it cannot be ruled out that at least a part of the observed effects in these studies may be contributed to IFN-γ.
Because in this study mRNAs of multiple cytokines are up-regulated, blocking multiple cytokines simultaneously is likely to give the best results in intervention studies. Since the expression of TNF-α, IL-1β, IL-6 and IL-12 is nuclear factor kappa B (NFκB) mediated,34 intervention studies with NFκB inhibitors seem an obvious way to go. Unfortunately, there is still no specific NFκB inhibitor available that can be used in vivo.
In this model, we did not find a high level of up-regulation of MIF mRNA in any organ. The murine genome contains several pseudogenes for MIF. It is, however, very unlikely that these can confound our quantitative PCR, since transcription of MIF pseudogenes has never been observed.35 Our finding of limited up-regulation of MIF message does, however, not necessarily mean that MIF does not play an important role in the onset of MODS in mice. The expression of MIF mRNA was very high in most organs, but since MIF mRNA was constitutively expressed, this did not result in a high level of up-regulation. Monocytes/macrophages have been shown to contain large quantities of preformed MIF that is released after several stimuli, such as LPS or TNF-α.36 Therefore, MIF mRNA production might not be a good predictor of actual MIF activity.
In the liver and lungs, but especially in the kidneys we found a high level of up-regulation of IL-10. This cytokine is regarded as an anti-inflammatory cytokine because of its inhibitory effect on the production of IL-1α, IL-1β, IL-6, IL-8, TNF-α and IFN-γ.37 The release of IL-10 by macrophages in response to LPS is regarded as a natural antiinflammatory response mitigating cytokine production.16 Also, IL-10 is produced in patients with circulatory shock from septic and nonseptic origin, and its production correlates positively with the intensity of the inflammatory response.38 It is conceivable that also in this model for MODS, IL-10 is produced to mitigate the severe inflammatory response. The extremely elevated IL-10 mRNA levels observed in the kidneys could possibly provide an explanation for the fact that the organ damage in the kidneys in this model is limited compared with liver, lungs and spleen. To our knowledge, there are no related pathologic conditions in which IL-10 is abundantly expressed in kidneys.
The liver was the organ in which the most cytokine mRNA up-regulation could be seen. Except for MIF, all examined cytokines were up-regulated more than 10-fold at any time point in the liver, whereas in the lungs this was only the case for TNF-α, IFN-γ, and IL-10 and in the spleen for no cytokine at all. In the kidneys, however, all examined cytokines except MIF and IL-12 were up-regulated more than 10-fold at any time point. This is not completely in agreement with the occurrence of organ damage, because the damage in the lungs is the most severe, whereas the kidneys are relatively unaffected. If, however, the occurrence of organ damage is mainly mediated by TNF-α, this would provide an explanation for the severe lung damage observed in this model, since the up-regulation of TNF-α was extremely high in the lungs.
The current data pertain to cytokine message and not to actual levels of cytokine protein. It is generally believed that a strongly increased presence of mRNA, such as demonstrated here, will translate into increased levels of the biologically active protein. However, as with all studies on gene expression, one should realize that a discrepancy between protein production and mRNA levels remains possible. Still, with the techniques available it is extremely difficult to quantitate tissue levels of mediator proteins such as cytokines.
The experimental procedures used in this study do not allow the identification of the cell types responsible for the increased cytokine mRNA expression in the organs. Previous studies in our laboratory5,18 have demonstrated an influx of inflammatory cells in the various tissues during the development of organ damage. For instance, there is an influx of macrophages and neutrophils in the liver, there are accumulations of lymphocytes, plasma cells and neutrophils in the lungs, and accumulations of macrophages in the capsule of the spleen. Although it seems likely that these inflammatory cells are responsible for the increased presence of cytokine mRNA, we cannot rule out that resident cells also exhibit an increased gene expression.
The overall view that arises from the current data is that the up-regulation of mRNA for a number of pro-inflammatory mediators becomes most explicit from 5 days after the zymosan challenge onwards, coinciding in time with the development of microscopic organ damage as reported before.5 This finding is of particular interest with respect to future intervention studies. Because cytokine mRNA levels only peak after the onset of the MODS-like phase and up-regulation appears limited in the early days, there seems to be ample room for interventions after the initial challenge, perhaps even extending well into the second – recovery – phase of the model. Obviously, one should be exceedingly careful to extrapolate the results to the clinical situation. Even so, if we hypothesize that the systemic inflammation, which is believed to be the driving force for the development of MODS in patients, comprises a similar pattern of cytokine mRNA up-regulation, this would offer a window of opportunity for intervention well after the original insult. Next to the conclusion that most likely multiple cytokines should be targeted, this appears a promising finding which needs to be explored further.
ACKNOWLEDGMENTS
The authors thank Louis van der Locht (Department of Hematology) for his expert technical assistance with the real-time PCR procedures.
Footnotes
Reprints: T. Hendriks, PhD, Department of Surgery, University Medical Center Nijmegen, PO Box 9101, 6500 HB Nijmegen The Netherlands. E-mail: t.hendriks@chir.umcn.nl.
REFERENCES
- 1.Seely AJ, Christou NV. Multiple organ dysfunction syndromes: exploring the paradigm of complex nonlinear systems. Crit Care Med. 2000;28:2193–2200. [DOI] [PubMed] [Google Scholar]
- 2.Marshall JC. Inflammation, coagulopathy, and the pathogenesis of multiple organ dysfunction syndrome. Crit Care Med. 2001;29:S99–s106. [DOI] [PubMed] [Google Scholar]
- 3.Papathanassoglou ED, Moynihan JA, Ackerman MH. Does programmed cell death (apoptosis) play a role in the development of multiple organ dysfunction in critically ill patients? A review and a theoretical framework. Crit Care Med. 2000;28:537–549. [DOI] [PubMed] [Google Scholar]
- 4.Goris RJ, Boekholtz WK, van Bebber IP, et al. Multiple-organ failure and sepsis without bacteria. An experimental model. Arch Surg. 1986;121:897–901. [DOI] [PubMed] [Google Scholar]
- 5.Jansen MJ, Hendriks T, Verhofstad AA, et al. Gradual development of organ damage in the murine zymosan-induced multiple organ dysfunction syndrome. Shock. 1997;8:261–267. [DOI] [PubMed] [Google Scholar]
- 6.Volman TJH, Goris RJ, van der Jagt M, et al. Organ damage in zymosan-induced multiple organ dysfunction syndrome in mice is not mediated by inducible nitric oxide synthase. Crit Care Med. 2002;30:1553–1559. [DOI] [PubMed] [Google Scholar]
- 7.Demling R, Lalonde C, Youn YK, et al. Lung oxidant changes after zymosan peritonitis: relationship between physiologic and biochemical changes. Am Rev Respir Dis. 1992;146:1272–1278. [DOI] [PubMed] [Google Scholar]
- 8.Shayevitz JR, Miller C, Johnson KJ, et al. Multiple organ dysfunction syndrome: end organ and systemic inflammatory response in a mouse model of nonseptic origin. Shock. 1995;4:389–396. [PubMed] [Google Scholar]
- 9.Cuzzocrea S, McDonald MC, Mazzon E, et al. Beneficial effects of tempol, a membrane-permeable radical scavenger, on the multiple organ failure induced by zymosan in the rat. Crit Care Med. 2001;29:102–111. [DOI] [PubMed] [Google Scholar]
- 10.Jansen MJ, Hendriks T, Vogels MT, et al. Inflammatory cytokines in an experimental model for the multiple organ dysfunction syndrome. Crit Care Med. 1996;24:1196–1202. [DOI] [PubMed] [Google Scholar]
- 11.Marshall JC, Creery D. Pre-clinical models of sepsis. Sepsis. 1998;2:187–197. [DOI] [PMC free article] [PubMed] [Google Scholar]
- 12.Roumen RM, Hendriks T, Ven-Jongekrijg J, et al. Cytokine patterns in patients after major vascular surgery, hemorrhagic shock, and severe blunt trauma. Relation with subsequent adult respiratory distress syndrome and multiple organ failure. Ann Surg. 1993;218:769–776. [DOI] [PMC free article] [PubMed] [Google Scholar]
- 13.Borrelli E, Roux-Lombard P, Grau GE, et al. Plasma concentrations of cytokines, their soluble receptors, and antioxidant vitamins can predict the development of multiple organ failure in patients at risk. Crit Care Med. 1996;24:392–397. [DOI] [PubMed] [Google Scholar]
- 14.Panacek EA, Kaul M. IL-6 as a marker of excessive TNF-alfa activity in sepsis. Sepsis. 1999;3:65–73. [Google Scholar]
- 15.Geppert A, Steiner A, Zorn G, et al. Multiple organ failure in patients with cardiogenic shock is associated with high plasma levels of interleukin-6. Crit Care Med. 2002;30:1987–1994. [DOI] [PubMed] [Google Scholar]
- 16.Marchant A, Bruyns C, Vandenabeele P, et al. Interleukin-10 controls interferon-gamma and tumor necrosis factor production during experimental endotoxemia. Eur J Immunol. 1994;24:1167–1171. [DOI] [PubMed] [Google Scholar]
- 17.Chomczynski P, Sacchi N. Single-step method of RNA isolation by acid guanidinium thiocyanate-phenol-chloroform extraction. Anal Biochem. 1987;162:156–159. [DOI] [PubMed] [Google Scholar]
- 18.Volman TJH, Hendriks T, Verhofstad AA, et al. Improved survival of TNF-deficient mice during the zymosan-induced multiple organ dysfunction syndrome. Shock. 2002;17:468–472. [DOI] [PubMed] [Google Scholar]
- 19.Burdon D, Tiedje T, Pfeffer K, et al. The role of tumor necrosis factor in the development of multiple organ failure in a murine model. Crit Care Med. 2000;28:1962–1967. [DOI] [PubMed] [Google Scholar]
- 20.Jansen MJ, Hendriks T, Hermsen R, et al. A monoclonal antibody against tumour necrosis factor-alpha improves survival in experimental multiple organ dysfunction syndrome. Cytokine. 1998;10:904–910. [DOI] [PubMed] [Google Scholar]
- 21.Jansen MJ, Hendriks T, Knapen MF, et al. Chlorpromazine down-regulates tumor necrosis factor-alpha and attenuates experimental multiple organ dysfunction syndrome in mice. Crit Care Med. 1998;26:1244–1250. [DOI] [PubMed] [Google Scholar]
- 22.Jansen MJ, Hendriks T, de Man BM, et al. Interleukin 10 mitigates the development of the zymosan-induced multiple organ dysfunction syndrome in mice. Cytokine. 1999;11:713–721. [DOI] [PubMed] [Google Scholar]
- 23.Meduri GU, Headley S, Kohler G, et al. Persistent elevation of inflammatory cytokines predicts a poor outcome in ARDS. Plasma IL-1 beta and IL-6 levels are consistent and efficient predictors of outcome over time. Chest. 1995;107:1062–1073. [DOI] [PubMed] [Google Scholar]
- 24.Cuzzocrea S, de Sarro G, Costantino G, et al. Role of interleukin-6 in a non-septic shock model induced by zymosan. Eur Cytokine Netw. 1999;10:191–203. [PubMed] [Google Scholar]
- 25.Damas P, Ledoux D, Nys M, et al. Cytokine serum level during severe sepsis in human IL-6 as a marker of severity. Ann Surg. 1992;215:356–362. [DOI] [PMC free article] [PubMed] [Google Scholar]
- 26.Preiser JC, Schmartz D, Van der Linden P, et al. Interleukin-6 administration has no acute hemodynamic or hematologic effect in the dog. Cytokine. 1991;3:1–4. [DOI] [PubMed] [Google Scholar]
- 27.Calandra T, Baumgartner JD, Grau GE, et al. Prognostic values of tumor necrosis factor/cachectin, interleukin-1, interferon-alpha, and interferon-gamma in the serum of patients with septic shock. Swiss-Dutch J5 Immunoglobulin Study Group. J Infect Dis. 1990;161:982–987. [DOI] [PubMed] [Google Scholar]
- 28.Heinzel FP, Rerko RM, Ling P, et al. Interleukin 12 is produced in vivo during endotoxemia and stimulates synthesis of gamma interferon. Infect Immun. 1994;62:4244–4249. [DOI] [PMC free article] [PubMed] [Google Scholar]
- 29.Hazelzet JA, Kornelisse RF, Pouw-Kraan TC, et al. Interleukin 12 levels during the initial phase of septic shock with purpura in children: relation to severity of disease. Cytokine. 1997;9:711–716. [DOI] [PubMed] [Google Scholar]
- 30.Curfs JH, Meis JF, Hoogkamp Korstanje JA. A primer on cytokines: sources, receptors, effects, and inducers. Clin Microbiol Rev. 1997;10:742–780. [DOI] [PMC free article] [PubMed] [Google Scholar]
- 31.Zantl N, Uebe A, Neumann B, et al. Essential role of gamma interferon in survival of colon ascendens stent peritonitis, a novel murine model of abdominal sepsis. Infect Immun. 1998;66:2300–2309. [DOI] [PMC free article] [PubMed] [Google Scholar]
- 32.Wysocka M, Kubin M, Vieira LQ, et al. Interleukin-12 is required for interferon-gamma production and lethality in lipopolysaccharide-induced shock in mice. Eur J Immunol. 1995;25:672–676. [DOI] [PubMed] [Google Scholar]
- 33.Lauw FN, Dekkers PE, te-Velde AA, et al. Interleukin-12 induces sustained activation of multiple host inflammatory mediator systems in chimpanzees. J Infect Dis. 1999;179:646–652. [DOI] [PubMed] [Google Scholar]
- 34.Sun Z, Andersson R. NF-kappaB activation and inhibition: a review. Shock. 2002;18:99–106. [DOI] [PubMed] [Google Scholar]
- 35.Kozak CA, Adamson MC, Buckler CE, et al. Genomic cloning of mouse MIF (macrophage inhibitory factor) and genetic mapping of the human and mouse expressed gene and nine mouse pseudogenes. Genomics. 1995;27:405–411. [DOI] [PubMed] [Google Scholar]
- 36.Calandra T, Bernhagen J, Mitchell RA, et al. The macrophage is an important and previously unrecognized source of macrophage migration inhibitory factor. J Exp Med. 1994;179:1895–1902. [DOI] [PMC free article] [PubMed] [Google Scholar]
- 37.Smith EM, Cadet P, Stefano GB, et al. IL-10 as a mediator in the HPA axis and brain. J Neuroimmunol. 1999;100:140–148. [DOI] [PubMed] [Google Scholar]
- 38.Marchant A, Alegre ML, Hakim A, et al. Clinical and biological significance of interleukin-10 plasma levels in patients with septic shock. J Clin Immunol. 1995;15:266–273. [DOI] [PubMed] [Google Scholar]