

Abstract
Background:
Predictive nomograms are becoming increasingly used to define and predict outcome. They can be developed at presentation or following treatment and include variables not conventionally used in standard staging systems.
Methods:
We use a predictive nomogram based on prospectively collected data from 555 pancreatic resections for adenocarcinoma at a single institution. At last follow-up, 481 (87%) had died, defining a mature and comprehensive database. We used a 1-, 2-, and 3-year follow-up, as the number of patients alive beyond 3 years is sufficiently limited to provide insufficient events.
Results:
Based on a Cox model, we then developed a nomogram that predicts the probability that a patient will survive pancreatic cancer for 1, 2, and 3 years from the time of the initial resection, assuming that there is not death from an alternate cause. Calibration between observed and corrected is good, and variables not conventionally associated with standard staging systems improved the predictivity of the model.
Conclusions:
This nomogram can serve as a basis for investigating other potentially predictive variables that are proposed of prognostic importance for patients undergoing resection for adenocarcinoma of the pancreas.
Predictive nomograms for outcome provide the opportunity to include multiple predictive risk factors in a readily computed format that is widely applicable. We provide a simple nomogram for resected adenocarcinoma of the pancreas that provides greater accuracy in outcome prediction than conventional staging systems.
Adenocarcinoma of the pancreas remains a lethal disease. The majority of the 25,000 new patients per year who develop this disease in the United States will go on to die of disease, most within 2 years. Currently, operation with resection is the only effective therapy that offers any prospect of significant prolongation of survival. Multiple previous studies have demonstrated that clinicopathologic factors such as tumor size, histologic differentiation, margin status, and nodal involvement are statistically significant prognostic variables.1,2 Nevertheless, the number of patients alive at 5 years makes these prognostic variables only marginally influential. Current staging systems rely on the T, N, and M stage. Given the overall poor prognosis, the TNM system is variably applied and relatively nondiscriminatory for the resected patient.
Nomograms are progressively more accepted as models in which known prognostic factors can be combined and used for risk prediction.3 These are statistically based tools that provide overall probability of a specific outcome, ie, death of disease, for an individual patient, but are not new.4 In the main, nomograms will include factors included in any clinical staging system, but will add other factors known to have impact on outcome. Developing a nomogram requires an extensive database with long-term follow-up. As we have such a database, the aim of this study was to define a nomogram for resected adenocarcinoma of the pancreas.
MATERIALS AND METHODS
From a prospective database of patients resected with pancreatic ductal adenocarcinoma in a single institution between October 1983 and April 2000, we collected clinicopathological and operative data on 555 resected patients. All patients had pathology review to confirm pancreatic adenocarcinoma. Follow-up extended to March of 2002 with a primary end-point disease-specific survival.
Procedure
The majority of patients had lesions confined to the head of the pancreas and therefore underwent pancreaticoduodenectomy. Laparoscopy was progressively part of our operative procedure in the majority of these patients (Table 1). Anesthesia time was a median of 350 minutes with an estimated blood loss of 1000 mL and median length of stay of 15 days (median 9 days for 2002). Perioperative mortality was 3%.
TABLE 1. Operative Details: Patients Undergoing Resection for Adenocarcinoma of the Pancreas at Memorial Sloan-Kettering Cancer Center From October 1983 to April 2000

Statistical Analysis
Estimates of disease-specific death were calculated with the cumulative incidence method. Multivariable analysis was conducted with Cox proportional hazards regression. The proportional hazards assumption was verified by tests of correlations with time and examination of residual plots. To permit nonlinear relationships, continuous variables were modeled with restricted cubic splines.5 All decisions with respect to the grouping of the categorical variables were made prior to modeling, as making these decisions afterward can have deleterious effects on the predictive ability of the model.5 This Cox model was the basis for a nomogram, and our modeling and validation procedure is similar to that used previously.6
Some patients had missing values [differentiation (N = 26), posterior margin (N = 20), T stage (N = 27), and max path axis (N = 1)]. Rather than omit the patients, missing values were imputed (ie, predicted) with regression models7 containing all of the predictor variables. Imputing a missing value is generally preferred to deleting a patient's entire medical record so that the maximum information is used and the bias that may result from a deleted case can be avoided.5
Nomogram validation contained 2 components. First, the nomogram was subjected to bootstrapping, with 200 resamples, as a means of calculating a relatively unbiased measure of its ability to discriminate among patients, as quantified by the concordance index.5 The interpretation of the concordance index is similar to that of the area under the receiver operating characteristic curve.8 The concordance index is the probability that, given 2 randomly drawn patients, the patient who dies first had a lower probability of survival. Note that this calculation assumes that the patient with the shorter follow-up fails. If both patients fail at the same time, or the surviving patient has shorter follow-up, the probability does not apply to that pair of patients. The second validation component was to compare predicted probability of survival versus actual survival (ie, nomogram calibration) on the entire sample, again using 200 bootstrap resamples to reduce overfit bias, which would overstate the accuracy of the nomogram. All analyses were performed using S-Plus (Version 2000 Professional, Redmond, WA) with the Design9 and Hmisc9 libraries.
RESULTS
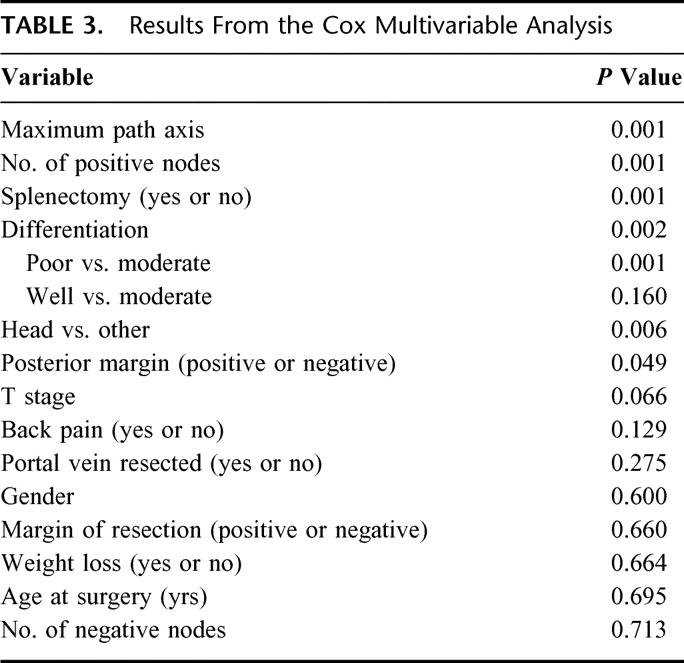
The descriptive statistics for the patients with pancreatic cancer are listed in Table 2. Their disease-specific death, with number of patients at risk over time, is illustrated in Figure 1. At last follow-up, 481 patients had died, and the median follow-up for the living patients was 47 months (range 6–184 months). On the basis of the maturity of the data (ie, number of patients at risk), we felt we would be able to reliably predict disease-specific survival to 3 years with reasonably narrow confidence intervals. It seemed that this was the most distant time point with many patients at risk (n = 105). A Cox regression model was fit, without violation of the proportional hazards assumption (P = 0.13). The results of the Cox model are in Table 3.
TABLE 2. Descriptive Statistics for Pancreatic Cohort
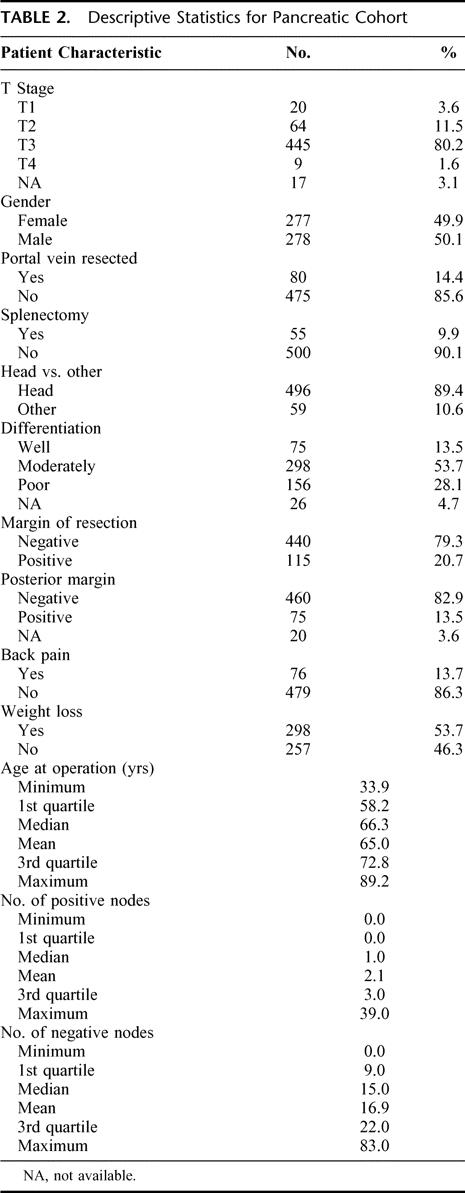
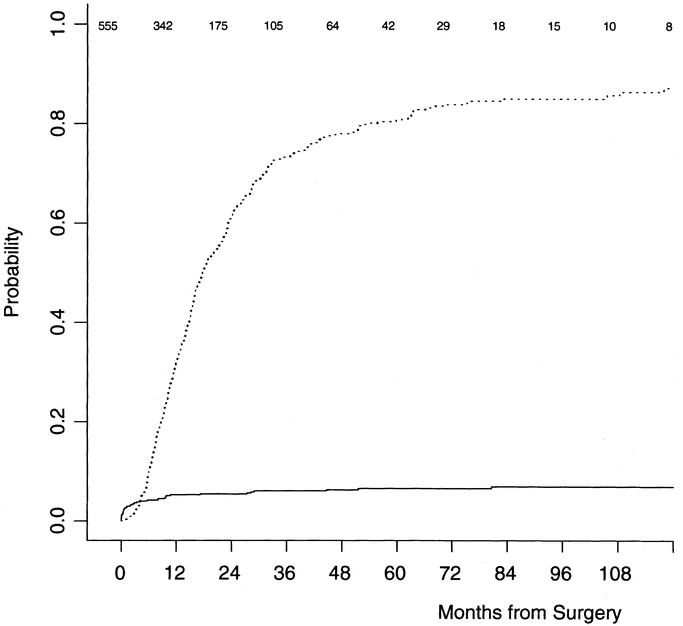
FIGURE 1. Disease-specific (dotted line) and other cause (solid line) probability of death. Figures at top indicate number of patients at risk.
TABLE 3. Results From the Cox Multivariable Analysis
A nomogram based on the Cox model is in Figure 2. The nomogram predicts the probability that the patient will survive pancreatic cancer for 1, 2, and 3 years from initial surgery, assuming he or she does not die of another cause first. The bootstrap-corrected concordance index is 0.64. A calibration curve appears in Figure 3. The predicted probabilities of the nomogram are closely aligned with the actual survival estimates.

FIGURE 2. Nomogram for predicting 12-, 24-, and 36-month disease-specific survival probabilities.
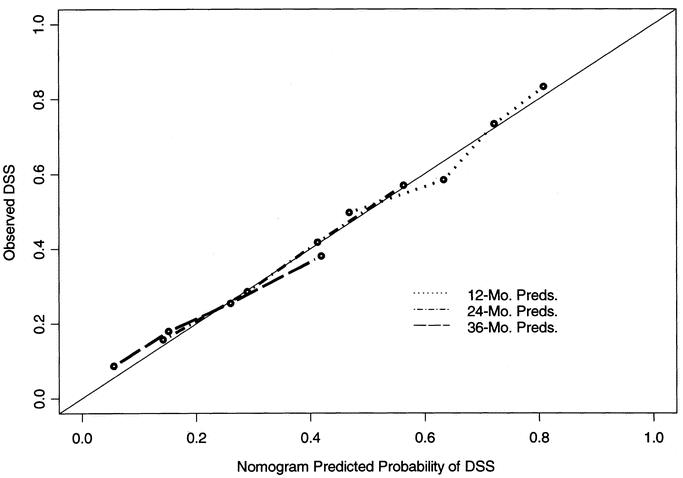
FIGURE 3. Calibration of the nomogram. Bootstrapping was used to correct for optimistic bias. X-axis is nomogram-predicted probability of survival. Y-axis is observed disease-specific survival.
For example, a poorly differentiated >4 cm lesion in the pancreatic head with negative surgical margins, but 10 positive lymph nodes, would garner 225 points or a less than 10% 36-month disease-specific survival probability.
Similarly, a well-differentiated 1 cm lesion in the pancreatic head with negative margins and nodes would have a 50% 3-year disease-specific survival probability.
DISCUSSION
The patient with a resected pancreatic adenocarcinoma has a very high probability of ultimately dying of his or her disease. An important issue rather than median survival is the possibility that the patient will or will not survive a defined period of time. We have used in this nomogram the probability of surviving to 3 years as an alternate to the median survival time commonly stated of approximately 16 to 18 months.1,2,10–14
Current staging systems use T, N, and M (American Joint Committee on Cancer [AJCC] Cancer Staging Manual, 6th edition, 2002) but poorly discriminate (Table 4). We conducted an additional analysis to determine whether the nomogram represents improvement over the staging system. For this analysis, we omitted each patient and refit the Cox model on the remaining patients, and then predicted the probability of survival for this omitted patient (ie, jackknife nomogram predictions). The nomogram predictions discriminated better than did the AJCC stage (0.64 versus 0.56, P < 0.001). In this regard, our nomogram represents an improvement over counseling on the basis of the AJCC staging system by offering a more discriminating prediction method. Figure 4 illustrates the heterogeneity within the staging system predictions. For each stage is a histogram of the nomogram-predicted probabilities. Note the heterogeneity of the stage II and III patients’ nomogram predictions. Clearly, patients with stage II and III have far more variable survival (by AJCC, 6th edition) than expected based on stage alone.
TABLE 4. Current Staging Systems Utilize T, N, and M (AJCC Cancer Staging Manual, 6th Edition, 2002)
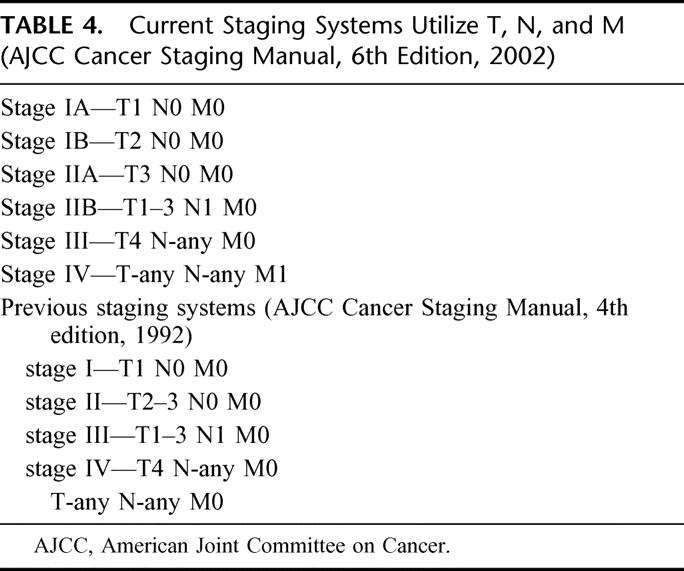

FIGURE 4. Comparisons of nomogram predictions with those of AJCC stage groupings. Note the heterogeneity of predicted probabilities of survival within each AJCC stage, especially in stages II and III.
Most of resected patients are IIB, dependent only on the diligence with which lymph nodes are looked for, eg, in a span of 5 years from 1996 to 2001, of 321 resected patients, 209 (65%) had positive nodes.
Some items in the nomogram are not intuitively obvious, nor are they continuous variants, eg, a resected tail lesion is better than a resected head lesion. We expect that this is due to the observation that although overall survival of all body-tail lesions is worse than head lesions, resectability is also lower, such that when resection is possible, a more favorable cohort has been selected.
Similarly, T stage does not appear to be logically ordered. There are ready explanations for this; T stage is inaccurately recorded, as definitive size measurements are difficult and the distinction between T3 and T4 is now (AJCC Cancer Staging Manual, 6th edition) one of resectability rather than size or invasion per se, whereas T3 was previously a comment on extrapancreatic extension (AJCC Cancer Staging Manual, 4th edition, 1992) and T4 was not included. Furthermore, T stage was not statistically significant in the Cox model. Note that statistically insignificant predictors were not omitted from the Cox regression model or resulting nomogram, because doing so actually tends to harm predictive accuracy.5
Similarly, maximum path axis (“size”) does not have a monotonic effect due to similar criteria, ie, path size recorded predominately as >2 or >4 rather than actual measurements. There may well be a biologic reason why very large tumors do better. We have shown that a number of our 10-year survivors do have large tumors. Presumably, if one gets to a large tumor without metastasis, then the outcome is more favorable.
This postresection nomogram takes into account a greater number of factors than the diagnosis alone of adenocarcinoma of the pancreas by adding in known statistically predictive variables, which of themselves have only limited impact at the 4- or 5-year period. This allows a much more realistic appreciation to an individual patient in determining if that patient will be alive at a defined period of time.
There are limitations to any analysis of this type. There can never be enough predictive variables included in such a nomogram to give absolute predictions. Known variables may not be included because of the lack of numbers or observations, or there may be markers as yet unidentified that predict outcome. Nevertheless, such nomograms would allow a test model for the development of new molecular markers, which can be controlled with such a model to see if they improve prediction. We have overcome the problem of most nomograms, ie, the lack of long-term follow-up, by using a large single institution-based database where the majority of patients have been followed until death. A further problem of any such predictive system in this disease is the inability to identify microscopic metastatic disease, which is the usual mode of demise. For the individual patient, the nomogram predicts the likelihood that a population of similar patients will survive a defined period of time but certainly not the certitude that this will occur. Nevertheless, we believe that nomograms provide a more accurate prediction of what the patient might expect, as it takes into account factors not included in a simple median survival analysis (see Table 4). It would be important that such nomograms be validated in other data sets and can form the basis for added evaluation.
Nomograms are progressively being used in prostate, and soft tissue sarcoma.3,6,15 Nomograms are readily adapted to simple software and can be carried on hand held organizers such as a Palm Pilot. We plan to make this tool freely available with our others at http://www.nomograms.org.
Footnotes
Supported by the Stern Foundation.
Reprints: Murray F. Brennan, MD, Chairman, Department of Surgery, Memorial Sloan-Kettering Cancer Center, 1275 York Avenue, New York, NY 10021. E-mail: brennanm@mskcc.org.
REFERENCES
- 1.Geer RJ, Brennan MF: Prognostic indicators for survival after resection of pancreatic adenocarcinoma. Am J Surg. 1993;105:68–73. [DOI] [PubMed] [Google Scholar]
- 2.Yeo CJ, Cameron JL. Prognostic factors in ductal pancreatic cancer. Langenbecks. Arch Surg. 1998;383:129–133. [DOI] [PubMed] [Google Scholar]
- 3.Kattan MW, Leung DH, Brennan MF. Postoperative nomogram for 12-year sarcoma-specific death. J Clin Oncol. 2002;20:791–796. [DOI] [PubMed] [Google Scholar]
- 4.Banks J. Nomograms. New York, NY: Wiley; 1985. [Google Scholar]
- 5.Harrell FE, Lee KL, Mark DB. Multivariable prognostic models–issues in developing models, evaluating assumptions and adequacy, and measuring and reducing errors. Stat Med. 1996;15:361–387. [DOI] [PubMed] [Google Scholar]
- 6.Kattan MW, Eastham JA, Stapleton AMF, et al. A preoperative nomogram for disease recurrence following radical prostatectomy for prostate cancer. J Natl Cancer Inst. 1998;90:766–771. [DOI] [PubMed] [Google Scholar]
- 7.Harrell FE. Transcan: An S-Plus Function [computer program]. Program available from statlib@lib.stat.cmu.edu. Send e-mail ‘send transcan from S’; 1995.
- 8.Hanley JA, McNeil BJ. The meaning and use of the area under a receiver operating characteristic (ROC) curve. Radiology. 1982;143:29–36. [DOI] [PubMed] [Google Scholar]
- 9.Harrell FE Jr. Regression Modeling Strategies With Applications to Linear Models, Logistic Regression, and Survival Analysis. New York, NY: Springer-Verlag; 2001:19. [Google Scholar]
- 10.Conlon KC, Klimstra DS, Brennan MF. Long term survival after curative resection for pancreatic ductal adenocarcinoma: clinicopathologic analysis of 5-year survivors. Ann Surg. 1996;223:273–279. [DOI] [PMC free article] [PubMed] [Google Scholar]
- 11.Stojadinovic A, Conlon K, Brennan MF. Prospective randomized clinical trials in pancreatic cancer. Surg Oncol Clin North Am. 2002;11:207–229. [DOI] [PubMed] [Google Scholar]
- 12.Brennan MF. Periampullary and pancreatic cancer. In: Blumgart L, Fong Y, eds. Surgery of the Liver and Biliary Tract. London: W. B. Saunders Company; 2001:1060–1072. [Google Scholar]
- 13.Karpoff HM, Klimstra DS, Brennan MF, et al. Results of total pancreatectomy for adenocarcinoma of the pancreas. Arch Surg. 2001;136:44–47. [DOI] [PubMed] [Google Scholar]
- 14.Cameron JL. Long-term survival following pancreaticoduodenectomy for adenocarcinoma of the head of the pancreas. Surg Clin North Am. 1995;75:939–951. [DOI] [PubMed] [Google Scholar]
- 15.Kattan MW, Potters L, Blasko JC, et al. Pretreatment nomogram for predicting freedom from recurrence after permanent prostate brachytherapy in prostate cancer. Urology. 2001;58:393–399. [DOI] [PubMed] [Google Scholar]