

Abstract
Background:
The evaluation of thyroid nodules by fine-needle aspiration has been the standard for almost 30 years, despite significant shortcomings in sensitivity and specificity. Recent data from our laboratory have suggested that molecular profiling permits the discrimination of specific types of thyroid nodules. These studies were undertaken to determine whether molecular profiling can discriminate between benign and malignant thyroid nodules with the necessary sensitivity and specificity required of a screening test.
Methods:
Molecular profiles of 11 papillary thyroid carcinomas, 13 follicular variant of papillary thyroid carcinomas, 9 follicular thyroid carcinomas, and 26 benign tumors (follicular adenomas and hyperplastic nodules) were analyzed by oligonucleotide microarray analysis. A gene list was created based on 45 samples. Seventeen samples were then added to the analysis as unknowns. A hierarchical clustering analysis was performed on all 62 samples to examine the groups for potential differences and the ability of the gene list to distinguish tumor types.
Results:
Cluster analysis of all 62 samples produced 2 distinct groups, 1 containing the carcinomas and 1 containing the benign lesions. The sensitivity for a diagnosis of cancer was 91.7% with a specificity of 96.2% (3 follicular variant of papillary thyroid carcinomas clustered with the benign lesions). The cancer gene profiles contained both known cancer-associated genes (MET, galectin-3) and previously unidentified genes.
Conclusions:
Molecular profiling readily distinguishes between benign and malignant thyroid tumors with excellent sensitivity and specificity. Elucidated genes may provide insight into the molecular pathogenesis of thyroid cancer. Gene profiling may significantly enhance the evaluation of thyroid nodules in the future.
This study details the application of molecular profiling to differentiate benign and malignant thyroid nodules. Differentiated thyroid cancers can be distinguished from benign thyroid nodules based on gene expression profiling. Molecular profiling has the potential to impact future clinical management of thyroid nodules.
A new diagnosis of thyroid carcinoma is predicted to affect 23,600 people this year in the United States.1 The Surveillance, Epidemiology, and End Results database documents a recent rise in the number of cases of thyroid carcinoma, with an estimated increase of 3% per year in the incidence of thyroid cancer.1,2 Although the incidence of thyroid cancer appears to be increasing, the number of patients evaluated with a thyroid nodule to exclude carcinoma remains far greater. Currently, diagnostic tests for thyroid nodules are not sensitive or specific enough given the large number of benign lesions found with imaging today.3,4
The introduction of fine-needle aspiration (FNA) approximately 30 years ago significantly enhanced the ability of the clinician to diagnose and appropriately treat thyroid nodules.5,6 A reduction of more than 30% in the number of operations performed for benign disease was observed after FNA became widely used in the 1980s.7 However, since the introduction of thyroid FNA, there have been no major advances in the diagnosis of thyroid cancer, nor has the pathologic diagnosis of thyroid cancer led to better treatment algorithms.8,9 Perhaps the most important diagnostic dilemma that remains is how to manage the patient with an “indeterminate” cytology.10–14 Although the majority of these nodules ultimately prove to be either benign hyperplastic nodules or follicular adenomas, 20% to 30% prove to be follicular carcinomas or follicular variants of papillary thyroid carcinoma (FVPTCs).4,9,15,16 The patient, surgeon, and endocrinologist are left guessing as to what might be the best surgical treatment and, frequently, this decision is made on “gut feeling” or social factors.
A second shortfall of FNA is the inability to reliably identify more aggressive tumors.17,18 Although this can sometimes be determined on a clinical basis, this is not usually the case.19,20 Invasiveness and many nuclear features indicative of carcinoma are not discernible on cytology and only after surgical resection can these features be reliably diagnosed.21 Identification of more aggressive tumors preoperatively would permit more extensive surgery when indicated.
The recent application of microarray analysis to tumor biology has provided a new opportunity to study and understand cancer biology, including the identification of new genes involved in carcinogenesis and the ability to classify tumors based on gene expression profiles.22–24 We have turned to microarray analysis to characterize and classify benign and malignant follicular thyroid tumors and papillary thyroid tumors. We have identified known and unknown genes that have not been previously associated with thyroid carcinogenesis and have separately been able to reliably distinguish between benign and malignant follicular thyroid tumors, as well as benign thyroid nodules and papillary thyroid carcinomas.25,26 Here we report the ability to differentiate all common benign and malignant thyroid nodules using gene expression profiling. Additionally, we show that molecular profiling can be used to classify tumors as high risk or low risk. These studies provide a foundation for the future addition of gene profiling to thyroid FNA and ultimately enhance the office diagnosis of thyroid nodules.
MATERIALS AND METHODS
RNA Isolation
All patients undergoing thyroid surgery by one of the authors (T.J.F.) had thyroid tumor samples collected at the time of surgery. Patient age and sex were documented. Tumor tissue was dissected by a pathologist and snap frozen in liquid nitrogen and stored at −80°C. Location, size and defining characteristics of each nodule were recorded in detail. All tumor samples were obtained with permission of and in accordance with the guidelines of our Institutional Review Board and consent was obtained from all patients. Final diagnosis was confirmed with the pathology reports for each sample. RNA was extracted, following the manufacture's protocol, from each sample after homogenization in TRIzol reagent (Invitrogen, Carlsbad, CA) and RNA clean-up was performed using RNeasy Mini Kit (Qiagen Inc., Valencia, CA).
RNA Preparation
Samples were processed following the Affymetrix protocol (Affymetrix Inc., Santa Clara, CA). In brief, 8 μg of total RNA from each sample underwent 2 rounds of amplification and biotin labeling to produce biotin labeled cRNA, which was hybridized to the Affymetrix U95 GeneChip (Affymetrix Inc.). A sample aliquot was tested to insure cRNA quality, of which all samples were of good quality. The genechips were then stained with SAPE (streptavidin-phycoerythrin) and scanned in an HP ChipScanner (Affymetrix Inc.) to detect hybridization signals.
Data Analysis
After genechip signal intensity was detected and quantified using MicroArray Suite v5.0 (Affymetrix Inc.), data was exported to GeneSpring Software (Silicon Genetics, Redwood City, CA) for analysis. A total of 62 samples were analyzed: 11 papillary thyroid carcinomas (PTCs), 13 FVPTCs, 9 follicular thyroid carcinomas (FCs), 3 medullary thyroid carcinomas (MTCs), and 26 benign tumors (follicular adenomas and hyperplastic nodules). Initially, 45 samples were used as a test set to produce a list of genes that are differentially expressed between carcinomas and adenomas. The test set included 21 benign tumors (14 follicular adenomas and 7 hyperplastic nodules), 8 FVPTCs, 7 PTCs, and 9 FC. These samples were separated into 2 groups, benign (FA and HYP) and malignant (PTC, FVPTC, FC), and then analyzed with a parametric t test and multiple testing correction (Benjamini and Hochberg False Discovery Rate, with the P value set at < 0.05), producing a gene list of 627 differentially expressed genes.
Using the test set gene list, we placed the 45 samples in an unsupervised hierarchical cluster and performed a statistical analysis. This unsupervised hierarchical clustering analysis compares the signal intensity values of the genes in each sample and clusters the samples based on the similarities of gene expression over the 627 genes of the test set gene list. The cluster analysis produces a 2-dimensional dendrogram that visually represents the similarities, differences, and relative overexpression and underexpression of each gene for all of the samples clustered. Further analysis was conducted on another 14 samples. These samples (3 HYP, 2 FA, 4 PTC, and 5 FVPTC) were added to the 45-sample cluster analysis as unknowns. An unsupervised hierarchical cluster and statistical analysis was performed.
To evaluate medullary thyroid carcinoma, a similar analysis was performed. All 3 MTC samples were added to the 45-sample test set as unknowns and an unsupervised hierarchical cluster analysis was performed. Then, the 3 MTC samples, combined with the other 14 unknown samples (17 unknown samples in total) were added to the 45 samples of the test set, again as unknown samples. These 62 samples then underwent an unsupervised hierarchical cluster analysis based on the 627 differentially expressed genes from the test set, producing a two-dimensional dendrogram.
The carcinoma samples (excluding the medullary) were separated into 2 groups: high risk and low risk. This determination was based on the AMES criteria (age, metastasis, extent, size). A total of 35 tumors were evaluated (14 high risk and 21 low risk). Initial comparison was made between the 2 sets (12 high-risk tumors and 17 low-risk tumors) using a parametric test, variances not assumed equal (Welch t test, P value < 0.01) that produced a gene list of 339 differentially expressed genes. This gene list was then used for an unsupervised hierarchical cluster and statistical analysis of the 29 samples. Then the final 6 samples (2 high risk and 4 low risk) were added in as unknowns, and all 35 samples underwent an unsupervised hierarchical cluster analysis using the 339 test set gene list. A dendrogram was produced for both analyses. A separate analysis was conducted using extrathyroidal extension as an indicator of aggressiveness. Thirty-one carcinoma samples were categorized into aggressive and nonaggressive groups (10 aggressive and 21 nonaggressive); comparison of the groups produced a gene list of 215 differentially expressed genes. The remaining 4 samples (2 aggressive and 2 nonaggressive) were added to the initial 31 samples and an unsupervised hierarchical cluster analysis was performed using the 215 differentially expressed genes.
RESULTS
The average age of a patient undergoing surgery for a clinically significant thyroid nodule was 50.7 years of age (Tables 1 and 2). Females constituted the majority of patients, comprising 85.5% of all the patients, whereas only 14.5% of the patients were male. There was no significant difference in the ages of the patients with benign disease as compared with those with malignant disease (P = 0.64). There was a significant difference in the average age of patients at high risk (by AMES criteria) as compared with low risk; the average age of low-risk and high-risk patients was 45.3 years and 62 years of age, respectively (P < 0.001). Significant difference in the average age of patients designated aggressive and nonaggressive (by extrathyroidal extension) also was observed. Patients with aggressive and nonaggressive tumors were 47.6 years and 60.5 years of age, respectively (P < 0.02).
TABLE 1. Patient Demographics and Tumor Size of Benign Tumors
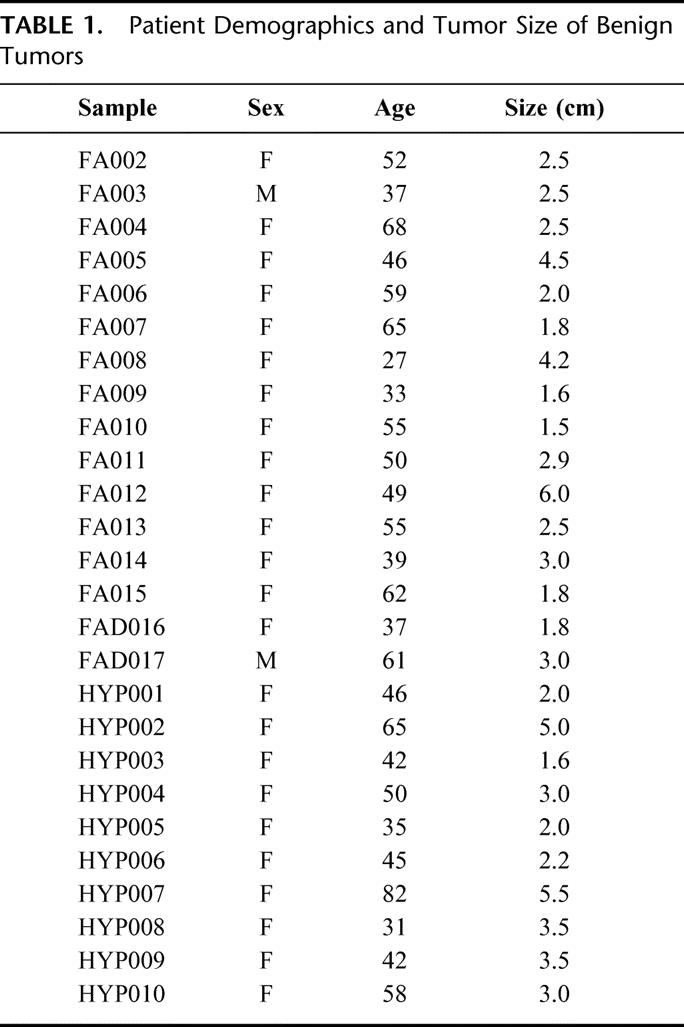
TABLE 2. Patient Demographics and Tumor Characteristics of Carcinoma Samples

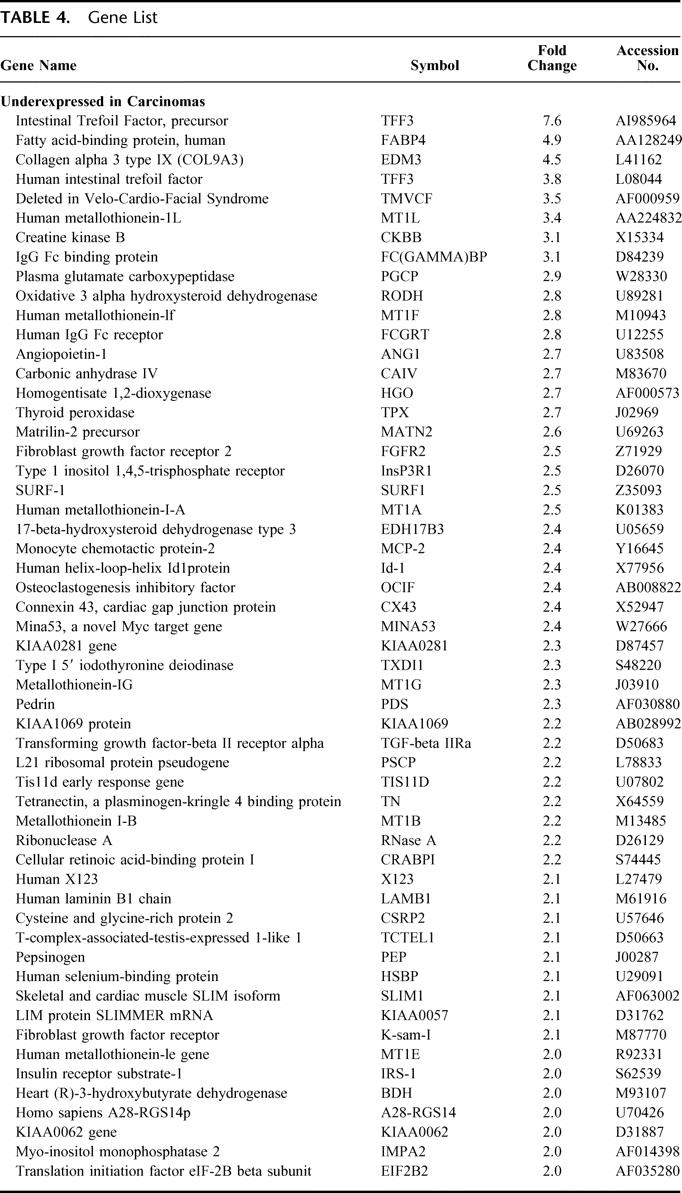
To produce a gene list that can be used for differentiating benign from malignant thyroid tumor samples, a comparison of the level of gene expression in the cancer group was made to the level of gene expression in the benign group. The resulting gene profiles of each sample produced a list of 627 differentially expressed genes, of which 133 genes were greater than 2-fold differentially expressed. The carcinoma group had 61 genes that were relatively overexpressed and 72 genes were relatively underexpressed versus the benign group (Tables 3 and 4).
TABLE 3. Gene List

TABLE 4. Gene List
GeneSpring software produced a 2-dimensional dendrogram that displays the relatedness of the tumor sample types by both the length and subdivisions of its clustering. The test set of differentially expressed genes was used in an unsupervised hierarchical clustering analysis of those same 45 samples. It produced a 2-dimensional dendrogram with 2 distinct groupings that separated the benign lesions from the carcinomas (Fig. 1). One FA was clustered with the carcinomas and 1 FVPTC was clustered with the benign lesions.
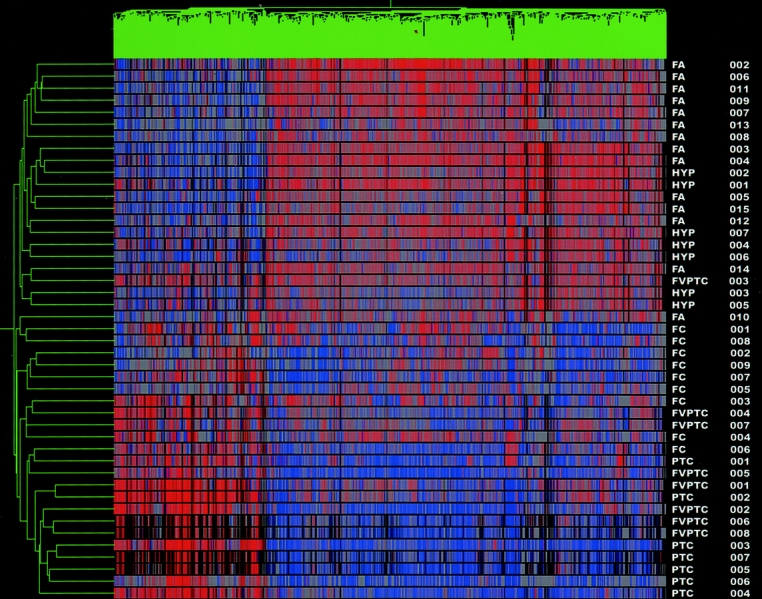
FIGURE 1. Test set cluster analysis. Dendrogram cluster analysis of 45 thyroid tumor samples (14 FA, 7 HYP, 9 FC, 7 PTC, and 8 FVPTC) based on the pattern of expression of 627 differentially expressed genes. Note 2 distinct cluster groups, distinguishing benign from malignant tumors. Red denotes relative overexpression of a gene; blue relative underexpression of a gene. The sample names are located at the right of the diagram.
Confirmation of the ability of the test set gene list to correctly cluster samples based on the expression profiles of tumors samples was undertaken. Fourteen tumor samples were added to the original 45 tumors samples from the test set and, using the 627 test set gene list, underwent an unsupervised hierarchical clustering and statistical analysis. Once again a dendrogram with 2 distinct groupings was formed, separating benign tumors from malignant tumors (Fig. 2). One FA was again clustered with the carcinomas, and 3 FVPTC were clustered with the benign lesions for a sensitivity of 90.9% and a specificity of 96.2% in the detection of cancer.
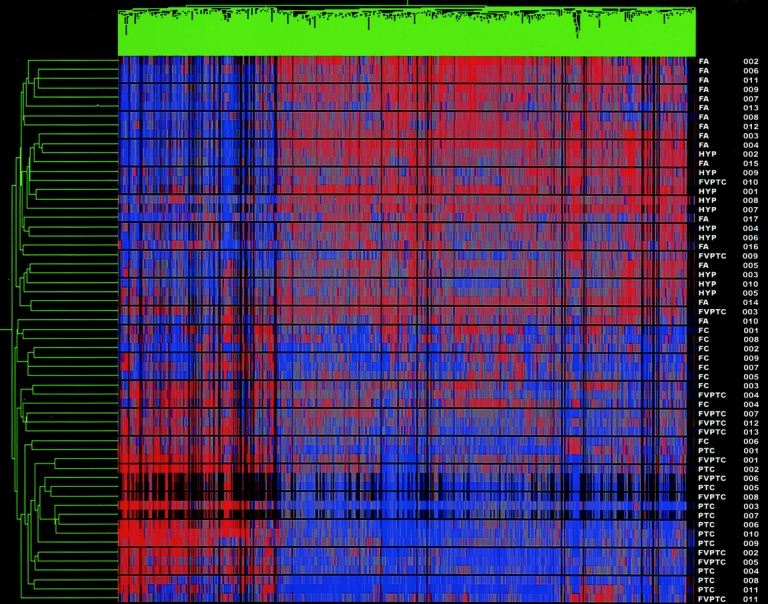
FIGURE 2. Cluster analysis of test set and unknown samples. Dendrogram cluster analysis of the 45 test set samples with 14 unknown samples (HYP 008–010, FA 016–017, PTC 008–011, FVPTC 009–013) based on the pattern of expression of 627 differentially expressed genes. Red indicates relative overexpression, blue relative underexpression. Sample names listed at the right of the diagram.
The test set gene list was then used to determine whether medullary thyroid carcinomas would also be clustered in the carcinoma group. Three MTC samples were added to the 45-test set samples as unknowns and underwent unsupervised hierarchical cluster analysis to produce a dendrogram. Two distinct groupings were identified, separating carcinomas from benign samples. All 3 MTC samples were correctly clustered with the carcinomas (data not shown).
An analysis involving all 62 samples was then undertaken. An unsupervised hierarchical cluster analysis, using the test set gene list, was performed on the 62 samples. The resulting dendrogram separated the samples into 2 distinct groups, clustering the carcinomas, including the 3 medullary thyroid carcinomas, from the benign nodules (Fig. 3). One FA was clustered with the carcinomas and 3 FVPTC were clustered with the benign tumors (as seen in the original cluster analysis) for a sensitivity of 91.7% and a specificity of 96.2% in detecting cancer.
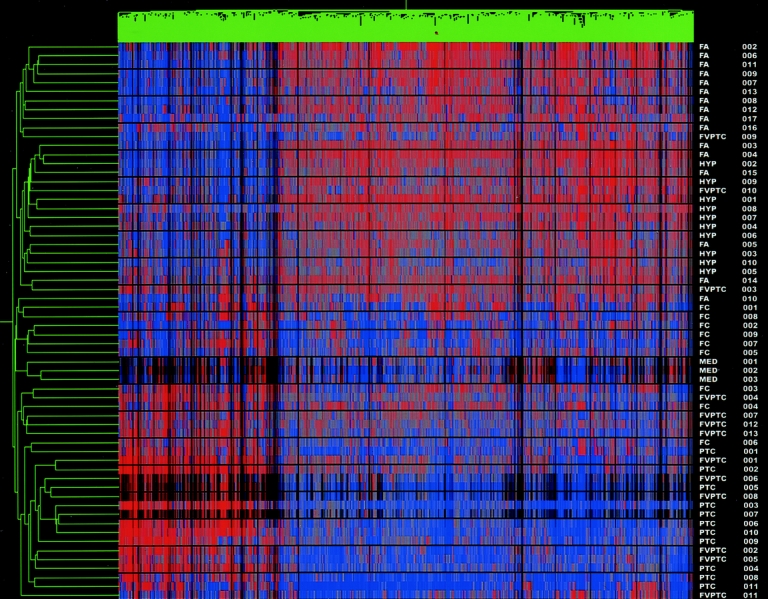
FIGURE 3. Cluster analysis of all samples (including MTC). Dendrogram cluster analysis of all 62 thyroid tumor samples, including the 3 medullary thyroid carcinomas, based on the pattern of expression of 627 differentially expressed genes. All 3 MTC clustered tightly together within the malignant group cluster. Red denotes relative overexpression of a gene; blue relative underexpression of a gene. The sample names are located at the right of the diagram.
Finally, to address whether gene profiling is capable of differentiating aggressive thyroid carcinomas from nonaggressive ones, the carcinomas were analyzed using the AMES criteria and extrathyroidal extension to place them into low- and high risk-groups, as well as aggressive and nonaggressive groups. Evaluation of high-risk and low-risk tumors revealed a list of 339 differentially expressed genes from the test set of 29 samples. Using this list for an unsupervised hierarchical cluster analysis, all 35 carcinoma samples were analyzed, producing a cluster dendrogram with 2 distinct groups (Fig. 4). Four of the low-risk samples were clustered in the high-risk group, whereas 2 high-risk samples were clustered with the low-risk group. All 6 unknown samples were correctly clustered. The sensitivity and specificity for the detection of high-risk tumors was 85.7% and 80.9%, respectively. Comparison of aggressive and nonaggressive tumors (based on extrathyroidal extension) revealed a gene list of 215 differentially expressed genes. Cluster analysis of all 35 samples (4 unknowns), using the 215 gene list, produced a dendrogram with 2 distinct cluster groups (data not shown). Four of the nonaggressive tumors were clustered with the aggressive set, whereas only 1 aggressive tumor was clustered with the nonaggressive set, for a sensitivity and specificity of 91.6% and 82.6%, respectively, in detecting aggressiveness. All unknown samples were correctly clustered.
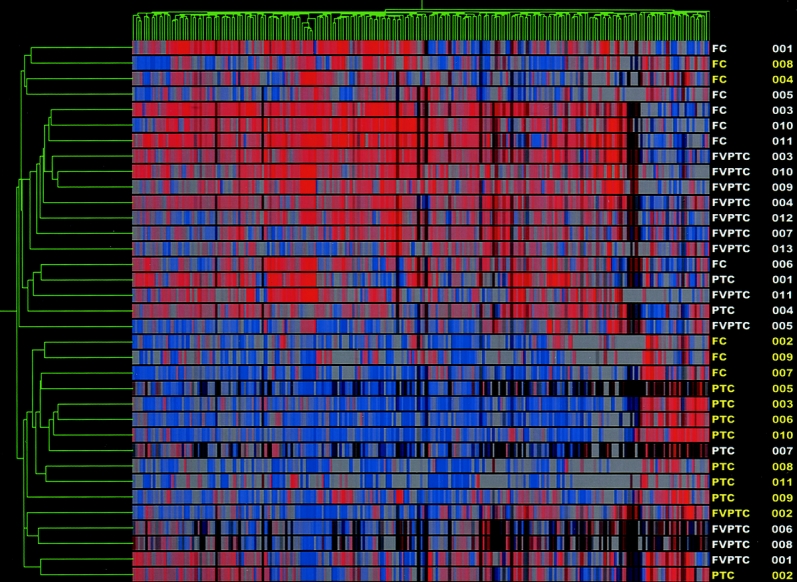
FIGURE 4. High-risk versus low-risk cluster analysis. Dendrogram cluster analysis of 35 thyroid carcinoma samples (14 high risk and 21 low risk) based on the pattern of expression of 339 differentially expressed genes. High risk tumors are highlighted in yellow.
DISCUSSION
The advances of molecular techniques during the past 10 years have led many investigators to evaluate the role of single markers for determining malignancy in thyroid carcinoma.22,23,27,28 Many that appeared quite promising as markers for carcinoma initially, including PAX8-PPARγ Galectin-3, hTERT, and MET, have proven to be neither sensitive enough for a screening test, nor specific enough for pathologic diagnosis.29–32 During the past year we have turned to gene profiling in an attempt to overcome the deficiencies of single marker analysis.25,26
Gene expression profiling is a powerful technique that is capable of providing new leads in the understanding of molecular mechanisms of tumor growth. Application of gene profiling to clinical use is just beginning, but holds great promise as well.26,27 We have previously reported the ability to differentiate follicular adenomas from follicular carcinomas using microarray analysis, while identifying genes that have previously not been associated with thyroid carcinogenesis.25 Recently we have shown that we can distinguish papillary carcinomas from benign thyroid lesions.26 However, clinically thyroid nodules do not present themselves as follicular or papillary and there is significant overlap between the 2 groups. In fact, recent reports suggest that a follicular neoplasm is at least as likely to be a FVPTC as a follicular carcinoma if it proves to be malignant.4,9,33 Here, we report that benign thyroid nodules can be almost universally distinguished from differentiated thyroid cancers using gene profiling. Furthermore, we can distinguish aggressive from nonaggressive cancers with a high sensitivity and specificity as well.
We believe that there is significant potential for gene expression profiling to impact clinical decision making in the future. Currently surgeons and endocrinologists must advise patients receiving an FNA diagnosis of follicular neoplasm that they have a 20% chance of having a malignancy.34 If the FNA contains cellular atypia the chance of malignancy increases to 40% to 50%.6 Our data show that we can separate the benign and malignant tumors into 2 distinct groups with a sensitivity of 90.9% and a specificity of 96.2% in detecting cancer. As technology improves and microarray analysis becomes more widely applicable to the small sample sizes that FNA permits, extrapolation of the data that we have presented here will allow clinicians to inform patients that they have a >90% chance that the nodule is malignant if it is a cancer with a specificity >95%. Truly benign nodules can be identified with a similar sensitivity and specificity.
Further evaluation of the cluster dendrograms (Figs. 1 and 2) reveals that within the carcinoma cluster, the majority of FC samples cluster tightly together as a separate group from the papillary thyroid carcinomas (both classic and FVPTC). This also holds true for the benign cluster group, where follicular adenomas for the most part are a subcluster, separate from the hyperplastic nodules. Despite the similarities across the gene expression profiles that facilitate the clustering of malignant from benign, the subclustering of FC from PTC/FVPTC and FA from HYP suggests that there are differences among the tumor subtypes. It is possible that future application of molecular profiling will not only permit discrimination of benign and malignant thyroid nodules, but also provide the ability to identify specific subclasses of benign and malignant tumors as additional samples are accrued in each category.
The diagnosis of medullary thyroid carcinoma usually requires confirmation by immunohistochemical staining for calcitonin, even by experienced endocrine pathologists.35,36 Sporadic MTC presenting as a thyroid nodule is a difficult diagnosis to make preoperatively, and some groups have advocated routine serum calcitonin screening of all patients who receive a cytopathologic diagnosis on FNA of follicular neoplasm, despite a very low yield.37 Here we have shown that molecular profiling clusters MTC in the malignant group. Although the sample size is small, the tight clustering of MTC in this analysis suggests that molecular profiling may be able to identify MTC without the need for immunohistochemistry. Future analysis of a greater sample number of MTC should permit evaluation of genes that may be differentially expressed between MTC and the other thyroid carcinomas.
There currently are no thyroid molecular markers in use today that have a sensitivity and specificity that compare with the molecular profiling technique that we have applied to the differentiation of benign and malignant thyroid tumors. We believe that our gene list is particularly robust. After initial analysis of 45 benign and malignant thyroid nodules, unsupervised hierarchical cluster analysis of 17 unknown samples, more than one-third of the initial set, revealed sensitivity and specificity for the diagnosis of cancer that remained essentially unchanged. Although 3 carcinoma samples were incorrectly designated as benign lesions in the above analysis, all 3 tumors were low risk when ranked with the AMES criteria. The one follicular adenoma that was clustered with the malignant group was from a 55-year-old female patient. Review of the pathology of this 1.5-cm follicular adenoma confirmed no invasive qualities and no papillary nuclear features, but did note mitosis not normally seen in follicular adenomas. This tumor is still classified as a follicular adenoma, but the mitoses are suspicious and suggest possible malignant transformation, perhaps explaining its grouping with the malignant lesions.
Microarray analysis involves the comparison of expression profiles of thousands of genes across multiple samples to produce a list of differentially expressed genes. Though statistical models, including multiple testing correction, are used to decrease the number of genes falsely added to this list, there is still some concern that what might be found differentially expressed in the microarray analysis might not hold true in the individual tumor samples. The differentially expressed gene list produced by the comparison of benign and malignant thyroid nodules detailed genes previously known in thyroid carcinogenesis, as well as novel genes. MET, galectin-3, keratin 19, fibronectin, and tissue inhibitor of metalloproteinase are all known to be involved in thyroid tumorigenesis and were some of the most overexpressed genes in the malignant group by microarray analysis.38–42 Adrenomedullin, TROP-2, and neuropilin 2 have been previously found to be overexpressed in differentiated thyroid carcinomas and are involved in tumor progression, but their role in thyroid tumorigenesis is still unexplored.25,26,43–45 The loss of expression or underexpression of a gene can lead to uncontrolled growth of a tumor or increase propensity for that tumor to metastasize. Some genes found to be underexpressed in the carcinoma group, including intestinal trefoil factor, connexin 43 and TGFbetaIIR, are known to play a role in carcinogenesis when underexpressed.46–48 The ability of molecular profiling to define genes that may be involved in thyroid carcinogenesis provides a tool for future molecular studies of carcinogenesis and elucidates possible targets for chemotherapeutic agents in the treatment of thyroid cancer.
After stratifying patients into high- and low-risk groups based on AMES criteria, these 2 groups were compared to determine whether molecular profiling could correctly identify tumors considered high risk. The 2-dimensional dendrogram produced had 2 distinct cluster groups, separating the high-risk samples from the low-risk samples with a sensitivity of 85.7% and a specificity of 80% in detecting high-risk tumors. The 2 high-risk samples that were clustered in the low-risk group were both follicular thyroid carcinomas. One sample, FC004, was an 11-cm tumor but had neither metastasis nor extrathyroidal extension. The other sample, FC008, surprising met most of the criteria, including age, size, and extensive invasion. As can be seen in Figure 4, these 2 samples defined their own subgroup of the low-risk cluster group, suggesting that they had molecular profiles that were not similar to either grouping. Two of the low-risk samples that were clustered in the high-risk group were multifocal papillary thyroid carcinomas (1 PTC and 1 FVPTC), and although these samples may not have met the criteria for the AMES high-risk group, these tumors are best treated by total thyroidectomy. The ability of molecular profiling to risk stratify tumors may one day complement the pathologic interpretation of invasiveness of thyroid carcinomas. If these observations can be extended to FNA samples they will be instrumental in helping patients and surgeons to determine preoperatively when a more aggressive surgical approach is warranted.
Currently, there are no molecular diagnostic techniques that have the sensitivity and specificity needed for a preoperative screening tool of thyroid nodules. The data we have presented suggest that molecular profiling has the needed sensitivity and specificity to be used as a screening tool and as an adjunct to clinical pathologic diagnosis. As the technology of this field improves, the advances may allow for the use of much smaller amounts of RNA to be used in molecular profiling. Once the quantity of RNA required for gene profiling is reduced to the amount that can be obtained from an FNA sample, this technique can be employed in the evaluation of FNA samples, overcoming the ambiguity of follicular lesions on cytology. Surgeons and patients would have solid diagnostic data on which to base decisions regarding surgery and the extent of surgery.
Molecular profiling of thyroid nodules is a powerful tool that can reliably distinguish benign from malignant thyroid tumors, as well as risk stratify carcinomas into high and low risk. These studies provide data to support future trials of molecular analysis from FNA samples. We expect future technological advances to permit incorporation of molecular profiling into the preoperative evaluation of thyroid nodules from FNA samples.
Discussions
Dr. Quan-Yang Duh (San Francisco, California): I want to thank Dr. Tom Fahey for inviting me to discuss this paper and to have provided me with the manuscript in time for me to review. I congratulate him and his colleagues for an outstanding study that I believe will change how surgeons manage thyroid nodules in the future.
The clinical problem Dr. Fahey and his group took on was how to distinguish between benign and malignant thyroid nodules. The approach they chose was molecular profiling, using the technique of expression oligonucleotide microarray analysis.
The current study is the culmination of a long series of investigations over the past several years by Dr. Fahey's group in Cornell. Using microarray and molecular profiling, Dr. Fahey's group has shown previously that they can reliably distinguish follicular adenoma from follicular carcinoma, and papillary thyroid cancer from benign thyroid nodules. In a paper recently presented at The American Association of Endocrine Surgeons, they show that Hurthle cell adenomas and carcinomas have molecular profile more like that of follicular cancers than that of papillary thyroid cancer.
Currently, fine needle aspiration biopsy (FNA) of the nodule and cytological examination is the standard diagnostic test to evaluate thyroid nodules. To use a similar terminology, the current approach is cytological profiling of cells from FNA. Dr. Fahey's study is molecular profiling of frozen thyroid tissue.
How accurate is cytological profiling for thyroid nodule? In most centers, the positive predictive value for a malignant cytological diagnosis is 99% and the predictive value for a benign cytological diagnosis is 95%. The problem is in the 20% to 30% of the nodules that have indeterminate cytology (they include those called cellular, follicular, or suspicious). In this indeterminate group, the risk of cancer is about 20%, high enough to recommend a thyroid lobectomy. These cancers that the cytologists have trouble diagnosing are the follicular cancer and the follicular variant of papillary cancer. Cytologically, they are difficult to distinguish from follicular adenomas and benign hyperplastic nodules. This is the group of nodules in which molecular profiling would be most helpful. Since molecular profiling can accurately distinguish cancer from benign thyroid nodule with a sensitivity of 91% and specificity of 96%, it can potentially save tens of thousands of operations on patients with benign thyroid tumors that are indeterminate by needle biopsy.
Another clinically significant finding in this study is that the molecular profiles correlated with the AMES prognostic classification and the presence of cancer local invasion. Thus molecular profiling can predict the aggressiveness of thyroid cancer. Just as we hope that molecular profiling may help the oncologist choose the most effective type of chemotherapy for other cancers, molecular profiling may help the endocrine surgeon to determine whether further treatment, such as radioiodine, will be useful and perhaps also to tailor the follow-up regimen according to the risk of recurrence.
I have 3 groups of questions for Dr. Fahey. First, some questions on the potential barriers for using molecular profiling instead of cytological profiling. Can enough RNA be extracted from a fine needle aspiration specimen for the current generation of microarray? Is the cost comparable to cytological examination? Do you think the accuracy of molecular profiling will be decreased when it is applied to fine needle aspiration specimen, from sampling errors, just as it does now for cytology?
Second, some questions on standardizing the environment under which gene profiling is studied. Gene expression responds to changes in the environment. The expression of many genes in thyroid cells can be up- or down-regulated by TSH. This is an advantage when we are studying signaling pathways, but is a potential problem when we use molecular profiling to diagnose cancer. As an example, the Id-1 gene is in your list of genes that are under-expressed in thyroid cancer. In contrast to your findings, Dr. Electron Kebebew in our group has found the expression of Id-1 gene to be increased in papillary cancer and medullary thyroid cancer, and this expression of Id-1 gene in papillary thyroid cancer is increased by TSH. So my question is, how is the molecular profile of thyroid nodule changed by serum TSH? Does the profile vary enough that it may then require a standard preparation of the patient to keep the serum TSH level to within a specified range, or to culture the aspirated cells in a standardized environment before extracting the RNA?
The third question is, have you studied thyroid tumors that are familial or those that are associated with radiation? One may expect these to have different molecular profile and may be useful for diagnosis.
Again, I enjoyed hearing the presentation and reading this paper. I believe molecular profiling will change how we manage patients with thyroid nodules. Dr. Fahey and his colleagues are to be congratulated for this outstanding study.
Dr. Thomas J. Fahey, III (New York, New York): Thank you, Dr. Duh, for this very thorough review and your questions. I will start in order.
No, right now there is not enough RNA that can be extracted from fine needle aspiration for most techniques to do expression profiling on the basis of an FNA without significant pre-amplification. This is labor intensive and costly, so I don't think this is ready to move to clinical trials just yet.
The accuracy of molecular profiling I think should remain approximately the same. We are currently doing studies to document that. But my feeling is that it will remain very good as compared to tumor samples. The accuracy as regards to ultimate application to fine needle aspiration, there will still be the problem of sampling error, but I believe that that is a relatively minor problem in the scheme of FNA and thyroid nodules.
In terms of the second group of questions, we have not looked at correlation with serum TSH, although I believe that virtually every patient in this series was euthyroid when I operated on them. I can't be 100% sure. And certainly the variation between a TSH of .5 and 5 may be there. I don't think that the molecular profile will vary with serum TSH, but that is something that we will have to look into further.
Finally, this group of tumors was specifically chosen to exclude familial tumors, and I do not believe that any of the papillary thyroid carcinomas in this group are associated with a history of external beam radiation or other radiation that would predispose it to development of thyroid cancer.
Footnotes
Supported by the G. Tom Shires Faculty Scholar Award.
Reprints: Thomas J. Fahey III, MD, New York Presbyterian Hospital-Cornell University Room F-2024, 525 East 68th Street New York, NY 10021. E-mail: tjfahey@mail.med.cornell.edu.
REFERENCES
- 1.What are the key statistics for thyroid cancer? [ACS web site]. Vol. 7/13/2003: American Cancer Society; 2003.
- 2.U.S. Cancer Statistics Working Group. United States Cancer Statistics: 2000 Incidence. Atlanta, GA: Department of Health and Human Services, Centers for Disease Control and Prevention and National Cancer Institute; 2003. [Google Scholar]
- 3.Caraway NP, Sneige N, Samaan NA. Diagnostic pitfalls in thyroid fine-needle aspiration: a review of 394 cases. Diagn Cytopathol. 1993;9:345–350. [DOI] [PubMed] [Google Scholar]
- 4.Baloch ZW, Fleisher S, LiVolsi VA, et al. Diagnosis of “follicular neoplasm”: a gray zone in thyroid fine-needle aspiration cytology. Diagn Cytopathol. 2002;26:41–44. [DOI] [PubMed] [Google Scholar]
- 5.Gharib H, Goellner JR. Fine-needle aspiration biopsy of the thyroid: an appraisal. Ann Intern Med. 1993;118:282–289. [DOI] [PubMed] [Google Scholar]
- 6.Goldstein RE, Netterville JL, Burkey B, et al. Implications of follicular neoplasms, atypia, and lesions suspicious for malignancy diagnosed by fine-needle aspiration of thyroid nodules. Ann Surg 2002;235:656–662; discussion 662–664. [DOI] [PMC free article] [PubMed]
- 7.Hamberger B, Gharib H, Melton LJ 3rd, et al. Fine-needle aspiration biopsy of thyroid nodules. Impact on thyroid practice and cost of care. Am J Med. 1982;73:381–384. [PubMed] [Google Scholar]
- 8.Kesmodel SB, Terhune KP, Canter RJ, et al. The diagnostic dilemma of follicular variant of papillary thyroid carcinoma. Surgery. 2003;134:1005–1012. [DOI] [PubMed] [Google Scholar]
- 9.Yang GC, Liebeskind D, Messina AV. Should cytopathologists stop reporting follicular neoplasms on fine-needle aspiration of the thyroid? Cancer. 2003;99:69–74. [DOI] [PubMed] [Google Scholar]
- 10.Baloch ZW, Livolsi VA. Follicular-patterned lesions of the thyroid: the bane of the pathologist. Am J Clin Pathol. 2002;117:143–150. [DOI] [PubMed] [Google Scholar]
- 11.Liel Y, Ariad S, Barchana M. Long-term follow-up of patients with initially benign thyroid fine-needle aspirations. Thyroid. 2001;11:775–778. [DOI] [PubMed] [Google Scholar]
- 12.Mesonero CE, Jugle JE, Wilbur DC, et al. Fine-needle aspiration of the macrofollicular and microfollicular subtypes of the follicular variant of papillary carcinoma of the thyroid. Cancer. 1998;84:235–244. [PubMed] [Google Scholar]
- 13.Ravetto C, Colombo L, Dottorini ME. Usefulness of fine-needle aspiration in the diagnosis of thyroid carcinoma: a retrospective study in 37,895 patients. Cancer. 2000;90:357–363. [PubMed] [Google Scholar]
- 14.Yeh MW, Demircan O, Ituarte P, et al. False-negative fine-needle aspiration cytology results delay treatment and adversely affect outcome in patients with thyroid carcinoma. Thyroid. 2004;14:207–215. [DOI] [PubMed] [Google Scholar]
- 15.Bahar G, Braslavsky D, Shpitzer T, et al. The cytological and clinical value of the thyroid “follicular lesion”. Am J Otolaryngol. 2003;24:217–220. [DOI] [PubMed] [Google Scholar]
- 16.Carpi A, Nicolini A, Sagripanti A, et al. Large-needle aspiration biopsy for the preoperative selection of follicular adenoma diagnosed by fine-needle aspiration as a microfollicular nodule or suspected cancer. Am J Clin Oncol. 2002;25:209–212. [DOI] [PubMed] [Google Scholar]
- 17.D'Avanzo A, Treseler P, Ituarte PH, et al. Follicular thyroid carcinoma: histology and prognosis. Cancer. 2004;100:1123–1129. [DOI] [PubMed] [Google Scholar]
- 18.Sugitani I, Kasai N, Fujimoto Y, et al. A novel classification system for patients with PTC: addition of the new variables of large (3 cm or greater) nodal metastases and reclassification during the follow-up period. Surgery. 2004;135:139–148. [DOI] [PubMed] [Google Scholar]
- 19.Furlan JC, Bedard YC, Rosen IB. Clinicopathologic significance of histologic vascular invasion in papillary and follicular thyroid carcinomas. J Am Coll Surg. 2004;198:341–348. [DOI] [PubMed] [Google Scholar]
- 20.Castro MR, Gharib H. Thyroid fine-needle aspiration biopsy: progress, practice, and pitfalls. Endocr Pract. 2003;9:128–136. [DOI] [PubMed] [Google Scholar]
- 21.Shaha AR, Shah JP, Loree TR. Patterns of nodal and distant metastasis based on histologic varieties in differentiated carcinoma of the thyroid. Am J Surg. 1996;172:692–694. [DOI] [PubMed] [Google Scholar]
- 22.Huang Y, Prasad M, Lemon WJ, et al. Gene expression in papillary thyroid carcinoma reveals highly consistent profiles. Proc Natl Acad Sci USA. 2001;98:15044–15049. [DOI] [PMC free article] [PubMed] [Google Scholar]
- 23.Chen KT, Lin JD, Chao TC, et al. Identifying differentially expressed genes associated with metastasis of follicular thyroid cancer by cDNA expression array. Thyroid. 2001;11:41–46. [DOI] [PubMed] [Google Scholar]
- 24.Finley DF, Fahey TJ 3rd. Molecular Diagnosis of Thyroid Carcinoma: Review of Biological Markers and Advances in Microarray Technology. Vol. 5. Kerala, India: Transworld Research Network; 2003. [Google Scholar]
- 25.Barden CB, Shister KW, Zhu B, et al. Classification of follicular thyroid tumors by molecular signature: results of gene profiling. Clin Cancer Res. 2003;9:1792–1800. [PubMed] [Google Scholar]
- 26.Finley DF, Arora N, Gallagher L, et al. Molecular profiling distinguishes papillary carcinoma from benign thyroid nodules. JCEM. 2004;7:3214–3223. [DOI] [PubMed] [Google Scholar]
- 27.Yano Y, Uematsu N, Yashiro T, et al. Gene expression profiling identifies platelet-derived growth factor as a diagnostic molecular marker for papillary thyroid carcinoma. Clin Cancer Res. 2004;10:2035–2043. [DOI] [PubMed] [Google Scholar]
- 28.Eszlinger M, Krohn K, Frenzel R, et al. Gene expression analysis reveals evidence for inactivation of the TGF-beta signaling cascade in autonomously functioning thyroid nodules. Oncogene. 2004;23:795–804. [DOI] [PubMed] [Google Scholar]
- 29.Kroll TG, Sarraf P, Pecciarini L, et al. PAX8-PPARgamma1 fusion oncogene in human thyroid carcinoma [corrected]. Science. 2000;289:1357–1360. [DOI] [PubMed] [Google Scholar]
- 30.Saggiorato E, Cappia S, De Giuli P, et al. Galectin-3 as a presurgical immunocytodiagnostic marker of minimally invasive follicular thyroid carcinoma. J Clin Endocrinol Metab. 2001;86:5152–5158. [DOI] [PubMed] [Google Scholar]
- 31.Casey MB, Lohse CM, Lloyd RV. Distinction between papillary thyroid hyperplasia and papillary thyroid carcinoma by immunohistochemical staining for cytokeratin 19, galectin-3, and HBME-1. Endocr Pathol. 2003;14:55–60. [DOI] [PubMed] [Google Scholar]
- 32.Yashima K, Vuitch F, Gazdar AF, et al. elomerase activity in benign and malignant thyroid diseases. Surgery 1997;122:1141–1145; discussion 1145–1146. [DOI] [PubMed]
- 33.Yang GC, Liebeskind D, Messina AV. Ultrasound-guided fine-needle aspiration of the thyroid assessed by Ultrafast Papanicolaou stain: data from 1135 biopsies with a two- to six-year follow-up. Thyroid. 2001;11:581–589. [DOI] [PubMed] [Google Scholar]
- 34.Greaves TS, Olvera M, Florentine BD, et al. Follicular lesions of thyroid: a 5-year fine-needle aspiration experience. Cancer. 2000;90:335–341. [PubMed] [Google Scholar]
- 35.Ozkara SK, Gurbuz Y, Muezzinoglu B, et al. Encapsulated cystic papillary variant of medullary carcinoma of thyroid gland. Endocr Pathol. 2002;13:167–171. [DOI] [PubMed] [Google Scholar]
- 36.Kaleem Z, Davila RM. Hyalinizing trabecular adenoma of the thyroid. A report of two cases with cytologic, histologic and immunohistochemical findings. Acta Cytol. 1997;41:883–888. [DOI] [PubMed] [Google Scholar]
- 37.Niccoli P, Wion-Barbot N, Caron P, et al. Interest of routine measurement of serum calcitonin: study in a large series of thyroidectomized patients. The French Medullary Study Group. J Clin Endocrinol Metab. 1997;82:338–341. [DOI] [PubMed] [Google Scholar]
- 38.Wasenius VM, Hemmer S, Kettunen E, et al. Hepatocyte growth factor receptor, matrix metalloproteinase-11, tissue inhibitor of metalloproteinase-1, and fibronectin are up-regulated in papillary thyroid carcinoma: a cDNA and tissue microarray study. Clin Cancer Res. 2003;9:68–75. [PubMed] [Google Scholar]
- 39.Patel A, Straight AM, Mann H, et al. Matrix metalloproteinase (MMP) expression by differentiated thyroid carcinoma of children and adolescents. J Endocrinol Invest. 2002;25:403–408. [DOI] [PubMed] [Google Scholar]
- 40.Scarpino S, D'Alena FC, Di Napoli A, et al. Papillary carcinoma of the thyroid: evidence for a role for hepatocyte growth factor (HGF) in promoting tumour angiogenesis. J Pathol. 2003;199:243–250. [DOI] [PubMed] [Google Scholar]
- 41.Takenaka Y, Inohara H, Yoshii T, et al. Malignant transformation of thyroid follicular cells by galectin-3. Cancer Lett. 2003;195:111–119. [DOI] [PubMed] [Google Scholar]
- 42.Lam KY, Lui MC, Lo CY. Cytokeratin expression profiles in thyroid carcinomas. Eur J Surg Oncol. 2001;27:631–635. [DOI] [PubMed] [Google Scholar]
- 43.Kawakami T, Tokunaga T, Hatanaka H, et al. Neuropilin 1 and neuropilin 2 co-expression is significantly correlated with increased vascularity and poor prognosis in nonsmall cell lung carcinoma. Cancer. 2002;95:2196–2201. [DOI] [PubMed] [Google Scholar]
- 44.Zudaire E, Martinez A, Cuttitta F. Adrenomedullin and cancer. Regul Pept. 2003;112:175–183. [DOI] [PubMed] [Google Scholar]
- 45.Ripani E, Sacchetti A, Corda D, et al. Human Trop-2 is a tumor-associated calcium signal transducer. Int J Cancer. 1998;76:671–676. [DOI] [PubMed] [Google Scholar]
- 46.Uchino H, Kataoka H, Itoh H, et al. Overexpression of intestinal trefoil factor in human colon carcinoma cells reduces cellular growth in vitro and in vivo. Gastroenterology. 2000;118:60–69. [DOI] [PubMed] [Google Scholar]
- 47.Zhang YW, Kaneda M, Morita I. The gap junction-independent tumor-suppressing effect of connexin 43. J Biol Chem. 2003;278:44852–44856. [DOI] [PubMed] [Google Scholar]
- 48.Ammanamanchi S, Tillekeratne MP, Ko TC, et al. Endogenous control of cell cycle progression by autocrine transforming growth factor beta in breast cancer cells. Cancer Res. 2004;64:2509–2515. [DOI] [PubMed] [Google Scholar]