

Abstract
Objective:
To determine if using dense data capture to measure heart rate volatility (standard deviation) measured in 5-minute intervals predicts death.
Background:
Fundamental approaches to assessing vital signs in the critically ill have changed little since the early 1900s. Our prior work in this area has demonstrated the utility of densely sampled data and, in particular, heart rate volatility over the entire patient stay, for predicting death and prolonged ventilation.
Methods:
Approximately 120 million heart rate data points were prospectively collected and archived from 1316 trauma ICU patients over 30 months. Data were sampled every 1 to 4 seconds, stored in a relational database, linked to outcome data, and de-identified. HR standard deviation was continuously computed over 5-minute intervals (CVRD, cardiac volatility–related dysfunction). Logistic regression models incorporating age and injury severity score were developed on a test set of patients (N = 923), and prospectively analyzed in a distinct validation set (N = 393) for the first 24 hours of ICU data.
Results:
Distribution of CVRD varied by survival in the test set. Prospective evaluation of the model in the validation set gave an area in the receiver operating curve of 0.81 with a sensitivity and specificity of 70.1 and 80.0, respectively. CVRD predict death as early as 24 hours in the validation set.
Conclusions:
CVRD identifies a subgroup of patients with a high probability of dying. Death is predicted within first 24 hours of stay. We hypothesize CVRD is a surrogate for autonomic nervous system dysfunction.
Key Words: heart rate, computerized monitoring, variability, volatility, intensive care unit, heart rate variability, dense data capture
New techniques to capture dense physiologic data in the intensive care unit have identified reduced heart rate volatility as a new vital sign. Aberrations of this vital sign in the first 24 hours following injury predict patient death with 70% sensitivity and 80% specificity after incorporating age and injury severity score.
Fundamental approaches to assessing vital signs in the critically ill have changed little since the early 1900s, when Cushing1 asserted the importance of periodically recording blood pressure and other vital signs. While technical advancements and clinical research have expanded the number of physiologic parameters, treatment options, and management protocols available to the intensive care unit (ICU) physician,2 interpreting physiologic data remains largely a manual process that uses only a small fraction of potentially available data.3 A growing body of evidence suggests that real-time automated analysis of densely sampled physiologic data can provide information about ICU patient outcome4–8 or adverse events7,9–11 that is far superior to that generated via conventional processes. The SIMON (Signal Interpretation and MONitoring) project began at Vanderbilt in 1998 with the aim of continuously capturing physiologic data from Trauma ICU patients.12
Our prior work in this area has demonstrated the utility of densely sampled data and, in particular, heart rate volatility over the entire patient stay, for predicting morbidity and mortality.13 This study extends the practical value of our previous work for real-time patient management by hypothesizing that heart rate (HR) volatility (standard deviation) over 5-minute intervals in patients admitted to the trauma ICU predicts death in the first 24 hours. Our approach is conceptually distinct from, yet complementary to, studies that have used spectral analysis of EKG waveforms to determine HR variability and then demonstrate that loss of autonomic function suggests a poor prognosis in many disease processes.14–17
METHODS
Setting
Vanderbilt University Medical Center (VUMC) is the only level 1 trauma center serving a 65,000-square-mile area. Of the facility's approximately 3200 annual trauma admissions, over 1800 are admitted to a 31-bed dedicated trauma unit. The 14 trauma unit beds classified as ICU beds accommodate 600 to 700 admissions per year. At present, 10 of the ICU beds are equipped with the SIMON (Signal Interpretation and MONitoring) data capture system.
Data Sources
SIMON
The SIMON project is an ongoing collaborative effort between VUMC's Division of Trauma and the University's School of Engineering. Physiologic data from bedside medical devices have been continuously captured and stored from 4 trauma ICU beds12 since December 2000, with an expansion to 10 beds occurring in June 2001. The physiologic parameters monitored include HR, invasive and noninvasive blood pressures, intracranial and cerebral perfusion pressures, arterial and venous oxygen saturations, blood temperature, pulmonary and central venous pressures, cardiac index, and end diastolic volume index.
As of February 2004, data had been collected for over 2200 patients for their entire length of ICU stay in a SIMON-monitored bed, representing more than 170,000 total hours of continuous monitoring and over 1.5 billion data points. Data are automatically sampled every 1 to 4 seconds and stored in an SQL Server relational database (Microsoft Corp., Redmond, WA). For clinical use, patient-specific data are displayed on a secure website (Fig. 1) with daily aggregate summary reports generated and placed in each patient's electronic medical record. In addition, daily physiologic data summaries for all patients on SIMON are sent to the ICU medical director, chief residents, and nurse manager prior to rounds (Fig. 2).

FIGURE 1. SIMON physiologic parameter Web display (24 hours).
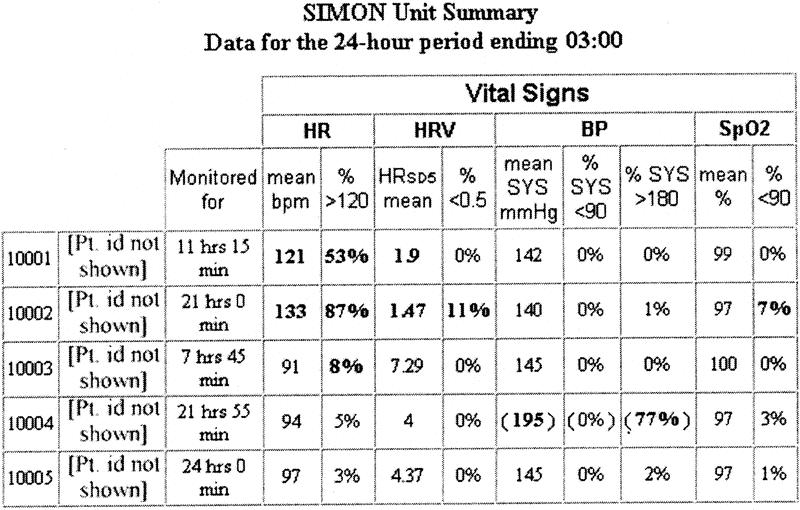
FIGURE 2. Daily SIMON ICU unit summary report (5/14 beds shown) sent to ICU director, nurse manager, and chief resident.
Trauma Registry of the American College of Surgeons (TRACS)
The VUMC Division of Trauma has participated in the TRACS since 1986. Demographic, clinical, and injury-related data on all patients admitted to VUMC for trauma or burns are entered into the database, which is maintained locally and shared quarterly with the National Trauma Data Bank after de-identification. Among the more than 300 parameters currently captured via retrospective chart review are patient demographics, injuries, diseases, operative procedures, hospital disposition, complications, length of stay at various levels of care, costs, and resource utilization. For this IRB-approved study, data from SIMON and TRACS were linked via medical record number and de-identified prior to analysis.
Inclusion Criteria
The test set included data from 923 patients who (1) were admitted to VUMC's Trauma ICU between December 15, 2000 and December 15, 2002, as identified by TRACS; and (2) had 12 to 240 hours of stored SIMON HR data. Patients who had fewer than 12 or more than 240 hours of SIMON data were excluded. These patients had early death, were transferred, or experienced a prolonged SIMON recorded ICU stay. Data from patients in the exclusion groups were retained for use in a separate future analysis. The validation set consisted of data from 393 patients admitted from December 16, 2002, until July 31, 2003, with the same criteria as the test set (Fig. 3).

FIGURE 3. Patient inclusion criteria for test and validation sets.
Measurements
Over 120 million HR data points, representing approximately 100,000 patient-hours of data capture, were stored in the combined 1316 patient sample. Demographic data obtained from TRACS included age, gender, race, discharge status (home, rehabilitation facility, skilled nursing facility, and death), and Injury Severity Score (ISS), an index of anatomic injury severity that correlates with survival in blunt-trauma patients.18,19
Our parameter of interest, short-term HR volatility, is computed for a given patient once every 5 minutes by calculating the standard deviation of all HR samples collected during that time interval. Duration (5 minutes) and intensity (standard deviation) of volatility are reflected in this measure. The 5-minute time interval follows established practices for collecting data for HR variability analysis.20 However, our data differ from that used in traditional HR variability analysis in that precise instantaneous HR is not acquired at every beat. The SIMON system samples HR from a standard monitor (Phillips Viridia) every 1 to 4 seconds. Thus, a typical 5-minute interval will contain between 100 and 150 HR data samples for a single patient. The standard deviation of these points is our basic parameter of short-term volatility.
We further characterize short-term volatility according to an observation window and a distribution range and from these derive a measure of cardiac volatility–related dysfunction (CVRD). The observation window defines the length of time over which short-term volatility is observed, in this case, arbitrarily, the first 24 hours of ICU stay. Therefore the maximum number of volatility measurements in the first 24 hours is 288 (ie, one measurement every 5 minutes, 12 five-minute intervals per hour × 24 hours). Figure 4 demonstrates patient mortality by distribution of short-term volatility.
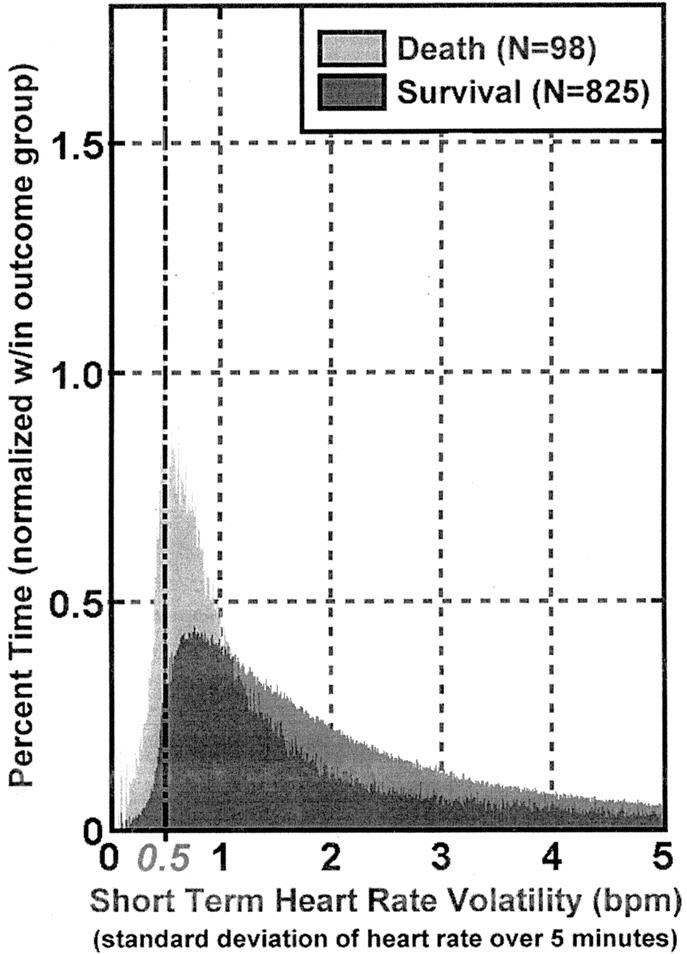
FIGURE 4. Distribution of short-term heart ratevolatility over ICU stay by mortality in the 923 patient test set. Percent < 0.5 was used to define cardiac volatility related dysfunction (CVRD) measurement. Bin size = 0.01.
The distribution range is that portion of the distribution where the measure optimally predicts the dependent variable, death. We chose a distribution range of 0 to 0.5, noting the substantial difference in mortality associated with this range (Fig. 4), as well as substantial prior research by others suggesting reduced variability is associated with poor outcome.
Finally, we define CVRD as the percent of time during the observation window (in this case, the first 24 hours in the ICU) that a patient's short-term HR volatility fell within the distribution range (ie, 0–0.5). Thus, a patient whose short-term volatility readings were evenly distributed between zero and 2 during the first 24 hours would be assigned a CVRD value of 25%.
Our primary outcome of interest (dependent variable) was death as documented in TRACS, and defined as any inpatient death from any cause during the index hospital admission.
Statistical Analysis
Statistical analyses were performed using STATA v. 7 (College Station, TX) and SPSS v. 12.0 (Chicago, IL). To assess the equivalency of the test and validation sets, we used t tests and Mann-Whitney U tests to compare continuous variables pertaining to patients (age) and clinical episodes (LOS, ISS, ventilator days). Contingency tables and the χ2 statistic were used to compare categorical variables (gender, race, and mechanism of injury).
We performed logistic regression to measure CVRD's value for predicting death. Univariate analyses were performed to identify variables that should be included in the multivariable analyses. Multivariable model development and verification was performed on the test set. We used logistic regression to construct multivariate models incorporating age and ISS. To control for the curvilinear relation of age and death, we divided age into 5 binary categorical variables representing 20-year intervals, with age <20 years serving as the reference category. Using the regression equation developed on the test set, we evaluated the performance of the model on the validation set. Finally, we computed receiver operator curves (ROC) to compare the resulting models.
RESULTS
The demographics of the test and validations sets were sufficiently comparable (Table 1) to enable combining both groups for additional characterization and analysis. Stratifying CVRD by gender and race across the combined data sets (Table 2) revealed no differences over the first 24 hours of SIMON data, although significant differences were observed when stratifying by outcome and mechanism of injury. The difference in mechanism of injury was likely due to a higher ISS in the blunt trauma patients. CVRD increased as age and ISS increased (Fig. 5). Morbidity, defined as number of ventilator days and units of blood transfused, also increased with CVRD (Fig. 5).
TABLE 1. Comparison of Test Set and Validation Set Demographics
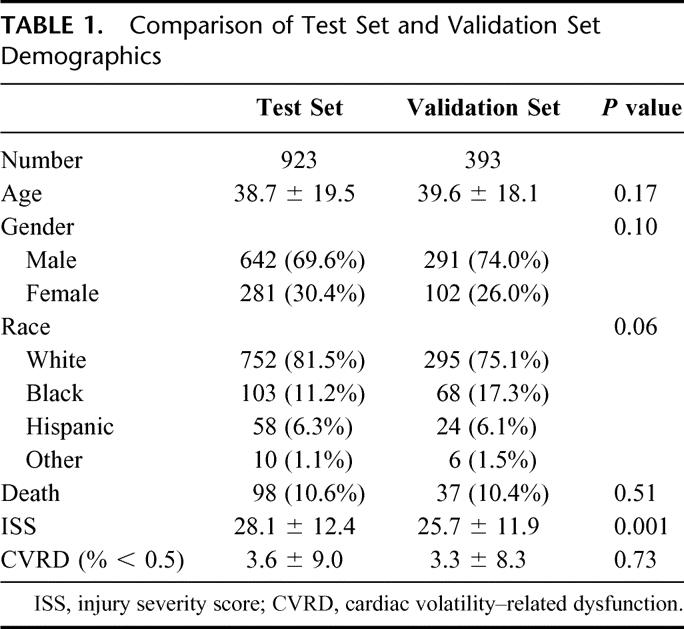
TABLE 2. Characteristics of Cardiac Volatility–Related Dysfunction (CVRD)
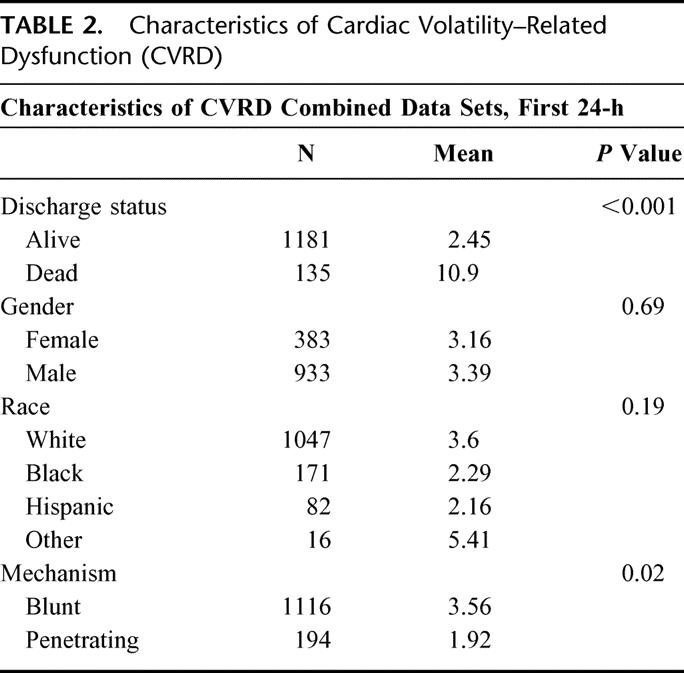
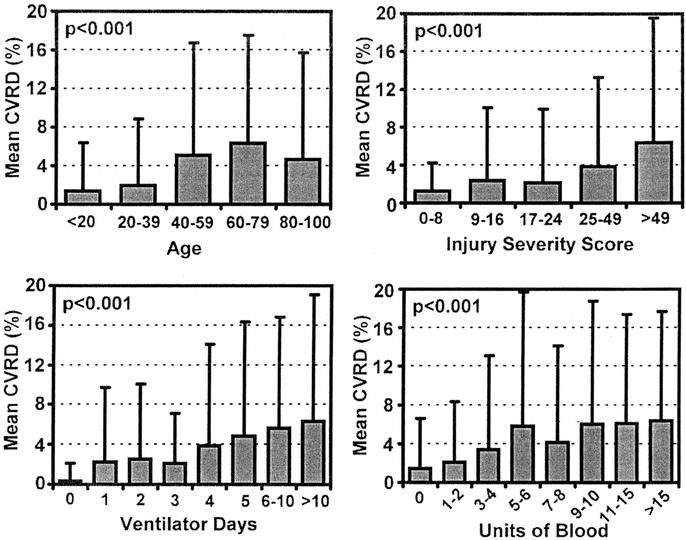
FIGURE 5. Mean CVRD in first 24 hours of ICU stay versus age, injury severity score, ventilator days, and units of blood transfused. Combined dataset (N = 1316). P values using ANOVA.
Without incorporating age or ISS, we also stratified patient deaths in the combined data set by CVRD and found a 3.8% mortality rate in patients without CVRD. Conversely, patients with any abnormality in CVRD had a 21% mortality rate. The mortality rate increased as CVRD increased (Fig. 6).
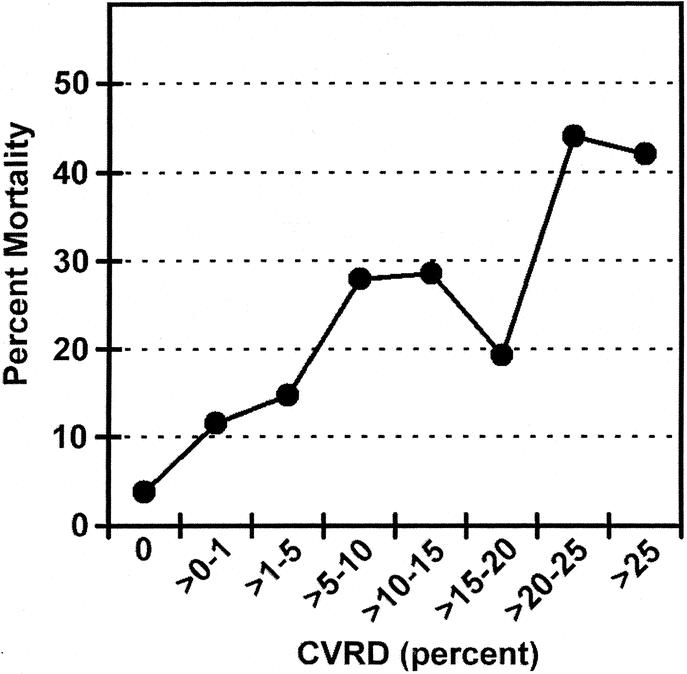
FIGURE 6. Percent mortality versus cardiac volatility related dysfunction (CVRD) in the First 24 hours of ICU stay. Age and ISS not incorporated. Data for test and validation set (N = 1316).
Having identified the key covariates (age and ISS) that contribute with CVRD to death, we developed a regression model incorporating both elements. The covariates that were significant in both the test and validation set were age >80 and ISS (Table 3). The formula using the regression equation generated a score ranging from 0 to 1. The cutoff value, which maximized sensitivity and specificity in the test set, was found to be 0.1. This same model was then prospectively evaluated for predictive accuracy in the validation set. The ROC for both the test and validation sets (Fig. 7) show no statistical difference. The ROC area for the validation set was 0.816, and the sensitivity and specificity were 70.1% and 80.0%, respectively (Table 4). To further evaluate the effectiveness of the model, we compared the true positives and false negatives to the days to death (Fig. 8). This demonstrated that the regression equation above remains effective for predicting death beyond the first several days.
TABLE 3. Logistic Regression Model Parameters
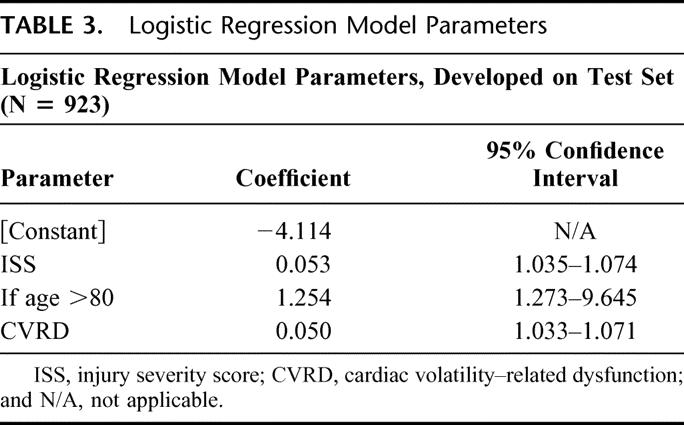
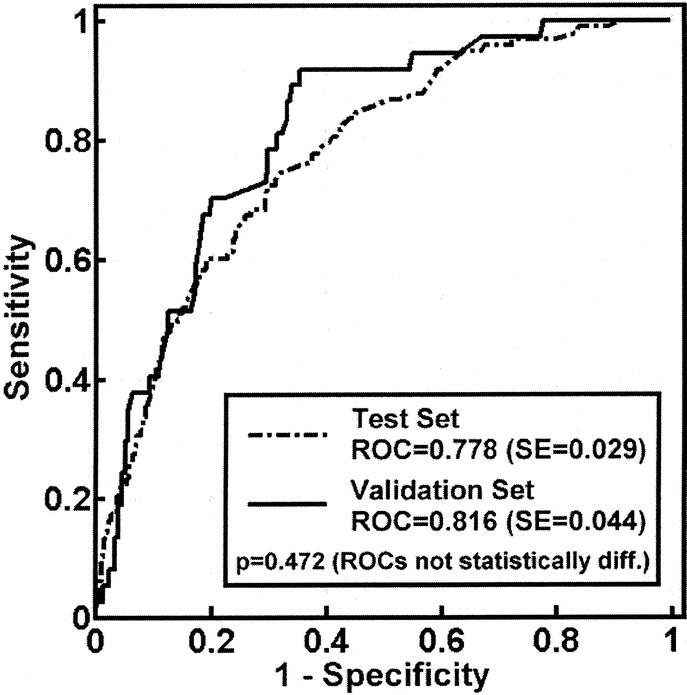
FIGURE 7. Logistic regression model ROC curves for test and validation sets. P value shown is comparing test and validation set curves. P value for both curves < 0.0001.
TABLE 4. Receiver Operator Characteristic (ROC) Curve Statistics
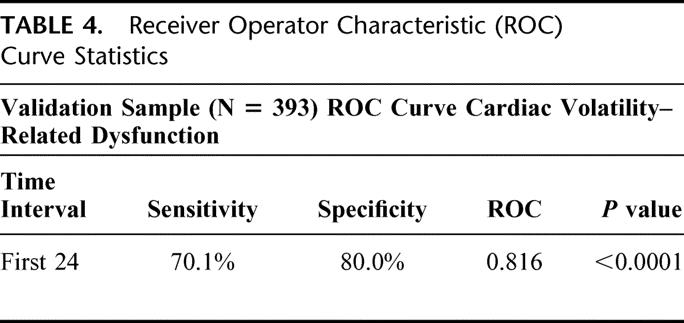
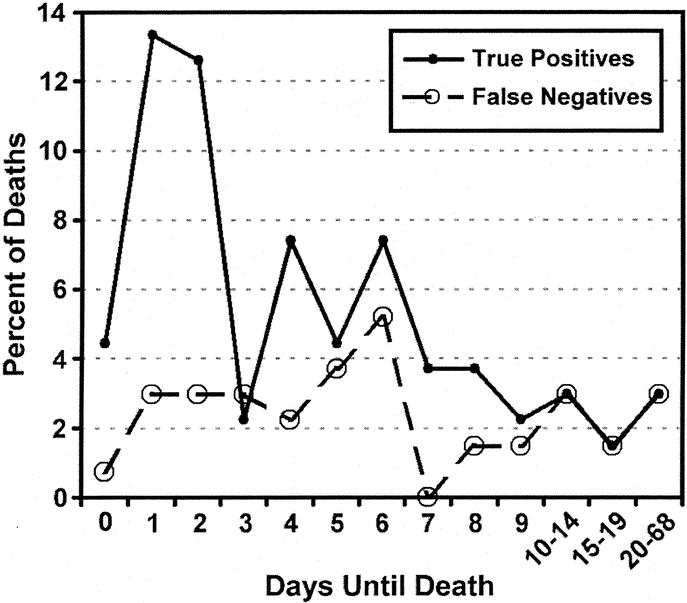
FIGURE 8. True positives (patients predicted to die who die) and false negatives (patients predicted to live who die) rates versus days to death. combined test and validation sets (N = 1316).
DISCUSSION
This study explores the clinical value of dense physiologic data, captured in the ICU and automatically stored in a relational database. It is our global hypothesis that the SIMON project's automated dense data capture and systematic analysis of multiple physiologic variables will, over time, facilitate both the identification of patients at risk for adverse events and development of decision support tools useful for early intervention. Our previous work demonstrated that measures of long-term HR volatility (standard deviation, percent of time in extremes during the entire hospital course) were better predictors of survival in a population of trauma patients than were measures of central tendency (mean, median).13
This study extends that effort by investigating whether patterns of short-term volatility in 5-minute intervals (CVRD) aggregated over the initial 24 hours of ICU stay have predictive value during a patient's entire hospital course. We chose the 5-minute interval to maximize comparability with previously described HR variability analyses, which also measures HR changes over 5-minute intervals.
In this manuscript, we use raw data to demonstrate that CVRD in the first 24 hours of ICU stay is an independent predictor of death. This measure also predicts morbidity (ventilator days and transfusion).
CVRD varies with age, ISS, and mechanism of injury. We use regression data incorporating age and ISS in an independent validation set to demonstrate the sensitivity and specificity of this measure in predicting death. Using the ROC, we show that 82% of variation is accounted for by our model. However, we do not advocate that CVRD be used in isolation to predict individual patient mortality.
The practical and operational evidence that dense data capture can occur in a working ICU enhances the clinical significance of our findings. While others have demonstrated similar technology21–23 or analysis of periodically sampled dense data in a similar population,4,7,24 our work demonstrates the value of overcoming barriers associated with patient identification, reliability, storage, and analysis of dense physiologic data. Further, we demonstrate that linking dense data captured in a large trauma population to clinical outcomes facilitates identification of new risk factors for death and morbidity.
Strengths and Limitations
Strengths
The strengths of this study include use of (1) a diverse population of patients with a wide range of injuries spanning a 3 year period; (2) a large, prospectively collected test data set (N = 923); and (3) an independent, prospectively collected validation set (N = 393).
Clinicians were blinded to these data during the course of care; therefore, the results are independent of clinician intervention; this de facto blinding also serves to establish our institution's baseline practice pattern against which future interventions designed to highlight CVRD can be benchmarked.
Finally, this study defines a methodology for ICUs to collect, store, distill, and distribute electronically patient-specific physiologic data in real time to clinicians both at the bedside and in remote locations.12,24–26 In addition to their clinical value, the data are readily accessible for research and operational applications.
Limitations
We expect that dense physiologic data capture will become an increasingly important tool in the ICU, but for that to occur limitations of our study must be addressed. In the first year of the study period, when SIMON only existed for 2 to 4 beds, sample bias may have occurred if clinicians tended to allocate the SIMON beds, a scarce resource, to the sickest patients. If this occurred, the problem would have resolved by the second year of the study, when all admission beds in the ICU were equipped with the SIMON data capture system. Further expansion of SIMON to all 31 beds on the trauma unit will allow dense data capture to continue throughout a patient's entire hospitalization, facilitating detection of potentially unique physiologic patterns occurring at different time points in the patient's hospital course. In addition, the absence of pharmacology data rendered us unable to determine whether β-blockade or administration of other drugs explains the increasing loss of volatility associated with age, injury severity, or mortality.
With regard to the regression model, loss of 30-day mortality data on cases discharged to long-term care facilities may have had the effect of understating true positives, and failure to include mechanism of injury despite its positive association with mortality may have diminished the model's predictive power. Finally, construction of chronologically distinct (serial) test and validation sets renders the analysis vulnerable to variations occurring over time. The fact that our model performed better in the validation set could be due to such variations. We will address these issues in future analyses by means of bootstrapping, time series analysis, segmentation into shorter critical periods of observation as predictors of outcomes, and other appropriate techniques. These analyses are ongoing.
Future Work
This work represents a series of compromises between the rigor of the laboratory and the realities of delivering bedside care. Previous work in HR variability has been largely based on waveform analyses15,20 that assess autonomic function via precise R-R interval computation from EKG waveforms. The increase in precision obtained via this methodology comes at a cost: waveform analysis requires several orders of magnitude more storage and processing capacity than the methods presented here. We have begun to compare the methods of waveform analysis with CVRD to determine if the loss of short-term volatility represented by CVRD is a measure of autonomic dysfunction. While we hypothesize CVRD is an indicator of autonomic dysfunction, it is possible that we are measuring intrinsic cardiac dysfunction, failure of resuscitation, physiologic exhaustion, patient's genetic ability to respond to injury, global hypoperfusion, or a parameter specific for neurologic dysfunction.
Continued refinement of our measure will help to identify the time interval of standard deviation, the standard deviation distribution range, and the observation window that optimizes the ROC curve. Since our data are prospectively collected and stored indefinitely, we can use test/validation and bootstrapping methodologies to find the most powerful measurement tool and model to predict outcome in our ICU.
We must also continue to investigate the time course of this measure. While the model predicts reliably death occurring within 5 to 10 days based on the first 24 hours of data, accuracy decreases as the patient's stay lengthens. If CVRD predicts death equally well later in a patient's disease process, it may herald the onset of the hyperinflammatory/septic state. Aggregation of data into 24-hour blocks reported here is a preliminary step in a wider exploration of the clinical significance of continuous physiologic data in the ICU. Analysis of short-term volatility in finer observation windows such as 1-, 6-, and 12-hour blocks is also necessary for CVRD to evolve into a powerful real-time bedside tool.
Each physiologic parameter (blood pressure, oxygen saturation, intracranial pressure, pulmonary artery pressure, cardiac index, pulmonary capillary wedge pressures, SVO2, and others) stored by SIMON must also be explored and described in the context of at least 3 types of measures: (1) volatility, (2) central tendency, and (3) waveform analysis. We must define each parameter and determine if it is best characterized by measures of central tendency or statistical variation and begin waveform analysis to analyze the potential of each to predict outcome. Once these individual physiologic parameters are defined, we will analyze the interactive effects of the parameters and determine the best overall and organ system specific indicators of patient status. Only by employing rigorous scientific process can we create data-driven alarm systems for individual patients to predict deterioration or poor outcome. Finally, we must replicate the system in other clinical contexts to determine if patterns of physiologic response observed thus far are applicable to other populations of hospitalized patients.
CONCLUSIONS
In conclusion, CVRD is potentially the first new vital sign born from the concept of dense physiologic data capture in the ICU. CVRD predicts death in the first 24 hours of ICU stay, with 70% sensitivity and 80% specificity when incorporating age and ISS. We hypothesize CVRD is a measure of autonomic dysfunction and have demonstrated that patients who lose short-term volatility are at higher risk for death. Further studies are under way to more robustly define CVRD and assess its clinical utility. Dense physiologic data capture may be a powerful new tool for defining subgroups of patients with poor outcome.
ACKNOWLEDGMENTS
This material is based upon work supported by the Office of Academic Affiliations, Department of Veterans Affairs, Vanderbilt University Medical Center, and General Clinical Research Center: M01-RR0095.
Discussions
Dr. Robert J. Winchell (Portland, Maine): I very much enjoyed the presentation, and I would like to commend the authors both for the data that they presented today and also for the underlying data collection and analysis system that they have developed, and that is indeed novel. Certainly, we collect a lot of data in the ICU, but we analyze it very imprecisely. We do not appreciate much of the data that is potentially there, because we simply are not looking for it. This area of investigation has incredible potential.
I have 3 brief questions. One, how did you arrive at the threshold value of 0.5 for your lower level of standard deviation? Second, have you considered the effect of arrhythmia within your data set? This is a known confounder in other analyses of heart rate variability in these analyses of heart rate variability in these settings. Finally, have you begun to try and link your episodes of variability related disorder to the other physiologic parameters within your data set?
Dr. Richard J. Mullins (Portland, Oregon): Dr. Morris, congratulations on your novel observations in this challenging group of patients.
Is the loss of HRV a physiologic indication, in your judgment, Dr. Morris, of cerebral ischemia and therefore can we use loss of HRV in a practical realtime way to identify a patient with a cerebral ischemic episode. Do you see a realtime application of this technology to therapeutic decision making?
My second question, Dr. Morris, did you look at the pharmacologic manipulation of the patients as a factor determining variation in HRV response?
Dr. David B. Hoyt (San Diego, California): Dr. Morris, a very nice study.
Heart rate variability is a real phenomenon that goes largely undetected in our current ICU monitoring systems, and your analysis and others like it allow us to observe subtle changes that we normally don't see, just as new radiographic tests undercover pathology that we have not previously appreciated.
Our ability to assess autonomic dysfunction I think is going to be increasingly important. Overall autonomic exhaustion becomes a symptom that may emerge as a predictor of mortality, as you suggest. Whether this reflects autonomic signal instability or apoptosis is unclear, but this type of study increasingly allows us to identify these phenomenons, understand them and their association with death, and ultimately target therapy.
Our understanding currently of the autonomic system and the relationship to shock and post-injury inflammation is an object of intense study. In fact, your observations are in direct alignment with the specific goals of the NIH road map for computational biology and bioinframatics. So a better understanding of autonomic function is important. I have 3 questions.
First of all, which group of patients now and in the future should actually have this kind of monitoring? I realize you are still studying it. But what do you think will be the future?
Second, shouldn't we in fact be studying this in animal models, particularly chronic animal models of sepsis, head injury, and multiple organ failure? Animal models would substantiate what are really at this point observational phenomenons.
Finally, what is the likely cost of this, and is the industry going to in fact pick up on this as a value added, or is this simply going to be something that is going to remain investigational?
Again I enjoyed your study and your presentation and I thank you for the opportunity to discuss it.
Dr. Gregory J. Jurkovich (Seattle, Washington): Dr. Morris, congratulations on a beautiful blend of bioengineering and the medical sciences. I have 2 questions that pertain to the outcome measures.
If I understood the presentation and the abstract, you excluded patients who were in the Simon bed for greater than 10 days. ICU deaths generally occur in 2 different time frames: the acute deaths and the rather late deaths. I am curious why you excluded those late deaths.
Secondly, you gave a hint that the mechanism of injury may be an important predictor of who might have this autonomic dysfunction. Specifically, did you characterize the injury by AIS score or by injury location, such as head injury, in those patients who were more likely to have less variability in the heart rate?
Dr. Basil A. Pruitt, Jr. (San Antonio, Texas): Since the heart rate volatility change in the first 24 hours was the best predictor of death, does this simply reflect the intensity or frequency of pharmacologic intervention which might be greatest during that time period? If you are going to use changes in HR volatility to predict death, how secure would you be in determining futility and ceasing care in the first 24 hours based upon these data?
Dr. John A. Morris, Jr. (Nashville, Tennessee): First of all let me start with Dr. Hoyt's questions because they are the most fundamental.
What is the target group for this monitoring strategy? And the simple answer is, we don't know. We have every intention of looking at these tools in the non-ICU environment to see if they are early harbingers of deterioration. But we simply don't have that data yet.
Second, what do these systems cost? Back of the envelope, it is about $3000 a bed. Let me put in perspective for you that the Hewlett Packard monitor is about $20,000 a bed.
And finally, what about the use of animal models in terms of supporting this kind of work? I think there is going to be tremendous need to do that. But I think that those models will become most effective for us once we have defined what the individual aberrations within these parameters are and start to look at the interaction between those aberrations.
And that gets to a whole series of questions, some by Dr. Pruitt and Dr. Jurkovich, what other things have we looked at, at this point in time? Well, the answer is not much, because we spent a lot of time looking at 120 million data points.
Do we have the ability? Given the data sets that we have currently linked, yes, we have the ability. We don't have yet the analytical fire power needed to analyze these large data sets. There are a whole series of new collaborations and new disciplines that are going to emerge from analyzing these dense data sets continuing promise.
Finally, Dr. Winchell's questions are somewhat technical in nature. Why did we choose 0.5? Thank you for anticipating our AAST submission where we will show where that data comes from. The use of arrhythmias. We have not looked at that. WAVE form analysis is by far a stronger tool, and we are currently collecting WAVE form data.
And Dr. Jurkovich, about the 10 days—you are correct. People die early or they die late. And they die late of sepsis. We do not have Simon operational in our septic unit. That was one of the reasons why we use that 10-day cut-off.
I think Dr. Hoyt's observation about physiologic reserve hits the nail right on the head here. What we are seeing in the first 24 hours is a new, unexpected indicator of physiologic reserve. It is our profound hope that we are going to be able to use that concept of physiologic reserve, not only in the first 24 hours where we are used to thinking about it, but throughout the course of a patient's stay including defining when damage control patients are ready to go to the operating room.
Footnotes
Address correspondence to: John A. Morris Jr., MD, Department of Surgery, Vanderbilt University, 2100 Pierce Ave, 243 MCS, Nashville, TN. E-mail: John.Morris@vanderbilt.edu.
REFERENCES
- 1.Cushing HW. On routine determination of arterial tension in operating room and clinic. Boston Med Surg J. 1903;148:250–256. [Google Scholar]
- 2.Boldt J. Clinical review: hemodynamic monitoring in the intensive care unit. Crit Care. 2002;6:52–59. [DOI] [PMC free article] [PubMed] [Google Scholar]
- 3.Kohli-Seth R, Oropello JM. The future of bedside monitoring. Crit Care Clin. 2000;16:557–578, vii–viii. [DOI] [PubMed] [Google Scholar]
- 4.Zenati MS, Billiar TR, Townsend RN, et al. A brief episode of hypotension increases mortality in critically ill trauma patients. J Trauma. 2002;53:232–236. [DOI] [PubMed] [Google Scholar]
- 5.Stein PK, Schmieg RE Jr, El-Fouly A, et al. Association between heart rate variability recorded on postoperative day 1 and length of stay in abdominal aortic surgery patients. Crit Care Med. 2001;29:1738–1743. [DOI] [PubMed] [Google Scholar]
- 6.Haji-Michael PG, Vincent JL, Degaute JP, et al. Power spectral analysis of cardiovascular variability in critically ill neurosurgical patients. Crit Care Med. 2000;28:2578–2583. [DOI] [PubMed] [Google Scholar]
- 7.Winchell RJ, Hoyt DB. Analysis of heart-rate variability: a noninvasive predictor of death and poor outcome in patients with severe head injury. J Trauma. 1997;43:927–933. [DOI] [PubMed] [Google Scholar]
- 8.Czosnyka M, Smielewski P, Kirkpatrick P, et al. Continuous assessment of the cerebral vasomotor reactivity in head injury. Neurosurgery. 1997;41:11–17. [DOI] [PubMed] [Google Scholar]
- 9.Tibby SM, Frndova H, Durward A, et al. Novel method to quantify loss of heart rate variability in pediatric multiple organ failure. Crit Care Med. 2003;31:2059–2067. [DOI] [PubMed] [Google Scholar]
- 10.Pontet J, Contreras P, Curbelo A, et al. Heart rate variability as early marker of multiple organ dysfunction syndrome in septic patients. J Crit Care. 2003;18:156–163. [DOI] [PubMed] [Google Scholar]
- 11.Steinmeier R, Hofmann RP, Bauhuf C, et al. Continuous cerebral autoregulation monitoring by cross-correlation analysis. J Neurotrauma. 2002;19:1127–1138. [DOI] [PubMed] [Google Scholar]
- 12.Norris P, Dawant B, Suwanmongkol K. Closing the loop in ICU decision support: events, alerts, and documentation. Proceedings of the AMIA Symposium, 2001. [PMC free article] [PubMed]
- 13.Grogan EL, Norris PR, Speroff T, et al. Volatility: a new vital sign identified using a novel bedside monitoring strategy. J Trauma Injury Infect Crit Care. In press. [DOI] [PubMed]
- 14.Winchell RJ, Hoyt DB. Spectral analysis of heart rate variability in the ICU: a measure of autonomic function. J Surg Res. 1996;63:11–16. [DOI] [PubMed] [Google Scholar]
- 15.Pumprla J, Howorka K, Groves D, et al. Functional assessment of heart rate variability: physiological basis and practical applications. Int J Cardiol. 2002;84:1–14. [DOI] [PubMed] [Google Scholar]
- 16.Barnaby D, Ferrick K, Kaplan DT, et al. Heart rate variability in emergency department patients with sepsis. Acad Emerg Med. 2002;9:661–670. [DOI] [PubMed] [Google Scholar]
- 17.Boero R, Pignataro A, Ferro M, et al. Sympathetic nervous system and chronic renal failure. Clin Exp Hypertens (New York). 2001;23:69–75. [DOI] [PubMed] [Google Scholar]
- 18.Baker SP, O'Neill B, Haddon W Jr, et al. The injury severity score: a method for describing patients with multiple injuries and evaluating emergency care. J Trauma. 1974;14:187–196. [PubMed] [Google Scholar]
- 19.Baker SP. Editorial: 28,000 gun deaths a year: what is our role? J Trauma. 1976;16:510–511.933221 [Google Scholar]
- 20.Task Force of the European Society of Cardiology and the North American Society of Pacing and Electrophysiology. Heart rate variability: standards of measurement, physiological interpretation and clinical use. Circulation. 1996;93:1043–1065. [PubMed] [Google Scholar]
- 21.Goldstein B, McNames J, McDonald BA, et al. Physiologic data acquisition system and database for the study of disease dynamics in the intensive care unit. Crit Care Med. 2003;31:433–441. [DOI] [PubMed] [Google Scholar]
- 22.Bardt TF, Unterberg AW, Kiening KL, et al. Multimodal cerebral monitoring in comatose head-injured patients. Acta Neurochirurg. 1998;140:357–365. [DOI] [PubMed] [Google Scholar]
- 23.Krieger D, Onodipe S, Charles PJ, et al. Real time signal processing in the clinical setting. Ann Biomed Eng. 1998;26:462–472. [DOI] [PubMed] [Google Scholar]
- 24.Wang K, Kohane I, Bradshaw KL, et al. A real time patient monitoring system on the World Wide Web. Proc AMIA Symp. 1996:729–732. [PMC free article] [PubMed] [Google Scholar]
- 25.Barro S, Presedo J, Castro D, et al. Intelligent telemonitoring of critical-care patients. IEEE Eng Med Biol Mag. 1999;18:80–88. [DOI] [PubMed] [Google Scholar]
- 26.Rosenfeld BA, Dorman T, Breslow MJ, et al. Intensive care unit telemedicine: alternate paradigm for providing continuous intensivist care. Crit Care Med. 2000;28:3925–3931. [DOI] [PubMed] [Google Scholar]