

Abstract
Monastrol is a small, cell-permeable molecule that arrests cells in mitosis by specifically inhibiting Eg5, a member of the Kinesin-5 family. We have used steady-state and presteady-state kinetics as well as equilibrium binding approaches to define the mechanistic basis of S-monastrol inhibition of monomeric human Eg5/KSP. In the absence of microtubules (Mts), the basal ATPase activity is inhibited through slowed product release. In the presence of microtubules, the ATPase activity is also reduced with weakened binding of Eg5 to microtubules during steady-state ATP turnover. Monastrol-treated Eg5 also shows a decreased relative affinity for microtubules under equilibrium conditions. The Mt·Eg5 presteady-state kinetics of ATP binding and the subsequent ATP-dependent isomerization are unaffected during the first ATP turnover. However, monastrol appears to stabilize a conformation that allows for reversals at the ATP hydrolysis step. Monastrol promotes a dramatic decrease in the observed rate of Eg5 association with microtubules, and ADP release is slowed without trapping the Mt·Eg5·ADP intermediate. We propose that S-monastrol binding to Eg5 induces a stable conformational change in the motor domain that favors ATP re-synthesis after ATP hydrolysis. The aberrant interactions with the microtubule and the reversals at the ATP hydrolysis step alter the ability of Eg5 to generate force, thereby yielding a nonproductive Mt·Eg5 complex that cannot establish or maintain the bipolar spindle.
Accurate segregation of replicated chromosomes during cell division depends on the correct assembly and proper maintenance of the bipolar spindle (reviewed in Refs. 1–15). Several members of the kinesin superfamily localize to the mitotic spindle, and inhibition of one or more of these motors leads to drastic spindle abnormalities and loss of normal chromosome segregation (reviewed in Refs. 3, 16–18). Monastrol is a reversible, cell-permeable, small molecule that selectively inhibits the plus-end-directed Kinesin-5 family member, Eg5 (19–23), a microtubule-based motor protein that is required for the formation and maintenance of the bipolar spindle (24–26). On the other hand, monastrol does not bind to or inhibit the ATPase activity of other well studied kinesin superfamily members (22, 27). Monastrol treatment of dividing cells results in spindle collapse and cell cycle arrest with a monoastral spindle, which is similar to the phenotype observed when Eg5 is inhibited by anti-Eg5 antibodies (20, 24, 25, 28). Recently, Eg5 inhibitors with nanomolar affinity have been identified (29–31).
Previous studies with monastrol have revealed an induced-fit, allosteric binding site outside the nucleotide binding pocket of the protein (21–23, 31). By comparing the monastrol-treated Eg5 crystal structure (Eg5S·ADP)1 (23) to the Eg5·ADP structure (32), monastrol appears to induce dramatic conformational changes throughout the catalytic core, including transformation of the insertion loop (L5) of helix α2 and the neck-linker/switch II cluster without considerably altering the structure of the nucleotide-binding site (23). How these conformational changes alter the ATPase mechanism of Eg5 and disturb force generation by the Mt·Eg5 complex is not well understood. Monastrol has been shown to inhibit ADP release in the absence and presence of microtubules (21, 22). Also, a recent study using motility assays suggests that monastrol produces an Eg5 state that is weakly bound to the microtubule (33).
In this study, we utilized kinetic and thermodynamic approaches to define the molecular basis of Eg5 inhibition by S-monastrol, the more active enantiomer for inhibition (21–23). We have evaluated two monomeric human Eg5 motors, Eg5–367 and Eg5–437 (21–23). The ATPase mechanism of both monomeric Eg5 motors has been well characterized (34), which provides a foundation to better understand the molecular basis of S-monastrol effects on microtubule-based motility. The kinetics and equilibrium binding characteristics of Eg5S presented here reveal an aberrant ATPase cycle, whereby S-monastrol stabilizes a conformation of the Eg5 motor domain such that the Mt·Eg5S·ADP·Pi intermediate can re-synthesize ATP after the forward hydrolysis event. In addition, our data are consistent with the microtubule-binding ability of the motor being compromised by S-monastrol binding. Taken together, monastrol promotes an ineffective Mt·Eg5S complex that cannot generate the force required to establish and maintain the bipolar mitotic spindle for chromosome segregation.
MATERIALS AND METHODS
Experimental Conditions, S-Monastrol, and Me2SO Control
Experiments were performed at 25 °C in ATPase buffer (20 mm Hepes, pH 7.2 with KOH, 5 mm magnesium acetate, 0.1 mm EDTA, 0.1 mm EGTA, 50 mm potassium acetate, 1 mm dithiothreitol, 5% sucrose). Previous studies have indicated that the S-enantiomer of monastrol was more active than either its R counterpart or the racemic mixture (21–23). We have confirmed these results (data not shown) and have used the S-enantiomer in all experiments presented here (a generous gift from Merck Research Laboratories). Our S-monastrol stock (100 mm) was prepared in Me2SO (analytical grade; Sigma-Aldrich Co.). For each experiment, a 1 mm S-monastrol stock was prepared by diluting the 100 mm stock to 1 mm in ATPase buffer (~1% Me2SO). A Me2SO control stock was also prepared by dilution of the same volume of Me2SO in ATPase buffer. In all control experiments shown, the concentration of Me2SO was equivalent to the Me2SO concentration at the corresponding S-monastrol concentration. All concentrations reported for experiments were final after mixing.
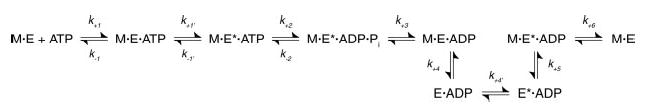
Scheme 1.
Protein Preparation
We have expressed and purified two human Eg5 motors (Eg5–367 and Eg5–437) as described previously (34). We determined the Eg5 protein concentration by the Bio-Rad Protein Assay (Bio-Rad) with IgG as the protein standard. On the day of each experiment, an aliquot of purified bovine brain tubulin was thawed and cycled, and the microtubules were stabilized with 20 μm Taxol (paclitaxel, Sigma-Aldrich Co.).
Steady-state ATPase Kinetics
The inhibition of Eg5 steady-state ATP turnover by S-monastrol was determined by monitoring [α-32P]ADP·Pi product formation in the absence and presence of microtubules (as described previously (35)). In the absence of microtubules, Eg5 was treated with varying concentrations of S-monastrol for 30 min and reacted with [α-32P]MgATP. In Fig. 1A, the inhibition of the rate of the basal ATPase activity was plotted as a function of S-monastrol concentration, and each data set was fit to the following quadratic equation,
Fig 1. Monastrol inhibition of Eg5 steady-state ATPase.
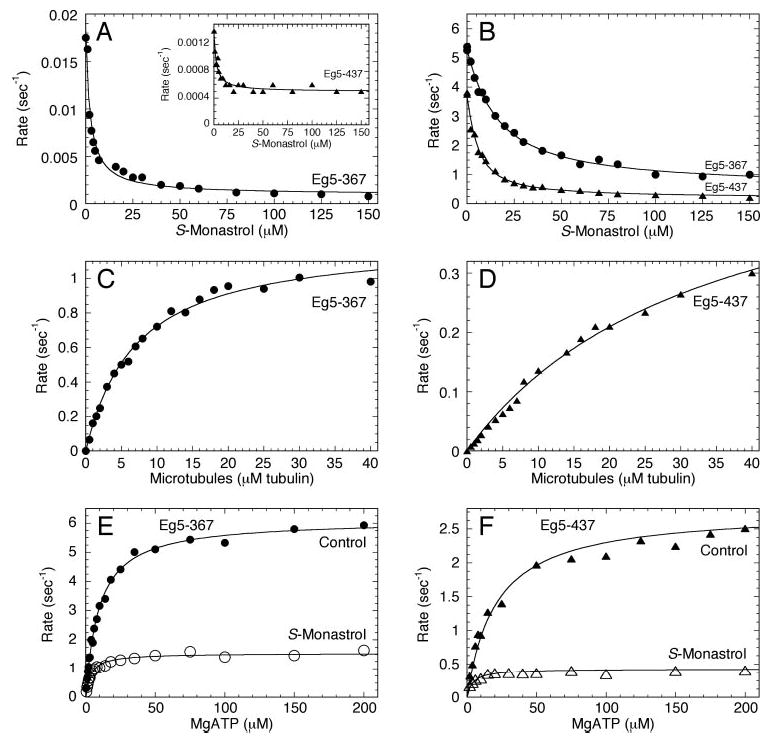
A, in the absence of Mts, Eg5·ADP was treated with varying concentrations of S-monastrol for 30 min and was reacted with MgATP. Final concentrations: 1 μm Eg5, 0–150 μm S-monastrol, and 100 μm [α-32P]MgATP. The rate of product formation was plotted as a function of S-monastrol concentration, and each data set was fit to Equation 1. For Eg5–367 (•), Kd,S = 2.3 ± 0.4 μm. Inset, Eg5–437 (▴), Kd,S = 2.5 ± 0.5 μm. B, Eg5·ADP was treated with varying concentrations of S-monastrol for 30 min, and then the Mt·Eg5S complex was formed and reacted with MgATP. Final concentrations: 1 μm Eg5, 30 μm tubulin, 20 μm Taxol, 0–150 μm S-monastrol, and 1 mm [α-32P]MgATP. For Eg5–367 (•), Kd,S = 13.8 ± 1.0 μm and for Eg5–437 (▴), Kd,S = 4.0 ± 0.4 μm. C, Eg5–367 was treated with S-monastrol for 30 min and then the Mt·Eg5S complex was formed with increasing microtubule concentrations and reacted with MgATP. Final concentrations: 1 μm Eg5, 0–40 μm tubulin, 20 μm Taxol, 150 μm S-monastrol, and 500 μm [α-32P]MgATP. Data were fit to Equation 2, and the steady-state parameters were kcat = 1.22 ± 0.03 s−1 and K½,Mt = 6.7 ± 0.4 μm. D, Eg5–437 under similar conditions as Panel C: kcat = 0.56 ± 0.03 s−1 and K½,Mt = 33.3 ± 3.3 μm. E, Eg5–367 (with or without S-monastrol) was incubated for 30 min, and then the Mt·Eg5S complex was formed and reacted with increasing MgATP concentrations. Final concentrations: 0.1 μm Eg5, 20 μm tubulin, 20 μm Taxol, ±150 μm S-monastrol, and 0.5–200 μm [α-32P]MgATP. Data were fit to the Michaelis-Menten equation, and the steady-state parameters were determined (control: kcat = 6.10 ± 0.07 s−1 and Km,ATP = 9.5 ± 0.4 μm; S-monastrol: kcat = 1.54 ± 0.03 s−1 and Km,ATP = 3.6 ± 0.3 μm). F, Eg5–437 under similar conditions as Panel C. Control: kcat = 2.77 ± 0.08 s−1 and Km,ATP = 20.7 ± 3.2 μm; S-monastrol: kcat = 0.43 ± 0.01 s−1 and Km,ATP = 4.1 ± 0.7 μm).
| (Eq. 1) |
where the Rate is the amount of product formed per second per active site, Ainh is the amplitude of S-monastrol inhibition defined by kmax (kcat at no S-monastrol) minus kmin (kcat at saturating S-monastrol), Kd,S is the apparent dissociation constant for S-monastrol, and S0 is the S-monastrol concentration.
In the presence of microtubules, Eg5 was treated with increasing concentrations of S-monastrol for 15 min, incubated with microtubules for 30 min, and then reacted with [α-32P]MgATP. Fig. 1B shows the steady-state rate of ATP turnover as a function of S-monastrol concentration, and each data set was fit to Equation 1. In Fig. 1 (C and D), the rate of ATP turnover at constant S-monastrol and [α-32P]MgATP concentrations was plotted as a function of microtubule concentration for each Eg5 motor, and the data were fit to the following quadratic equation,
| (Eq. 2) |
where the Rate is the concentration of product formed per second per active site, kcat is the maximum rate constant of product formation at saturating substrate, E0 is the total Eg5 site concentration, K ½,Mt is the microtubule concentration needed to provide one-half the maximal velocity, and Mt0 is the microtubule concentration. In Fig. 1 (E and F), the rate of ATP turnover at constant S-monastrol and microtubule concentrations was plotted as a function of [α-32P]MgATP concentration for each Eg5 motor, and each data set was fit to the Michaelis-Menten equation.
Mt·Eg5S Cosedimentation Assays
Equilibrium binding experiments were performed where Eg5 was treated with or without S-monastrol for 15 min, followed by incubation with increasing microtubule concentrations for 30 min either in the absence of additional nucleotide (Fig. 2A and B) or in the presence of different nucleotides (Fig. 2C) (as described previously (34, 36)). The Mt·Eg5 complexes were pelleted by centrifugation in a Beckman Airfuge (Beckman Coulter Inc., Fullerton, CA) at 30 p.s.i. (100,000 × g) for 30 min. Gel samples were prepared for the supernatant and pellet fractions at equal volumes for each microtubule concentration, and the proteins were resolved by SDS-PAGE and stained with Coomassie Brilliant Blue R-250. In Fig. 2A, each data set was fit to the following quadratic equation,
Fig 2. Mt·Eg5S cosedimentation experiments.
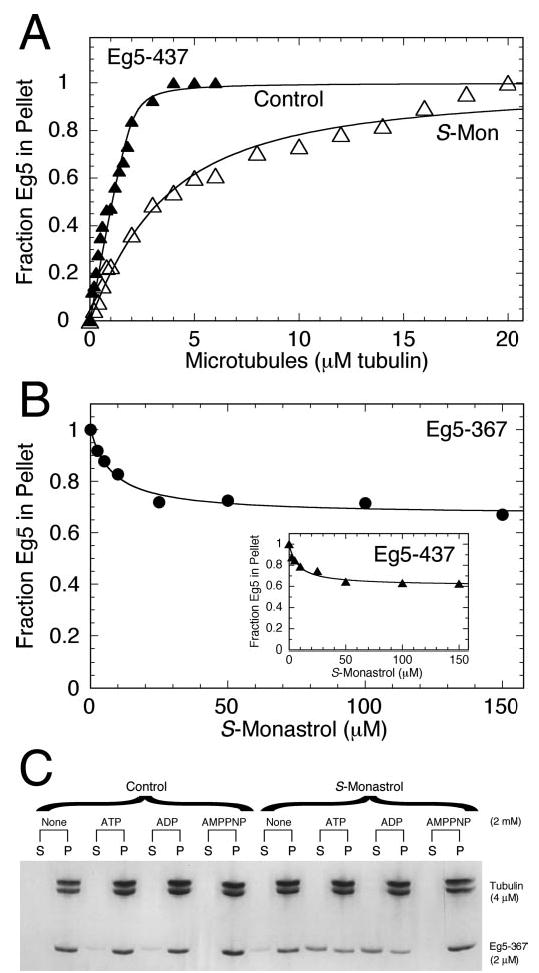
A, in the absence of additional nucleotide, Eg5 was treated with or without S-monastrol for 15 min, followed by incubation with increasing concentrations of microtubules for 30 min. Final concentrations: 2 μm Eg5–437, 0–6 μm tubulin for control, 0–20 μm tubulin for S-monastrol, 20 μm Taxol, and 150 μm S-monastrol. The fraction of Eg5 in the microtubule pellet was plotted as a function of the total microtubule concentration, and the data were fit to Equation 3. In the absence of S-monastrol (▴), the Kd,Mt = 0.07 ± 0.03 μm, and in the presence of S-monastrol (▵), Kd,Mt = 2.3 ± 0.2 μm. B, Eg5 was treated with increasing S-monastrol concentrations for 15 min, followed by incubation with Mts for 30 min. Final concentrations: 2 μm Eg5, 4 μm tubulin, 20 μm Taxol, and 0–150 μm S-monastrol. The fraction of Eg5 in the microtubule pellet was plotted as a function of S-monastrol concentration. C, an image of a Coomassie Blue-stained SDS gel from Mt·Eg5S cosedimentation experiments at different nucleotide conditions. Eg5 was treated with or without S-monastrol for 15 min, followed by incubation with Mts for 30 min. Each nucleotide was rapidly mixed with the solution at the end of the incubation, and the reaction mixture was immediately subjected to centrifugation. Final concentrations: 2 μm Eg5–367, 4 μm tubulin, 20 μm Taxol, 150 μm S-monastrol, and 2 mm AXP. The supernatant (S) and pellet (P) for each reaction were loaded consecutively with an indication of the additional nucleotide above each supernatant/pellet pair.
| (Eq. 3) |
where Mt·E/E0 is the fraction of Eg5 partitioning with the microtubule pellet, E0 is total Eg5 site concentration, Kd, Mt defines the upper limit for the equilibrium dissociation constant, and Mt0 is the microtubule concentration.
Acid-quench Experiments
The kinetics of ATP hydrolysis for Eg5 in the presence of S-monastrol were defined through a series of acid-quench experiments using a chemical quench-flow instrument (Kintek Corp., Austin, TX) (Figs. 4 and 5). In all experiments, a preformed Mt·Eg5 complex (with or without S-monastrol) was rapidly mixed with [α-32P]MgATP (with or without S-monastrol) plus 100 mm KCl. The additional salt was added to the MgATP syringe to lower Eg5 steady-state ATPase activity without affecting the kinetics of the first ATP turnover (Fig. 4F). The reaction continued for various times (from 5 ms to 1 s), was quenched with formic acid, and radiolabeled product formation was quantified (as described previously (35)). The concentration of [α-32P]ADP was plotted as a function of time, and the data were fit to the following burst equation,
Fig 4. ATP hydrolysis kinetics for the Mt·Eg5S complex.
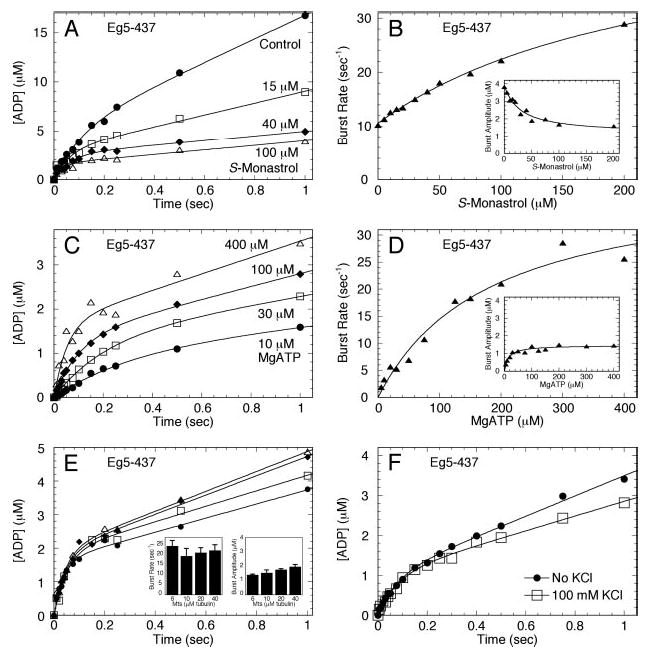
A, time course of [α-32P]ADP·Pi formation after rapidly mixing a preformed Mt·Eg5S complex with MgATP plus additional KCl to lower steady-state turnover (see “Materials and Methods”). Final concentrations: 5 μm Eg5–437, 6 μm tubulin, 20 μm Taxol, 0–200 μm S-monastrol, 300 μm MgATP, and 100 mm KCl. B, the observed exponential rate of the burst phase was plotted as a function of S-monastrol concentration. The fit of the data to a hyperbola provided the observed rate constant for ATP hydrolysis at 49.9 ± 3.4 s−1. Inset, the amplitude of the burst phase decreased as a function of S-monastrol concentration. The data were fit to Equation 1, yielding an apparent Kd,S = 29 ± 9 μm. C, time course of radiolabeled product formation by Mt·Eg5S complex at increasing MgATP concentrations. Final concentrations: 5 μm Eg5–437, 6 μm tubulin, 20 μm Taxol, 100 μm S-monastrol, 10–400 μm MgATP, and 100 mm KCl. D, the exponential burst rate was plotted as a function of MgATP concentration. The fit of the data to a hyperbola defined the maximum burst rate of ATP hydrolysis for Eg5–437 in the presence of S-monastrol, kmax = 36.3 ± 3.2 s−1 and the Kd,ATP = 154 ± 28 μm. Inset, the amplitude of the burst phase was plotted as a function of MgATP concentration. The data were fit to a hyperbola yielding a maximum burst amplitude at 1.3 ± 0.1 μm, and the Kd,ATP = 15 ± 3 μm. E, time course of ADP·Pi formation by the Mt·Eg5–437S complex at increasing microtubule concentrations. Final concentrations: 5 μm Eg5–437, 6–40 μm tubulin, 20 μm Taxol, 100 μm S-monastrol, 300 μm MgATP, and 100 mm KCl. Insets, the burst rate and burst amplitude of each transient are shown, respectively. Error bars represent the standard error in the fit of the data. F, time course of ADP·Pi formation by the Mt·Eg5S-437 complex ± 100 mm KCl with the MgATP. Final concentrations: 5 μm Eg5–437, 20 μm tubulin, 20 μm Taxol, 100 μm S-monastrol, 100 μm MgATP, ± 100 mm KCl. Each data set was fit to Equation 4. No KCl (•):kb = 12.7 ± 1.6 s−1, Ao = 0.95 ± 0.06 μm, and kss = 2.5 ± 0.1 μm ADP·s−1. Reaction with 100 mm KCl (□): kb = 12.4 ± 1.7 s−1, Ao = 1.01 ± 0.07 μm, and kss = 1.8 ± 0.1 μm ADP·s−1.
Fig 5. Acid-quench experiments to evaluate sequential addition of S-monastrol.
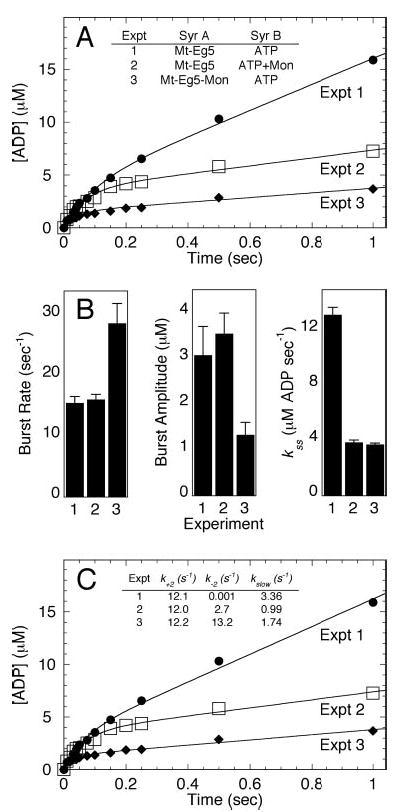
A, the time course of product formation under three different experimental conditions. Experiment 1 (Expt. 1): Mt·Eg5 complex was reacted with MgATP (▪). Expt. 2: Mt·Eg5 complex was reacted with MgATP plus S-monastrol (□). Expt. 3: Mt·Eg5 complex plus S-monastrol was reacted with MgATP (♦). Final concentrations: 5 μm Eg5–437, 6 μm tubulin, 20 μm Taxol, 100 μm S-monastrol, 200 μm MgATP, and 100 mm KCl. The data for each experiment were fit to Equation 4. B, the exponential burst rate, burst amplitude, and the rate constant of the linear phase defining steady-state turnover were plotted for each experimental setup. Error bars represent the standard error in the fit of the data. C, the data from panels A and B were modeled to Equations 4–7 to define the ATP hydrolysis constants k+2, k−2, and kslow (Scheme 1 and Table I).
| (Eq. 4) |
where A0 is the amplitude of the presteady-state burst phase that corresponds to accumulation of product at the Eg5 active site during the first turnover; kb is the rate constant of the exponential burst phase; t is time in seconds; and kss is the rate constant of the linear phase (μm ADP·s−1) defining steady-state turnover. In Fig. 4 (B and D), the exponential burst rate (kb) and burst amplitude (A0) were plotted as a function of S-monastrol and MgATP concentration, respectively, and each data set was fit to a hyperbola.
Modeling of Burst Kinetics
For a kinetic pathway, including a reversible chemical reaction (Scheme 1), the time dependence of product formation follows Equation 4 where the rates and amplitude are defined by the following equations (37),
| (Eq. 5) |
| (Eq. 6) |
| (Eq. 7) |
where k+2 is the exponential rate constant for ATP hydrolysis, k−2 is the rate constant for the reverse hydrolysis reaction (ATP re-synthesis), kslow is the rate of the slow step in the pathway that occurs after ATP hydrolysis, and E0 is the Eg5 site concentration. In Fig. 5C, the data from Fig. 5A were modeled to Equations 4–7 to define the ATP hydrolysis constants k+2, k−2, and kslow (Scheme 1). The following assumptions were made in the modeling: 1) for Experiment 3, the Eg5 site concentration that represents the Mt·Eg5 complex was approximated using data from cosedimentation experiments (Fig. 2) performed under similar experimental conditions, and 2) the rate constant k−2 was extremely slow in the absence of S-monastrol and was assigned 0.001 s−1. The rate constants, k+2, k−2, and kslow, were all allowed to float in the analysis.
Stopped-flow Experiments
To investigate the effect of S-monastrol on mantATP binding, Eg5S association with Mts, and mantADP release, several stopped-flow experiments were performed using a SF-2003 Kintek stopped-flow instrument (Kintek Corp.). For racemic mantATP or -ADP experiments, fluorescence emission at 450 nm was measured using a 400-nm cutoff filter with excitation at 360 nm (mercury arc lamp). In Fig. 3B, the mantATP binding data in the absence or presence of S-monastrol were fit to the following hyperbola,
Fig 3. MantATP binding to the Mt·Eg5S complex.
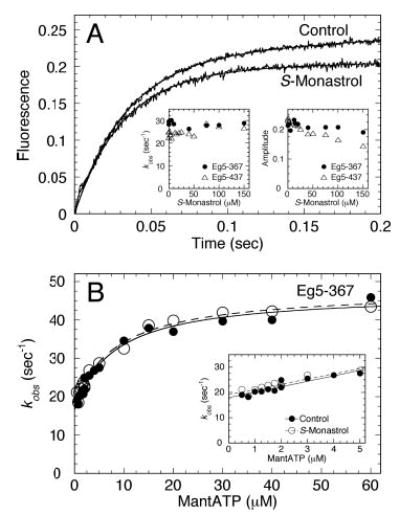
A, Eg5 was treated with increasing concentrations of S-monastrol, followed by incubation with Mts for 30 min. Final concentrations: 3 μm Eg5, 10 μm tubulin, 20 μm Taxol, 0–150 μm S-monastrol, and 10 μm mantATP. The preformed Mt·Eg5S complex was rapidly mixed in the stopped-flow instrument with mantATP and two representative transients for Eg5–367 (±150 μm S-monastrol) are shown. Insets, the observed rate and amplitude of the exponential increase in fluorescence were plotted as a function of S-monastrol concentration. B, Eg5–367 was incubated in the presence or absence of S-monastrol, and the preformed Mt·Eg5 complexes were reacted with increasing mantATP concentrations. Final concentrations: 0.5 μm Eg5 for 0.5–3 μm mantATP and 3 μm Eg5 for 3–60 μm mantATP, 10 μm tubulin, 20 μm Taxol, and 150 μm S-monastrol. The observed rate of the fast exponential increase in fluorescence was plotted as a function of mantATP concentration, and the data were fit to a hyperbola. In the absence of S-monastrol (•), kmax = 47.0 ± 2.3 s−1, K½,mATP = 7.9 ± 1.6 μm, koff = 18.0 ± 0.7 s−1. In the presence of S-monastrol (○), kmax = 47.8 ± 1.9 s−1, K½,mATP = 9.4 ± 1.9 μm, koff = 19.1 ± 0.7 s−1. Inset, the observed rate of mantATP binding at the lowest mantATP concentrations. The data were fit to Equation 8 to yield the second-order rate constant for mantATP binding in the absence (2.2 ± 0.3 μm−1s−1) and in the presence of S-monastrol (2.1 ± 0.3 μm−1s−1).
| (Eq. 8) |
where kobs is the exponential rate constant obtained from the fluorescence enhancement, kmax is the maximum rate of mantATP binding, K½,mantATP is the concentration of mantATP required to provide half kmax, and koff is the observed rate of mantATP dissociation obtained from the y-intercept. The mantATP binding data at low mantATP concentrations (Fig. 3B, inset) were fit to the following linear function,
| (Eq. 9) |
where k+1 is the second-order rate constant for mantATP binding, and koff represents mantATP dissociation from the active site.
The kinetics of Eg5S association with Mts (Fig. 6) was determined by monitoring the change in solution turbidity at 340 nm using a stopped-flow instrument. The observed rate constant of Eg5S association with Mts was plotted as a function of S-monastrol concentration (Fig. 6B and C), and the data were fit to the following quadratic equation,
Fig 6. Eg5S association with microtubules.
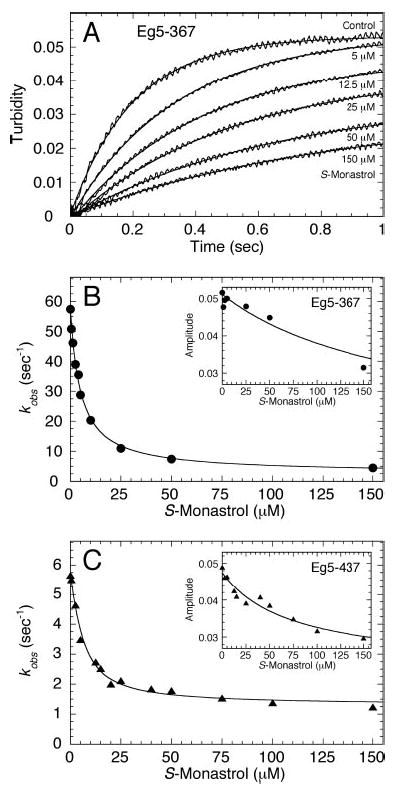
Eg5 was treated with increasing S-monastrol concentrations then rapidly mixed in the stopped-flow instrument with Taxol-stabilized microtubules. Final concentrations: 5 μm Eg5, 6 μm tubulin, 20 μm Taxol, and 0–150 μm S-monastrol. A, representative stopped-flow transients are shown at various S-monastrol concentrations (as indicated). Each transient was fit to a single exponential function. B, for Eg5–367 (•), the rate constant obtained from the rapid exponential phase of each transient in A was plotted as a function of S-monastrol concentration. The data were fit to Equation 10, yielding Kd,S = 5.1 ± 0.4 μm. C, for Eg5–437 (▴), the observed rate of Mt association versus S-monastrol concentration; Kd,S = 6.2 ± 0.7 μm. Insets for B and C, the amplitude of the exponential phase versus S-monastrol concentration for each Eg5 motor, respectively.
| (Eq. 10) |
where kobs is the observed exponential rate obtained from the change in turbidity, Ainh defines the amplitude of S-monastrol inhibition equal to kmax (kobs with no S-monastrol) minus kmin (kobs at saturating S-monastrol), Kd,S is the apparent dissociation constant for S-monastrol, and S0 is the S-monastrol concentration.
mantADP release from the Mt·Eg5S·mantADP complex was determined by preincubating Eg5 with mantADP at a 1:2 ratio (Eg5:mant-ADP) to exchange ADP for mantADP at the nucleotide pocket, followed by treatment with increasing concentrations of S-monastrol for 15 min. This reaction mixture was then rapidly mixed with microtubules plus MgATP (to effectively prevent mantADP re-binding), and the fluorescence emission at 450 nm was monitored (Fig. 7). The observed rate and amplitude of mantADP release obtained from the fluorescence reduction were plotted as a function of S-monastrol concentration, and each data set was fit to Equation 10.
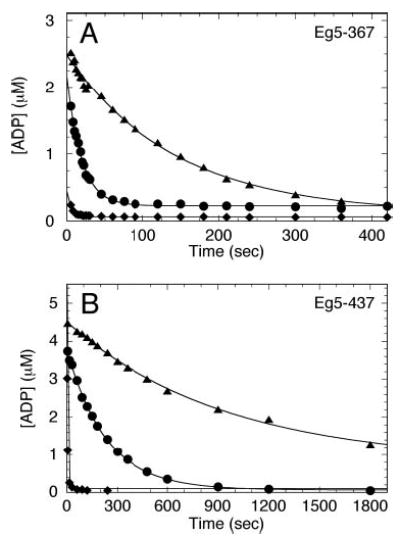
Fig 7. MantADP release from Mt·Eg5S complex.
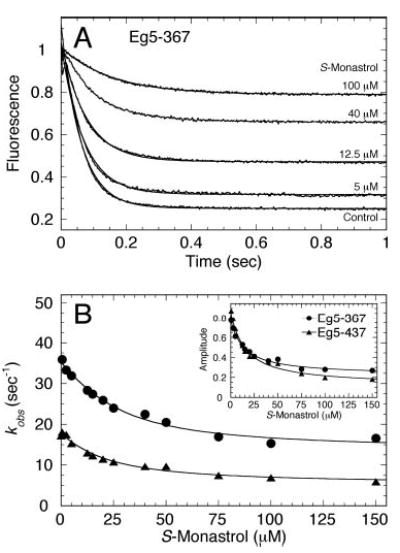
A preformed Eg5·mantADP complex was treated with increasing S-monastrol concentrations, then the Eg5S·mantADP complex was rapidly mixed in the stopped-flow instrument with microtubules and MgATP. Final concentrations: 2 μm Eg5, 4 μm mantADP, 25 μm tubulin, 20 μm Taxol, 0–150 μm S-monastrol, and 1 mm MgATP. A, representative transients are shown for different S-monastrol concentrations (as indicated). B, the rate obtained from the exponential decrease in fluorescence of each transient was plotted as a function of S-monastrol concentration, and the data were fit to Equation 10. For Eg5–367 (•), Kd,S = 14.4 ± 3.4 μm. For Eg5–437 (▴), Kd,S = 15.2 ± 3.2 μm. Insets, the amplitude of the exponential decrease in fluorescence was plotted as a function of S-monastrol concentration. For Eg5–367 (•), Kd,S = 13.5 ± 2.0 μm. For Eg5–437 (▴), Kd,S = 15.2 ± 2.7 μm.
Phosphocreatine Kinase-coupled Assays
The experiments presented in Fig. 8 were performed (as described before (34, 35)) to determine the rate of ADP release from the Eg5S·ADP complex and to characterize the equilibrium state of the Mt·Eg5S·ADP complex. Briefly, Eg5·ADP was incubated with trace amounts of [α-32]ATP for 90 min to convert all radiolabeled ATP to ADP (data not shown). The Eg5· [α-32]ADP complex was treated with S-monastrol for 30 min, followed by mixing with 2.5 mm unlabeled MgATP plus a creatine kinase/phosphocreatine ATP regeneration system (with or without Mts) to transfer Pi to the [α-32]ADP free in solution. The experimental design assumes that ADP at the Eg5 active site is inaccessible to the creatine kinase and therefore is protected from enzymatic conversion to ATP. The tightly bound [α-32]ADP concentration was quantified as a function of time, and each data set was fit to the following exponential equation,
Fig 8. Equilibrium state of Eg5S complexes.
Eg5·[α-32P]ADP was incubated in the presence (▴ and ♦) or absence (•) of S-monastrol. The complexes were reacted with a creatine kinase/phosphocreatine ATP regeneration system plus MgATP in the presence (♦) or absence (• and ▴) of Mts. Final concentrations: 5 μm Eg5, 10 μm tubulin, 20 μm Taxol, 100 μm S-monastrol, 0.3 mg/ml creatine kinase, 4 mm phosphocreatine, and 2.5 mm MgATP. The concentration of tightly bound [α-32P]ADP was plotted versus time, and each data set was fit to Equation 11. A, for Eg5–367, in the absence of S-monastrol (no Mts), koff,ADP = 0.05 ± 0.001 s−1 (•). In the presence of S-monastrol (no Mts), koff,ADP = 0.007 ± 0.0002 s−1 (▴). B, for Eg5–437, in the absence of S-monastrol (no Mts), koff,ADP = 0.004 ± 0.0001 s−1 (•). In the presence of 100 μm S-monastrol (no Mts), koff,ADP = 0.001 ± 0.0001 s−1 (▴). For both Eg5 motors, in the presence of S-monastrol and microtubules, a stable Mt·Eg5S·ADP intermediate was not trapped (♦); ADP was rapidly released, but the koff,ADP could not be accurately measured by this coupled assay.
| (Eq. 11) |
where the total Eg5 sites with ADP tightly bound [Eg5·ADP] is the sum of the amplitude (A) and the constant term (C) to extrapolate to zero time (t). The term koff is the first-order rate constant for ADP release.
RESULTS
Monastrol Inhibits Steady-state ATPase with or without Microtubules
We began our mechanistic study of S-monastrol inhibition of two monomeric Eg5 motors (Eg5–367 and Eg5–437) by characterizing the ATPase activity of Eg5S in the presence and absence of microtubules. In the absence of microtubules, the rate of ATP turnover decreased as a function of S-monastrol concentration (Eg5–367: 0.02 s−1 to 0.001 s−1; Eg5–437: 0.001 s−1 to 0.0005 s−1), and the apparent Kd,S was ~2 μm for each motor (Fig. 1A and Table I). These results confirm that monastrol inhibits the basal ATPase activity of Eg5–367 and Eg5–437 as reported previously (21–23).
Table I .
Monastrol inhibition of Eg5 ATPase mechanism
| Eg5–367
|
Eg5–437
|
||||
|---|---|---|---|---|---|
| Constants | Control | S-Monastrol | Control | S-Monastrol | |
| mantATP binding | k+1 | 2.2 ± 0.3 μm−1s−1 | 2.1 ± 0.3 μm−1s−1 | ||
| koff | 18.0 ± 0.7 s−1 | 19.1 ± 0.7 s−1 | NDa | ND | |
| k+1′ | 47.0 ± 2.3 s−1 | 47.8 ± 1.9 s−1 | |||
| K½,mATP | 7.9 ± 1.6 μm | 9.4 ± 1.9 μm | |||
| ATP hydrolysis by acid-quench | kburst | 13.3 ± 1.5 s−1b | 53.4 ± 16.0 s−1b | 14.9 ± 1.2 s−1 | 36.3 ± 3.2 s−1 |
| Ao | 0.8 ± 0.04/site | 0.26 ± 0.02/site | 0.78 ± 0.02/site | 0.26 ± 0.02/site | |
| Kd,ATP | 46 ± 6 μm | 154 ± 28 μm | |||
| ATP hydrolysis by modeling | k+2 | 12.7 s−1 | 12.7 s−1 | 12.1 s−1 | 12.2 s−1 |
| k−2 | 0.001 s−1 | 32.2 s−1 | 0.001 s−1 | 13.3 s−1 | |
| kslow | 3.0 s−1 | 1.3 s−1 | 3.4 s−1 | 1.7 s−1 | |
| Microtubule associationc | kobs | 57.4 s−1 | 4.4 s−1 | 5.7 s−1 | 1.2 s−1 |
| Kd,s | 5.1 ± 0.4 μm | 6.2 ± 0.7 μm | |||
| mantADP released | kobs | 35.9 s−1 | 16.6 s−1 | 17.8 s−1 | 5.9 s−1 |
| Kd,s | 14.4 ± 3.4 μm | 15.2 ± 3.2 μm | |||
| Steady-state ATPase | kcat | 5.5 ± 0.3 s−1e | 1.2 ± 0.03 s−1 | 2.9 ± 0.1 s−1e | 0.6 ± 0.03 s−1 |
| Kd,S | 13.8 ± 1.0 μm | 4.0 ± 0.4 μm | |||
| Km,ATP | 9.5 ± 0.4 μm | 3.6 ± 0.3 μm | 20.7 ± 3.2 μm | 4.1 ± 0.7 μm | |
| K½,Mt | 0.71 ± 0.15 μme | 6.7 ± 0.4 μm | 4.5 ± 0.6 μme | 33.3 ± 3.3 μm | |
| Mt equilibrium binding | Kd,Mt | ND | ND | 0.07 ± 0.03 | 2.3 ± 0.2 μm |
| ADP release (no Mts) | koff,ADP | 0.05 ± 0.001 s−1 | 0.007 ± 0.0002 s−1 | 0.004 ± 0.0001 s−1 | 0.001 ± 0.0001 s−1 |
Microtubules stimulate the steady-state kcat for both Eg5 monomers (34). However, S-monastrol treatment results in a concentration-dependent decrease in the ATPase activity (Eg5–367: 5.3 s−1 to 1.0 s−1; Eg5–437: 3.7 s−1 to 0.3 s−1) (Fig. 1B). The Eg5 motors also showed differences in the apparent Kd,S in these experiments: Eg5–367 = 14 μm versus Eg5–437 = 4 μm. These steady-state kinetics are comparable to those reported from previous studies (21–23, 27) and may suggest that microtubule binding weakens the affinity of Eg5 for monastrol. Fig. 1 (C and D) shows steady-state kinetics as a function of microtubule concentration at saturating MgATP and S-monastrol for Eg5–367 and Eg5–437, respectively. Note that the K½,Mt was considerably increased (Eg5–367: control = 0.7 μm, S-monastrol = 6.7 μm; Eg5–437: control = 4.5 μm, S-monastrol = 33.3 μm) indicating that monastrol causes Eg5 to bind Mts more weakly during steady-state ATP turnover. Previous investigations reported that monastrol was not competitive with microtubules (21, 22). Our data demonstrate a monastrol-dependent interference with Mt·Eg5 interaction based on the increased steady-state K½,Mt for both Eg5 monomers. Fig. 1 (E and F) shows steady-state kinetics as a function of MgATP concentration at saturating microtubules and S-monastrol for Eg5–367 and Eg5–437, respectively. We observe similar Km,ATP values between control and S-monastrol experiments indicating that monastrol does not disrupt nucleotide binding during steady-state ATP turnover (Table I).
Monastrol Weakens Eg5 Affinity for Microtubules at Equilibrium Conditions
Microtubule equilibrium binding assays were performed to determine the relative affinity of Eg5S for microtubules in the absence of additional nucleotide or in the presence of different nucleotide/analog conditions. In Fig. 2A, Eg5 was treated with or without S-monastrol and then incubated with increasing microtubule concentrations. Each Eg5 motor was found to partition with the microtubule pellet as a function of microtubule concentration, yet the Kd,Mt was significantly different in the presence of S-monastrol (control: Kd,Mt = 0.07 μm; S-monastrol: Kd,Mt = 2.3 μm). These data reveal that under equilibrium conditions, the affinity of Eg5 for Mts was weakened in the presence of S-monastrol. This effect was monastrol concentration-dependent as shown in Fig. 2B. Together, the increased steady-state K½,Mt and the increased Kd,Mt provide evidence for an altered microtubule-binding ability of Eg5 by monastrol.
We also sought to investigate the microtubule-binding behavior of the Eg5S complex under different nucleotide conditions (Fig. 2C). In the absence of S-monastrol, Eg5 partitions with the microtubules at each nucleotide condition as expected for a monomeric kinesin. However, with the addition of S-monastrol, some Eg5S appears to partition with the supernatant in the absence of additional nucleotide, consistent with the data presented in Fig. 2 (A and B). Interestingly, with 2 mm MgATP or MgADP, the Eg5S motor exhibits enhanced partitioning with the supernatant, suggesting a weak binding state for Eg5S with MgADP at the active site in the presence of S-monastrol. On the other hand, with excess MgAMPPNP (a nonhydrolyzable ATP analog), all Eg5S partitions with the microtubule pellet, indicating a strong binding state regardless of S-monastrol treatment.
Monastrol Does Not Alter the Kinetics of mantATP Binding to Mt·Eg5 Complex
The model of the Eg5S·ADP crystal structure indicates that monastrol binds ~12 Å from the active site (23). Previous studies using steady-state kinetics (21, 22) and data from Fig. 1 (E and F) suggest that monastrol binding is not competitive with respect to MgATP. To determine whether the presteady-state step of nucleotide binding to the Mt·Eg5S complex was altered, we performed mantATP binding experiments. Using a stopped-flow instrument, we were able to rapidly mix a preformed Mt·Eg5S complex with mantATP, and monitor the exponential increase in fluorescence that corresponds to mant-ATP binding to the hydrophobic Eg5 active site (Fig. 3A). In one experiment, we held the mantATP concentration at 10 μm and varied S-monastrol concentration (Fig. 3A, insets). For both Eg5–367 and Eg5–437, the observed rate of mantATP binding remained constant as a function of S-monastrol concentration. The amplitude of the exponential phase at each S-monastrol concentration was slightly decreased, which can be interpreted as a decrease in the population of Eg5S bound to microtubules at increasing S-monastrol concentrations (see Fig. 2). In another experiment, we held the S-monastrol concentration constant and varied mantATP concentration (Fig. 3B). The data were superimposable, which indicates that the second-order rate constant for mantATP binding (k+1), the off-rate for mantATP dissociation from the collision complex (k−1), and the rate constant for the ATP-dependent isomerization step before ATP hydrolysis (k+1′) were unaffected by monastrol treatment (Scheme 1 and Table I). Binding of monastrol to the Mt·Eg5 complex was confirmed by our acid-quench experiments presented next.
Monastrol Promotes Reversals at the ATP Hydrolysis Step
We measured the kinetics of ATP hydrolysis in the presence of S-monastrol by performing a series of acid-quench experiments (Figs. 4 and 5). Cochran et al. (34) demonstrated that ATP binding is at least a two-step process for Eg5–367 and Eg5–437, with an isomerization event yielding a short-lived Mt·Eg5*·ATP intermediate that proceeds directly to ATP hydrolysis (Scheme 1). Again, the mantATP binding kinetics presented in Fig. 3B showed that monastrol does not affect the two ATP binding steps that occur prior to ATP hydrolysis. To determine if S-monastrol affects the ATP hydrolysis step, we used a chemical quench-flow instrument to rapidly mix a preformed Mt·Eg5S complex with MgATP, and radiolabeled product formation was quantified as a function of time. In Fig. 4 (A and B), we held the Mt·Eg5 complex and MgATP concentration constant and varied S-monastrol concentration. The exponential burst rate increased as a function of S-monastrol concentration (10 s−1 to 50 s−1); however the burst amplitude decreased (4.0 μm to 1.3 μm ADP·Pi). In Fig. 4 (C and D), we held the Mt·Eg5 complex and S-monastrol concentration constant and varied MgATP concentration. This experiment was designed to yield the maximum burst rate of ATP hydrolysis in the presence of saturating S-monastrol (kb,max = 36.3 s−1). Again, we observed a decreased maximum burst amplitude (1.3 μm ADP·Pi). Several hypotheses could explain the decrease in burst amplitude: 1) inactive Eg5 enzyme (disfavored due to full burst amplitude for control experiments), 2) weakened ATP binding (disfavored based on steady-state Km,ATP and the mantATP binding kinetics), 3) partitioning of Eg5 off the microtubule, and/or 4) reversals at the ATP hydrolysis step.
At the same Mt·Eg5S conditions used in the acid-quench experiments presented in Fig. 4 (A–D), our cosedimentation data from Fig. 2 indicate that 66% of the motor population remains tightly bound to the microtubule. Assuming the lower burst amplitude corresponds to a decreased population of Eg5S motors bound to the Mts, we hypothesized that increasing the microtubule concentration would rescue the burst amplitude to near full amplitude (~4 μm ADP·Pi). We performed acid-quench experiments as a function of microtubule concentration at constant MgATP and S-monastrol concentrations. Fig. 4E shows the ATP hydrolysis kinetics at increasing microtubule concentrations for Eg5–437. Even though these data show a modest increase in burst amplitude (from 1.3 μm to 2.0 μm ADP·Pi), the amplitude does not reach 4 μm ADP·Pi as seen in the absence of S-monastrol. In addition, the experiment in Fig. 4F provides evidence that the additional salt in the ATP syringe used to lower the steady-state phase does not affect the first ATP turnover. Therefore, the lower burst amplitude cannot be totally explained by Eg5S partitioning off the microtubule. Alternatively, the results obtained from our acid-quench experiments are consistent with reversals in the chemical reaction, whereby the Mt·Eg5S·ADP·Pi intermediate reforms ATP at the active site at a rate defined by k−2. Experiments to directly test this hypothesis (intermediate O18 exchange) have not yet been performed.
To determine whether the sequential order of monastrol addition affected the outcome of the experimental results, we designed three independent acid-quench experiments. In Experiment 1, S-monastrol was omitted; in Experiment 2, S-monastrol was included with the MgATP syringe, and in Experiment 3, S-monastrol was included with the Mt·Eg5 syringe (Fig. 5). The experimental data presented in Fig. 5 (A and B) were modeled to Equations 4–7 to estimate the rate constants for ATP hydrolysis (k+2), ATP re-synthesis (k−2), and product release (kslow) (Fig. 5C andScheme 1). Modeling of these data revealed that k+2 remained similar in each experiment. For Experiment 3, the value for k−2 was dramatically higher (13.3 s−1), which explains the increased burst rate and decreased burst amplitude observed in Fig. 4. Finally, the slow rate that is defined by the linear phase of each curve was reduced to the same level regardless of the sequential order of S-monastrol addition (Experiment 2 versus Experiment 3). The results from Experiment 2 and Experiment 3 suggest that ATP binding and ATP hydrolysis can occur faster than S-monastrol can bind and induce the structural transitions required to stabilize the ATP hydrolysis conformation (Species 3, see Fig. 9) such that reversals at this step occur.
Fig 9. Model for monastrol inhibition of the Mt·Eg5 ATPase.
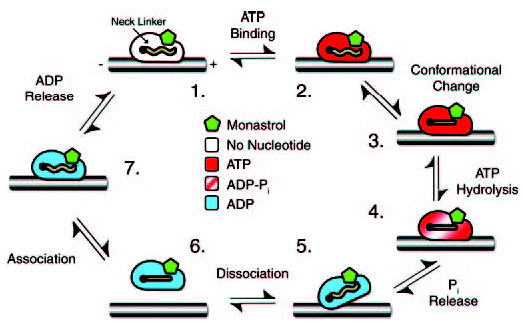
Monastrol appears to stabilize the conformation of the Eg5 motor domain at Species 3, such that ATP hydrolysis in the forward direction and ATP re-synthesis in the reverse direction are both favored. Species 3, 4, and 6 show the neck linker docked onto the motor domain based on the monastrol Eg5 crystal structure that assumes the locked “ATP-like” conformation of the motor domain (23). We have no evidence for the neck linker configuration for the other species; therefore, the neck linker is indicated as a wavy line.
Monastrol Dramatically Slows Eg5S Association with Mts
To determine the effectiveness of Mt·Eg5S complex formation, we used the stopped-flow instrument to monitor changes in solution turbidity as the motor associates with the microtubule (Fig. 6). For Eg5–367 and Eg5–437, the observed rate of Eg5 association decreased as a function of S-monastrol concentration (Eg5–367: 57 s−1 to 4 s−1; Eg5–437: 5.7 s−1 to 1.2 s−1). From the fit of each data set, the apparent Kd,S was 5–6 μm, consistent with the Kd,S determined from the microtubule-activated steady-state experiments for Eg5–437 (Fig. 1B and Table I). Also, the amplitude of the rapid exponential phase decreased as a function of S-monastrol concentration, suggesting that a proportion of Eg5S motors did not bind the microtubule lattice stably enough to elicit a turbidity change. These data confirm the results from our steady-state experiments and cosedimentation assays, which show that monastrol affects the interaction of Eg5 with the microtubule lattice.
Monastrol Slows MantADP Release from the Mt·Eg5S·mantADP Complex
Eg5 was incubated with mantADP to exchange ADP at the active site with mantADP, and the Eg5·mantADP complex was treated with increasing concentrations of S-monastrol. This complex was then reacted in the stopped-flow instrument with microtubules plus MgATP to prevent the mantADP from rebinding the Mt·Eg5S complex. Fig. 7 shows the exponential rate of mantADP release as a function of S-monastrol concentration. For each Eg5 motor, mantADP release was slowed as S-monastrol concentration increased. For Eg5–367, S-monastrol inhibited mantADP release from 36 s−1 to 17 s−1 with the apparent Kd,S at 14 μm. For Eg5–437, S-monastrol decreased mantADP release from 18 s−1 to 6 s−1 with the apparent Kd,S at 15 μm. To measure microtubule-activated mantADP release from the Eg5 motor domain, the Eg5S·mantADP complex must first associate with the microtubule, which has been shown to be dramatically affected by monastrol binding (Fig. 6). The slowed rate of mantADP release in the presence of S-monastrol could be interpreted as either a strict effect on product release and/or a result of aberrant microtubule-motor complex formation.
The amplitude of the rapid exponential phase corresponding to mantADP release decreased as a function of S-monastrol as well, which could be interpreted as a stabilization of the Mt·Eg5S·mantADP intermediate. Alternatively, we could interpret this decrease in amplitude as a secondary effect of poor microtubule association. To test if S-monastrol traps the Mt·Eg5S·ADP intermediate, we designed a phosphocreatine kinase-coupled assay to monitor tightly bound [α-32P]ADP under these conditions (see below).
Monastrol Slows ADP Release from Eg5 Motor Domain, Yet Does Not Trap the Mt·Eg5s·ADP Complex
We wanted to answer two questions by performing the phosphocreatine kinase-coupled assays as follows. First, does S-monastrol slow ADP release in the absence of Mts? Second, does S-monastrol trap the Mt·Eg5S·ADP intermediate? In this experiment, the Eg5 motors were incubated with [α-32P]ATP to exchange the ADP at the active site with [α-32P]ADP. The motors (Eg5·[α-32P]ADP, Eg5S·[α-32P]ADP, or Mt·Eg5S·[α-32P]ADP) were mixed with a creatine kinase/phosphocreatine ATP regeneration system plus 2.5 mm unlabeled MgATP. The motor domain releases [α-32P]ADP from the active site, and the coupled assay converts the [α-32P]ADP to [α-32P]ATP. Because the unlabeled MgATP was in excess, the active site of Eg5 was more likely to bind unlabeled MgATP than [α-32P]ATP; therefore, the data show a decrease in [α-32P]ADP as a function of time. Only [α-32P]ADP at the active site was protected from the enzymatic conversion to [α-32P]ATP by creatine kinase. Fig. 8 shows that the concentration of tightly bound [α-32P]ADP decreased as a function of time. For both Eg5 motors, S-monastrol treatment promotes slowed ADP release in the absence of Mts (Eg5–367: 0.05 s−1 to 0.007 s−1; Eg5–437: 0.004 s−1 to 0.001 s−1). In the presence of 100 μm S-monastrol and 3 μm Mts, no tightly bound [α-32P]ADP was detected for Eg5-367 by 5 s and for Eg5–437 by 30 s, which shows that monastrol does not trap a stable Mt·Eg5S·ADP intermediate. The microtubule-activated rate of [α-32P]ADP release was too fast to measure by this coupled assay, although the data clearly show release of [α-32P]ADP from all Eg5 sites.
DISCUSSION
In this study, we sought to determine the molecular basis for monastrol inhibition of the Eg5 ATPase cycle (Scheme 1). The results presented here reveal an altered ATPase mechanism in which reversals occurred at the ATP hydrolysis step, the affinity of the Mt·Eg5S complex was compromised, and ADP release was slowed.
We propose that the Eg5 ATP hydrolysis conformation is stabilized by monastrol (Species 3, Fig. 9) such that reversals at this step become energetically favorable. The evidence to support this hypothesis is based on the ATP hydrolysis kinetics in which we observed an increase in the presteady-state burst rate with a concomitant decrease in the burst amplitude (Fig. 4). Because the observed exponential burst rate represents the sum of k+2, k−2, and the slowest step after ATP hydrolysis (kslow), an increase in the burst rate indicates that the magnitude of at least one of these constants also increased. The concomitant decrease in the burst amplitude with an increase in the burst rate is consistent with the interpretation of reversals at ATP hydrolysis, because re-synthesized [α-32P]ATP on the active site cannot be distinguished from the [α-32P]ATP substrate. The burst amplitude represents the concentration of ADP·Pi formed on the active site during the exponential burst phase. If ATP were re-synthesized, the observed burst amplitude must decrease.
Further support of the hypothesis that monastrol stabilizes the ATP hydrolysis conformation comes from the modeling of the ATP hydrolysis data to define k+2, k−2, and kslow (Fig. 5C). Note that the modeled fits of the data predict an increase in k−2 (the rate constant for ATP re-synthesis) from 0.001 s−1 to 13 s−1 with monastrol treatment, yet the intrinsic rate constant for ATP hydrolysis (k+2) remains relatively unchanged at 12 s−1. The slow step after ATP hydrolysis, kslow, decreased with monastrol treatment based on this analysis.
We propose that ATP re-synthesis occurs as the microtubule-bound intermediate (Species 4, Fig. 9) rather than ATP hydrolysis resulting in motor detachment followed by ATP re-synthesis. Motor detachment from the microtubule would be expected to result in a significant conformational change; therefore, ATP re-synthesis would be energetically less favorable and not likely to occur. Furthermore, the rate constants of ATP hydrolysis (k+2) and kslow would be expected to decrease dramatically if cycles of ATP re-synthesis followed by ATP hydrolysis were to occur with the motor domain detached from the microtubule. The results presented in Figs. 4 and 5 do not support this type of model.
Reversal of the ATP hydrolysis step is the classic interpretation when one observes an increase in the burst rate and a concomitant decrease in burst amplitude. This interpretation can be made in these experiments, because we are directly monitoring product formation on the millisecond time scale. However, the mechanistic and structural cause of the reversals remains speculative. Two hypotheses can adequately explain the reversal phenomenon. First, if monastrol were to inhibit Pi release from the Eg5 motor domain after ATP hydrolysis, the reactants would remain present in the active site in presumably the proper orientation where the reverse chemistry is favored. Second, Pi may be released, but rapidly rebinds the active site to allow for the reversals. Both hypotheses require that the configuration of the active site contacts with nucleotide be unchanged to be energetically favorable for ATP re-synthesis.
In addition to the aberrant ATP hydrolysis kinetics, S-monastrol also alters the microtubule-binding ability of the motor (Table I). The weakened affinity was detected in the steady-state kinetics (Fig. 1), the microtubule equilibrium binding studies (Fig. 2), and the presteady-state kinetics of microtubule association (Fig. 6). Although the rate of ADP release was also slowed by monastrol treatment (Figs. 7 and 8), there was no evidence to support a model in which monastrol stabilizes the Mt·Eg5S·ADP intermediate and traps ADP at the active site (Species 5, Fig. 9). In fact, the results presented in Fig. 8 show that ADP was released from the active site of Eg5S. The data do support a model of monastrol inhibition whereby the ADP release rate from the Mt·Eg5S·ADP intermediate is slowed (Species 7, Fig. 9). The apparent Kd,S obtained from the microtubule association kinetics at 5–6 μm is more similar to the apparent Kd,S observed during steady-state ATP turnover (Table I). In contrast, the Kd,S obtained from the mantADP release kinetics is significantly higher at 15 μm, suggesting that the slowed release of ADP is a secondary effect with aberrant microtubule binding as a significant step affected by monastrol treatment.
The crystal structure of the Eg5S·ADP intermediate shows that monastrol binding induces conformational changes in the switch II cluster (L11-α4-L12-α5-L13), where the neck-linker docks onto switch II similar to the ATP-like conformation of the KIF1A·AMPPCP complex (23, 38). Our mantATP binding experiments for the Mt·Eg5S complex (Fig. 3) indicate that ATP binding and the ATP-dependent isomerization were not affected by monastrol, although the ATP hydrolysis kinetics were clearly altered as discussed above. We also observed aberrant microtubule interactions, which is also consistent with the structural studies in which monastrol binding altered the arrangement of the switch II and neck linker regions (23, 38), both of which were implicated in microtubule binding during ATP turnover.
This study provides a kinetic and thermodynamic characterization of the allosteric inhibition of Eg5 by monastrol. Our results clearly show monastrol-induced effects on the ATPase cycle, and we propose that the structural transitions that result can no longer produce and sustain the force required to establish and to maintain the bipolar spindle for chromosome segregation.
Acknowledgments
We thank Dr. Timothy J. Mitchison (Harvard Medical School) for generously providing the Eg5 clones prior to publication and his enthusiasm for this study and Merck Research Laboratories (West Point, PA) for the generous gift of S-monastrol and scientific discussions. Lisa Sproul and Troy Krzysiak also provided thoughtful insight during the preparation of the manuscript.
Footnotes
This work was supported by Grant GM54141 from NIGMS, National Institutes of Health (NIH), and through Career Development Award K02-AR47841 from NIAMS, NIH, Department of Health and Human Services (to S. P. G.).
The abbreviations used are: Eg5S, S-monastrol-treated Eg5; Eg5–367, human Eg5 motor containing N-terminal 367 residues followed by a C-terminal His6 tag; Eg5–437, human Eg5 motor containing N-terminal 437 residues followed by a C-terminal His6 tag; Mt, microtubule; AMP-PNP, adenosine 5′-(β,γ-imino)triphosphate; AMPPCP, adenosine 5′-(β,γ-methylene)triphosphate; mant, 2′-(3′)-O-(N-methylanthraniloyl).
References
- 1.Inoue S. J Struct Biol. 1997;118:87–93. doi: 10.1006/jsbi.1996.3839. [DOI] [PubMed] [Google Scholar]
- 2.Compton DA. Annu Rev Biochem. 2000;69:95–114. doi: 10.1146/annurev.biochem.69.1.95. [DOI] [PubMed] [Google Scholar]
- 3.Mitchison TJ, Salmon ED. Nat Cell Biol. 2001;3:E17–E21. doi: 10.1038/35050656. [DOI] [PubMed] [Google Scholar]
- 4.Wittmann T, Hyman A, Desai A. Nat Cell Biol. 2001;3:E28–E34. doi: 10.1038/35050669. [DOI] [PubMed] [Google Scholar]
- 5.Karsenti E, Vernos I. Science. 2001;294:543–547. doi: 10.1126/science.1063488. [DOI] [PubMed] [Google Scholar]
- 6.Scholey JM, Brust-Mascher I, Mogilner A. Nature. 2003;422:746–752. doi: 10.1038/nature01599. [DOI] [PubMed] [Google Scholar]
- 7.Nedelec F, Surrey T, Karsenti E. Curr Opin Cell Biol. 2003;15:118–124. doi: 10.1016/s0955-0674(02)00014-5. [DOI] [PubMed] [Google Scholar]
- 8.Gaglio T, Saredi A, Bingham JB, Hasbani MJ, Gill SR, Schroer TA, Compton DA. J Cell Biol. 1996;135:399–414. doi: 10.1083/jcb.135.2.399. [DOI] [PMC free article] [PubMed] [Google Scholar]
- 9.Saunders W, Lengyel V, Hoyt MA. Mol Biol Cell. 1997;8:1025–1033. doi: 10.1091/mbc.8.6.1025. [DOI] [PMC free article] [PubMed] [Google Scholar]
- 10.Sharp DJ, Yu KR, Sisson JC, Sullivan W, Scholey JM. Nat Cell Biol. 1999;1:51–54. doi: 10.1038/9025. [DOI] [PubMed] [Google Scholar]
- 11.Mountain V, Simerly C, Howard L, Ando A, Schatten G, Compton DA. J Cell Biol. 1999;147:351–366. doi: 10.1083/jcb.147.2.351. [DOI] [PMC free article] [PubMed] [Google Scholar]
- 12.Cytrynbaum EN, Scholey JM, Mogilner A. Biophys J. 2003;84:757–769. doi: 10.1016/S0006-3495(03)74895-4. [DOI] [PMC free article] [PubMed] [Google Scholar]
- 13.Goshima G, Vale RD. J Cell Biol. 2003;162:1003–1016. doi: 10.1083/jcb.200303022. [DOI] [PMC free article] [PubMed] [Google Scholar]
- 14.Chakravarty A, Howard L, Compton DA. Mol Biol Cell. 2004;15:2116–2132. doi: 10.1091/mbc.E03-08-0579. [DOI] [PMC free article] [PubMed] [Google Scholar]
- 15.Kwon M, Scholey JM. Trends Cell Biol. 2004;14:194–205. doi: 10.1016/j.tcb.2004.03.003. [DOI] [PubMed] [Google Scholar]
- 16.Sharp DJ, Rogers GC, Scholey JM. Nature. 2000;407:41–47. doi: 10.1038/35024000. [DOI] [PubMed] [Google Scholar]
- 17.Peterson JR, Mitchison TJ. Chem Biol. 2002;9:1275–1285. doi: 10.1016/s1074-5521(02)00284-3. [DOI] [PubMed] [Google Scholar]
- 18.Miyamoto DT, Perlman ZE, Mitchison TJ, Shirasu-Hiza M. Prog Cell Cycle Res. 2003;5:349–360. [PubMed] [Google Scholar]
- 19.Mayer TU, Kapoor TM, Haggarty SJ, King RW, Schreiber SL, Mitchison TJ. Science. 1999;286:971–974. doi: 10.1126/science.286.5441.971. [DOI] [PubMed] [Google Scholar]
- 20.Kapoor TM, Mayer TU, Coughlin ML, Mitchison TJ. J Cell Biol. 2000;150:975–988. doi: 10.1083/jcb.150.5.975. [DOI] [PMC free article] [PubMed] [Google Scholar]
- 21.Maliga Z, Kapoor TM, Mitchison TJ. Chem Biol. 2002;9:989–996. doi: 10.1016/s1074-5521(02)00212-0. [DOI] [PubMed] [Google Scholar]
- 22.DeBonis S, Simorre JP, Crevel I, Lebeau L, Skoufias DA, Blangy A, Ebel C, Gans P, Cross R, Hackney DD, Wade RH, Kozielski F. Biochemistry. 2003;42:338–349. doi: 10.1021/bi026716j. [DOI] [PubMed] [Google Scholar]
- 23.Yan Y, Sardana V, Xu B, Homnick C, Halczenko W, Buser CA, Schaber M, Hartman GD, Huber HE, Kuo LC. J Mol Biol. 2004;335:547–554. doi: 10.1016/j.jmb.2003.10.074. [DOI] [PubMed] [Google Scholar]
- 24.Sawin KE, LeGuellec K, Philippe M, Mitchison TJ. Nature. 1992;359:540–543. doi: 10.1038/359540a0. [DOI] [PubMed] [Google Scholar]
- 25.Blangy A, Lane HA, d‘Herin P, Harper M, Kress M, Nigg EA. Cell. 1995;83:1159–1169. doi: 10.1016/0092-8674(95)90142-6. [DOI] [PubMed] [Google Scholar]
- 26.Sawin KE, Mitchison TJ. Proc Natl Acad Sci U S A. 1995;92:4289–4293. doi: 10.1073/pnas.92.10.4289. [DOI] [PMC free article] [PubMed] [Google Scholar]
- 27.Funk CJ, Davis AS, Hopkins JA, Middleton KM. Anal Biochem. 2004;329:68–76. doi: 10.1016/j.ab.2004.02.032. [DOI] [PubMed] [Google Scholar]
- 28.Mailhes JB, Mastromatteo C, Fuseler JW. Mutat Res. 2004;559:153–167. doi: 10.1016/j.mrgentox.2004.01.001. [DOI] [PubMed] [Google Scholar]
- 29.Finer, J. T., Bergnes, G., Fend, B., Smith, W. W., and Chabala, J. C. (April 8, 2003) in WIPO Vol. A1, U. S. Patent 6,545,004
- 30.Sakowicz R, Finer JT, Beraud C, Crompton A, Lewis E, Fritsch A, Lee Y, Mak J, Moody R, Turincio R, Chabala JC, Gonzales P, Roth S, Weitman S, Wood KW. Cancer Res. 2004;64:3276–3280. doi: 10.1158/0008-5472.can-03-3839. [DOI] [PubMed] [Google Scholar]
- 31.Brier S, Lemaire D, Debonis S, Forest E, Kozielski F. Biochemistry. 2004;43:13072–13082. doi: 10.1021/bi049264e. [DOI] [PubMed] [Google Scholar]
- 32.Turner J, Anderson R, Guo J, Beraud C, Fletterick R, Sakowicz R. J Biol Chem. 2001;276:25496–25502. doi: 10.1074/jbc.M100395200. [DOI] [PubMed] [Google Scholar]
- 33.Crevel IM, Alonso MC, Cross RA. Curr Biol. 2004;14:R411–R412. doi: 10.1016/j.cub.2004.05.030. [DOI] [PubMed] [Google Scholar]
- 34.Cochran JC, Sontag CA, Maliga Z, Kapoor TM, Correia JJ, Gilbert SP. J Biol Chem. 2004;279:38861–38870. doi: 10.1074/jbc.M404203200. [DOI] [PMC free article] [PubMed] [Google Scholar]
- 35.Gilbert SP, Mackey AT. Methods. 2000;22:337–354. doi: 10.1006/meth.2000.1086. [DOI] [PubMed] [Google Scholar]
- 36.Foster KA, Correia JJ, Gilbert SP. J Biol Chem. 1998;273:35307–35318. doi: 10.1074/jbc.273.52.35307. [DOI] [PubMed] [Google Scholar]
- 37.Johnson, K. A. (1992) in The Enzymes20, pp. 1–61
- 38.Kikkawa M, Sablin EP, Okada Y, Yajima H, Fletterick RJ, Hirokawa N. Nature. 2001;411:439–445. doi: 10.1038/35078000. [DOI] [PubMed] [Google Scholar]
- 39.Gilbert SP, Webb MR, Brune M, Johnson KA. Nature. 1995;373:671–676. doi: 10.1038/373671a0. [DOI] [PMC free article] [PubMed] [Google Scholar]
- 40.Moyer ML, Gilbert SP, Johnson KA. Biochemistry. 1998;37:800–813. doi: 10.1021/bi9711184. [DOI] [PubMed] [Google Scholar]