

Abstract
The regional distribution of skeletal muscle blood flow was measured during postischemic reactive hyperemia using Gd-DTPA contrast-enhanced (CE) MRI. The release of an occlusive thigh cuff was used to deliver a step-input of contrast concentration that was coincident with the onset of reactive hyperemia. A first-order tracer kinetic equation was used to estimate the unidirectional influx constant, Ki (ml/100 g/min), and the distribution volume of Gd-DTPA in the tissue, ve, from T1-weighted images acquired with saturation recovery (SR) steady-state free precession (SSFP) and spoiled gradient-echo (SPGR) protocols. The capillary permeability surface (PS) area increased significantly during reactive hyperemia, which facilitated rapid extraction of Gd-DTPA during the first pass. Regional muscle group studies from 11 normal volunteers yielded blood flow (Ki) values of 108.3 ± 34.1 ml/100 g/min in the gastrocnemius, 184.3 ± 41.3 ml/100 g/min in the soleus, and 122.4 ± 34.4 ml/100 g/min in the tibialis anterior. The distribution volumes (ve) in the corresponding muscle groups were respectively 8.3% ± 2.1%, 9.3% ± 1.9%, and 7.9% ± 1.8% from the kinetic model, and 8.8% ± 2.4%, 9.1% ± 1.9%, and 7.2% ± 1.4% from tissue relaxometry studies. Bulk blood flow studies in the same volunteers using phase-contrast velocimetry (popliteal artery) yielded significantly lower flow values, but with a correlation coefficient R2 = 0.62 and P = 0.004.
Keywords: blood flow, peripheral artery disease, claudication, angiogenesis, MRI
Obstructive peripheral artery disease affects 15% of adults over the age of 55, more than one-third of whom are symptomatic. Typical manifestations are pain during walking and the risk of limb loss. Lower-extremity perfusion measures would be valuable for diagnosing peripheral artery disease and evaluating treatment by angioplasty, bypass surgery, or biological agents. The prevailing clinical standard for noninvasively estimating limb perfusion is the measurement of circumferential muscle swelling using venous occlusion strain-gauge plethysmography (1,2). Strain gauge studies provide only global limb as opposed to regional muscle flow information, are hampered by systematic underestimation of flow, and are sensitive to patient positioning and temperature (3). Scintigraphy and positron-emission tomography (PET) can be used to estimate skeletal muscle blood flow using inflow of tracers (4–6); however, they provide relatively low spatial resolution. Numerous MRI approaches can be used to non-invasively measure regional blood flow in skeletal muscle, including arterial spin labeling (ASL) (7–10), tissue relaxometry (7,8,11), and first-pass signal enhancement with paramagnetic tracers (12–14).
In this study we adapted first-pass contrast-enhanced (CE) perfusion methods, which are commonly used to measure myocardial blood flow, for the measurement of skeletal muscle blood flow. Estimation of flow with conventional bolus injection tracer methods requires deconvolution with a measured arterial input function (AIF), which complicates the experiment and introduces noise and systematic errors. New methods for contrast delivery are presented in this study that provide an ideal step-input of contrast concentration in order to eliminate the requirement for deconvolution with the input function. The advantages of the step-input function for use in MRI tissue perfusion experiments was previously noted (15). Because resting perfusion in skeletal muscle is relatively low, highly variable, and not indicative of pathology, the first-pass studies were designed for application during a period of increased blood flow during postischemic reactive hyperemia following an arterial occlusion. The first goal of this study was to validate a method for contrast agent delivery that provides an arterial step-input of contrast concentration that coincides with the onset of reactive hyperemia (6). This approach was designed both to allow flow measurements to be made during the period of peak hyperemic flow, and to eliminate the need for deconvolution of arterial and tissue time-intensity curves in order to estimate flow. The second goal of this study was to identify variations in blood flow between different muscle groups in the lower limb with the use of regional analyses. Peak hyperemic blood flow rates measured in calf muscle with the CE methods are compared with bulk flow rates measured in the popliteal arteries.
THEORY
Tracer Kinetics
Methods for the evaluation of tissue kinetic parameters and distribution volumes using CE-MRI typically rely on signal enhancement of T1-weighted images with the arrival of a T1-shortening tracer, most commonly gadopentate dimeglumine (Gd-DTPA). Because Gd-DTPA is extracted from the capillary plasma space to the interstitial space, the effective concentration of tracer in the tissue will be modulated by the blood flow, the tracer distribution volumes within the tissue, and the rate of extraction. A two-compartment kinetic model is commonly used to relate the plasma and tissue tracer concentrations, Cp and Ct, in terms of a transfer constant, Ktrans (min−1), and the interstitial fractional distribution volume of the Gd-DTPA, ve (16):
| [1] |
The transfer constant embodies both the blood flow to the tissue and the extraction of the Gd-DTPA to the interstitial space, which is commonly expressed altogether as Ktrans = EFρ (1 − Hct). F is the whole blood flow per unit mass of tissue (ml/100 g/min), E is the fractional extraction of the Gd-DTPA as it first passes through the tissue, ρ is the tissue density (g/ml), and Hct is the blood hematocrit (which was set to 0.45 for this study). The fractional extraction can be expressed in terms of the flow and the permeability surface (PS) area product across the capillary membrane (ml/100 g/min), as E = (1 − exp(− PS/F)). The EF product is commonly termed the unidirectional influx constant, Ki, so that Ktrans = Kiρ (1 − Hct). Ki is attractive as a surrogate for flow because it has the same units, ml/100 g/min, and is related directly to flow by the unitless extraction term, E (16). All tissue and kinetic parameters used in this study are consistent with those used in a recent publication that outlined standardized quantities and symbols for CE-MRI (17). The solution to Eq. [1] for first-pass conditions, Cp(0) = 0 and Ct(0) = 0, is
| [2] |
where ⊗ is the operation of convolution. Of particular interest in this study is the special case of a step-input of tracer concentration, Cp(0) = 0 and Cp(t > 0) = Cp 0, for which Eq. [2] is simplified to:
| [3] |
The step-input experiment has several advantages over conventional bolus methods for the purpose of estimating Ktrans and ve: 1) the simple input shape eliminates the need for deconvolution of tissue and arterial time-intensity curves; 2) the steady-state signal intensity is proportional to the distribution volume, ve; and 3) there are no bolus recirculation effects (second pass, third pass, etc.).
For the case of flow-limited extraction, which occurs for PS > F, the tissue tracer concentration can still be described by Eqs. [2] and [3], but with Ktrans = Fρ (1 − Hct) (17), or Ki = F. It is illustrative to note that for these conditions the tissue and plasma concentrations are described by the Kety-Schmidt equation, for which the interstitial and venous plasma tracer concentrations are assumed to be in equilibrium (Cp(venous) = Ci = Ct/ve). A direct comparison of venous and tissue time-intensity curves, which are provided in the Results section, thus provides insight into the degree of tracer extraction during the first pass. Ktrans (Ki) and ve can be estimated from Eq. [3] using the measured values of the tissue concentration of Gd-DTPA, Ct, and the arterial plasma concentration, Cp0. Note that the distribution volume, ve, can also be measured independently of Ktrans using the steady-state signal intensity, Ct = veCp 0 for t > ve/Ktrans, or using separate whole blood and tissue relaxometry experiments (18). The accuracy of either approach is limited by the precision of the measured plasma concentration of Gd-DTPA, Cp 0. Distribution volumes are estimated using both methods in this study.
MRI and Tracer Concentrations
Changes in the relative MR signal intensity for known changes in T1 and T2 can be calculated given the experimental pulse sequence parameters. Figure 1 displays a set of simulated calibration curves relating normalized signal intensity, ΔS = (S(ΔR1) − S(0))/S(0), for an SR experiment to changes in the relaxation rates, ΔR1 = 1/T1 − 1/T1 0 and ΔR2 = 1/T2 − 1/T2 0. All numerical simulations incorporate the Bloch equations. The MR signal is normalized to the baseline intensity prior to contrast delivery, S(0), for which the longitudinal and transverse relaxation time constants are given by T1 0 and T2 0. Curves are plotted for both an SR steady-state free-precession (SR-SSFP) experiment and an SR spoiled gradient-echo experiment (SR-SPGR). The pulse sequence parameters used for the SSFP and SPGR experiments in Fig. 1 are detailed in the Materials and Methods section. A second curve is calculated for each experiment to illustrate the effects of potential changes in T2 during reperfusion from physiologic sources, as opposed to the effects of the Gd-DTPA. Changes in skeletal muscle T2 from resting values of 30–35 ms during reactive hyperemia have been reported by several groups (7,19–21). To generate the curves in Fig. 1, the increases in T2 were assumed to parallel the arrival of oxygenated blood during reperfusion (11), and thus also the arrival of the contrast agent (ΔT2 ∞ ΔR1). The baseline tissue relaxation time constants for skeletal muscle used in this study were T1 0 = 1050 ms and T2 0 = 30 ms. While the SPGR method has the advantage of T2 insensitivity, studies with both SPGR and SSFP methods were carried out to compare the methods and validate the calibration approach outlined above. Note that the expected reduction in T2 from contrast arrival will be much smaller than the aforementioned blood oxygenation effects. In particular, for a tissue concentration of Gd-DTPA of 0.1 mM, the total reduction in T2 is from 30.0 ms to 29.6 ms, for an absolute change of only −0.4 ms, while the increase in T2 from blood oxygenation effects is about +5.0 ms. The estimated tissue concentration of 0.1 mM was measured from changes in leg muscle T1 values before and after contrast delivery.
FIG. 1.
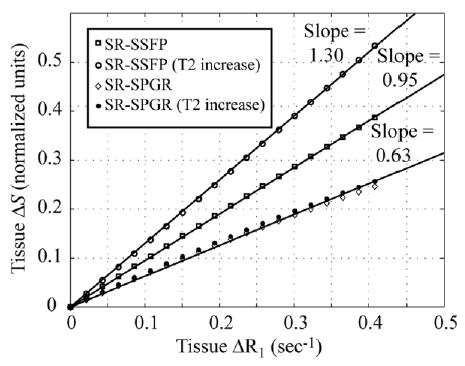
Numerical simulations of SR imaging sequences. The change in normalized image signal intensity, ΔS, is calculated for changes in tissue relaxation rates, ΔR1 and ΔR2, due to the effects of Gd-DTPA. A second curve is plotted for each imaging sequence to account for the potential effects of changes in ΔR2 from physiologic effects. Changes in T2 from 30 ms to 35 ms were assumed over the range of ΔR1 considered (0–0.4 sec−1). The solid lines are the best-fit straight lines to the simulation data that cross the origin.
For a single-compartment system, changes in the relaxation rates are linearly related to the concentration of Gd-DTPA, C, by the relaxivity, r = 4.3/s/mM, so that ΔR1 = Cr. Under these ideal conditions, the slope of the calibration curves in Fig. 1, Ω, can be used to express the tissue tracer concentrations, from Eqs. [1]–[3], in terms of the normalized MR signal intensity, ΔS = ΩΔR1 = ΩCtr. This relation can be used to express Eq. [3] in terms of the MR signal time-intensity curve, S(t).
| [4] |
The steady-state signal intensity from Eq. [4], which is achieved for t > ve/Ktrans, is directly proportional to the distribution volume:
| [5] |
The relationship between ΔR1 and Ct, and thus the MR signal intensity and Ct, can become nonlinear for compartmental systems due to the effects of water exchange between compartments (22–25). For a given rate of water exchange the nonlinearities become more pronounced as the difference between the compartmental tracer concentrations becomes larger. The exchange regime is typically determined with a comparison of the difference between compartmental relaxation rates, |R1(1) − R1(2)| = |1/T1(1) −1/T1(2)|, to the mean residency time of the water in the compartments, τ1 + tau;2 (22). The experiments in this study were designed so that arterial concentrations of Gd-DTPA during the first pass would be an order of magnitude less than the conventional dose used in cardiac studies (~0.45 mM vs. 3–5 mM, respectively). Significantly lower plasma concentrations of Gd-DTPA result in lower plasma and interstitial R1 values and correspondingly smaller concentration gradients between compartments. Furthermore, the vascular volume in skeletal muscle is signifi-cantly lower than that in myocardium, which again will reduce any potential nonlinear effects from water exchange. However, the effects of water exchange are also strongly influenced by imaging parameters such as the SR or inversion recovery (IR) times, repetition times (TRs), and flip angle (26). The relationship between these parameters and the effects of water exchange have not previously been reported for the SSFP pulse sequence, so it can not be determined at this point whether the experimental conditions described above will satisfy conditions sufficient for excluding the effects of water exchange in this study. We address this issue in this study by comparing signal enhancement of SR perfusion images with direct measurement of tissue T1 values. For the case of water exchange between the cellular and interstitial spaces, several previous studies have illustrated rapid water exchange between these compartments, so the extravascular space can be treated as one pool (27,28).
MATERIALS AND METHODS
Experimental Setup
All of the subjects (13 normal volunteers and one patient) were imaged in a supine position with their calves raised slightly, and ankle supports were used to prevent muscle deformation due to bed contact. Inflatable cuffs (10 cm wide) used for arterial occlusion were placed around the lower thigh just above the knee on both legs. An automated plethysmograph (D.E. Hokanson, Bellevue, WA) was used to inflate the cuffs to supersystolic pressures (>200 mmHg) and for subsequent rapid deflation (<1 s). The cuffs were inflated for 5 min for all studies. While it has been shown that peak hyperemic flow can be increased with arterial occlusions > 5 min (29), the relative increase is small and there is a significant increase in patient discomfort. The arterial occlusion was used to both induce ischemia in the calf muscles and exclude Gd-DTPA from the calf muscle until the time of cuff release. This method was designed to produce a step-input of contrast concentration that would coincide with the high flow period during early postischemic reactive hyperemia. An intravenous dose of 0.1 mmol/kg Gd-DTPA (Magnevist, Berlex, Wayne, NJ) was administered directly following cuff inflation to allow 5 min for contrast equilibration in the arterial blood pool prior to cuff release. All MR measurements were performed on a Siemens 1.5 T Sonata scanner (Siemens Medical Sytems, Erlangen, Germany) using a peripheral coil array for signal reception to allow coverage from the ankles to the upper thigh on both legs.
Imaging Protocol
Figure 2 displays the time-course of the localizers, T1 relaxometry, and perfusion experiments, along with the timing of cuff inflation and deflation. The perfusion slice prescriptions were identical to the IR experiments used for tissue T1 calculations with matched spatial resolution and slice thickness. Muscle T1 values were measured prior to cuff inflation, under resting conditions, and three times following contrast delivery using an IR single-shot fast spin-echo sequence. The experimental parameters were as follows: Ti = {100, 200, 400, 600, 800, 1200, 1800, 2400, 3600, 6000} ms, TR = 8000 ms (including Ti), 256 × 128 pts (128 echoes), FOV = 400 × 200 mm, TE = 40 ms, interecho spacing = 2.98 ms, slice thickness = 5 mm, BW = 200 kHz. A single T1 value was calculated from the IR data using a nonlinear least-squares fitting algorithm. The IR single-shot fast spin-echo T1 measurement experiment was validated by comparison with a conventional IR spin-echo experiment on phantoms. The perfusion experiment consisted of a series of SR SSFP images acquired beginning 20 s prior to cuff release, for a total of 90 s. The experimental parameters were Ti = 220 ms, TE/TR = 1.7 ms/3.4 ms, 256 × 128 pts, FOV = 400 × 200 mm, slice thickness = 5 mm, flip angle = 60°, and BW = 200 kHz. The SSFP calibration curves in Fig. 1 were calculated using the pulse sequence parameters listed above. Axial and coronal slices were acquired interleaved for an effective temporal resolution of 890 ms. The axial slice was prescribed at the mid-calf level. In order to estimate the concentration of Gd-DTPA in the blood plsma, Cp 0, blood T1 values in the femoral artery, proximal to the cuff, were measured three times after cuff release in both legs using a segmented SR-SSFP image series. The experimental parameters were Ti = {50, 100, 200, 400, 600, 800, 1200} ms, 32 views per segment, TE/TR = 3.0 ms/1.5 ms, 384 × 160 pts, FOV = 400 × 200 mm, slice thickness = 5 mm, flip angle = 60°, and BW = 200 kHz. Five averages were acquired to minimize signal variability due to inflow enhancement from pulsatile flow in the artery. A single T1 value was calculated from the SR data using a nonlinear least-squares fitting algorithm. As shown in Fig. 2, three serial measurements were made to illustrate the time-course of the tracer concentration in the blood following cuff release.
FIG. 2.
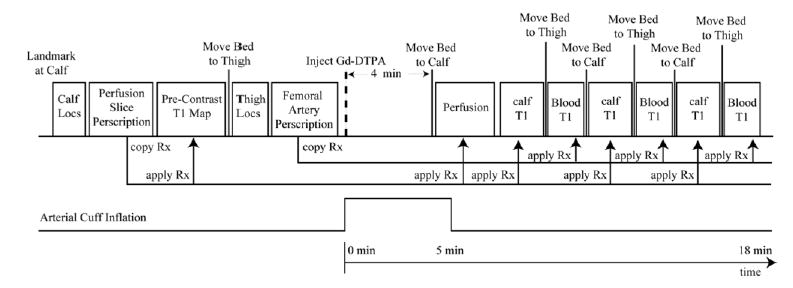
The time-course of the localizers, T1 relaxometry, and perfusion experiments with the onset of the occlusive cuff inflation and deflation. Slice prescriptions for calf perfusion and femoral artery studies, in the upper thigh, are made during the earlier localization portion of the study. All subsequent bed movements and slice locations are automatically copied from these previous prescriptions to minimize the time delay between all postcontrast-delivery experiments.
For all 11 volunteers in this portion of the study, a second postischemic reactive hyperemia experiment was performed directly following the Gd-DTPA inflow study. In this second experiment, bulk blood flow to the calves was measured at the level of the knee in the popliteal arteries using a gated-segmented phase contrast protocol. The phase contrast experiment was started at the time of cuff release and lasted 10–15 s. The experimental parameters were six views per segment, TE/TR = 3.0 ms/5.0 ms, 256 × 72 pts, FOV = 400 × 150 mm, slice thickness = 5 mm, flip angle = 30°, Venc = 150 cm/s, BW = 130 kHz. There was a rest period of >15 min between sequential cuff inflations. Calf localizer images were used to measure the total muscle mass below the knee for each volunteer to normalize the total inflow volume (ml/min) to unit mass (ml/g/min). We removed fat, vascular space, and bone from the measured volume by tracing the muscle tissue in each slice.
Additional perfusion studies were performed using an SR-SPGR protocol in two normal volunteers and a patient with documented peripheral artery disease. Although SPGR methods are known to suffer from a reduced signal-to-noise ratio (SNR) as compared to SSFP methods, they have the advantage of being insensitive to changes in tissue T2 for TE < T2, and thus will not be affected by blood oxygen effects (as are the SSFP data). To maintain the SNR attainable with the SSFP methods, a slice-interleaved SPGR protocol was developed. Slice-interleaving provides both an increased effective TR and an increased SR time, both of which can be used to increase the sensitivity of the MR signal intensity to changes in tissue T1. Also, because the slices are interleaved every TR, the information is acquired from all slices simultaneously, as opposed to sequentially. Slice-interleaving is not compatible with SSFP methods. The experimental parameters for the SR-SPGR experiments were six interleaved axial slices, Ti = 600 ms, TE/TR = 1.7 ms/6 × 3.4 ms, 192 × 64 pts, FOV = 400 × 167 mm, slice thickness = 5 mm, flip angle = 20°, BW = 100 kHz. The effective temporal resolution was 1320 ms, and 150 images were collected for each slice, for a total of 3.3 min of acquisition time. The SPGR calibration curves shown in Fig. 1 were calculated using the pulse sequence parameters listed above. The two volunteers and single patient studied with this protocol were imaged on consecutive days in order to provide a measure of the reproducibility of the estimated flow (Ki). Numerical simulations of the SSFP and SPGR perfusion experiments were used to compare the relative sensitivity of the two approaches to changes in tissue T1. Note that the slope of the calibration curves, Ω, as shown in Fig. 1, does not represent the sensitivity of the imaging method to the changes in tissue T1. In particular, the sensitivity is proportional to the absolute increase in signal intensity, S − Sbaseline, while the calibration coefficient is calculated as the normalized change in signal intensity, S/Sbaseline.
Image Processing
For each first-pass study, arterial blood T1 values were measured from within the femoral artery at three separate time points following the cuff release, as shown in Fig. 2. For muscle perfusion and T1 experiments, three regions of interest (ROIs) were selected in each calf from the axial slice image series. Volumes of 0.5–1.5 ml were selected from the medial gastrocnemius, soleus, and tibialis anterior muscle groups. Figure 3 displays an axial calf image showing the muscle groups of interest and typical regions selected in the target muscle groups. These same regions were studied for both the SSFP (11 subjects) and SPGR (three subjects) methods. For all studies, a mask was created in order to exclude pixels with values that changed more than a target threshold value over the course of the perfusion experiment. The target value for exclusion was determined empirically from several sample signal intensity time courses from the normal volunteers. The threshold was selected to eliminate the contribution from conduit vessel pixels and those that are contaminated by bulk tissue shifting at the time of cuff release, while retaining tissue pixels enhanced by Gd-DTPA inflow. Tissue shifting can cause high-intensity pixels from fat or blood vessels to move into regions that are targeted as muscle tissue. Normalized increases in absolute signal intensity of ≥0.6 and ≥0.3 were selected as the thresholds for the SR-SSFP perfusion and SPGR experiments, respectively. To minimize the effects of calf motion over the course of the perfusion experiment, an affine motion correction algorithm was used to correct for displacement relative to a reference image frame. Affine transformations incorporate the linear operations of translation, rotation, shearing, and scaling. Motion correction is particularly important at the time of cuff release due to potential gross leg displacement from the deflating cuff. Identical ROIs and masks were used to process the muscle T1 and perfusion data sets, including motion correction of the T1-weighted images relative to the perfusion series reference image. The mask was calculated after motion correction was applied.
FIG. 3.
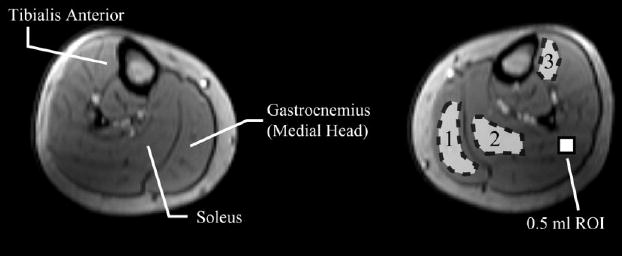
An axial slice at the midcalf level displays a typical prescription location and ROI placement in the medial gastrocnemius, soleus, and tibialis anterior muscle groups. A reference 0.5 ml ROI is shown to provide a scale reference.
Time-intensity curves from each ROI from the SR-SSFP and SR-SPGR image series were fit to Eq. [4] using a nonlinear least-squares fitting algorithm to solve for ve and Ki, using Ktrans = Ki ρ(1 − Hct), where ρ = 1.04 g/ml. The fitting procedure allows for a variable onset time to account for delays of contrast delivery from the cuff location to the imaging slice location. For the SSFP studies, an independent estimate of ve was made using the change in tissue T1 for a given change in the plasma concentration of Gd-DTPA, as shown in Eq. [6]. Tissue and blood T1 values used for ve calculations were measured directly following the perfusion experiment, as shown in Fig. 2.
| [6] |
The factor of (1 − Hct) corrects for the red blood cell volume in whole blood. A blood baseline longitudinal relaxation time of T1 0 = 1350 ms was assumed based on several measurements in normal volunteers. Note than an error of 100 ms in the estimated value of T1 0 for blood will give rise to an error of only ~3% in the estimated value of ve for the contrast doses used in this study.
RESULTS
Scatter plots in Fig. 4 display the measured relationship between the normalized signal intensity (ΔS) from the SR perfusion experiments and the corresponding changes in tissue longitudinal relaxation rates (ΔR1). Tissue T1’s were measured prior to contrast delivery and directly following the perfusion study, as shown in Fig. 2. Sample results are shown for both the SSFP pulse sequence and the slice-interleaved SPGR approach. The simulations, shown as solid lines in Fig. 2, incorporated a linear increase in T2 from 30 ms to 35 ms that paralleled the arrival of contrast agent or, equivalently, the change in the longitudinal relaxation rate, ΔR1. The simulated solid lines are identical to the results shown in Fig. 1. While the normalized change in signal intensity is much higher for the SSFP method (i.e., a steeper slope), the slice-interleaved SPGR method has approximately twice the sensitivity, or absolute signal enhancement per unit change in R1. In other words, the S/Sbaseline ratio is higher for the SSFP approach, as shown in Fig. 4, while the absolute increase in signal, S − Sbaseline, is higher (by a factor of ~2) for the SPGR approach. The T2 independence of the SPGR method, and the higher achievable sensitivity give this approach a clear advantage over the SSFP protocol.
FIG. 4.
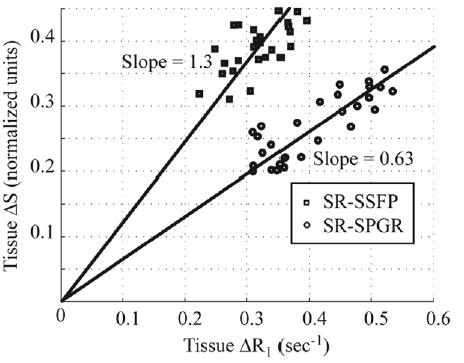
Normalized signal intensity (ΔS) from the SR-SSFP and SPGR perfusion experiments are plotted against changes in tissue longitudinal relaxation rates (ΔR1) measured prior to contrast delivery and directly following the perfusion study as shown in Fig. 2. The simulations incorporated a linear increase in T2 from 30 ms to 35 ms that paralleled the arrival of contrast agent or, equivalently, the change in the longitudinal relaxation rate, ΔR1.
To validate the assumption of a step-input of contrast concentration at the arterial level at the time of cuff release, we measured sample arterial and venous signal intensities from the axial calf perfusion images. Figure 5a and b display sample time-intensity curves from an artery, a vein, and a tissue region (medial gastrocnemius) from both legs of normal volunteer. Individual pixels were selected from the artery and vein lumens to minimize tissue partial volume effects. The arterial signal intensity increased from the baseline value to the higher plateau level in a single time frame (890 ms), as shown in Fig. 5. This “step-input” pattern was measured in the arteries of all subjects in this study. Signal enhancement due to inflow effects from pulsatility across the cardiac cycle, as opposed to the T1-shortening effects of the Gd-DTPA, can be seen on the higher plateau as a relatively small variation in signal intensity. The venous time-intensity curves were always delayed several seconds as compared to both the arterial and tissue curves, although with time courses that were always similar to the tissue response, as shown on the inset in Fig. 5b. The tissue time-intensity curve from Fig. 5b was amplitude-scaled and overlaid on the venous pixel time-intensity curve to highlight the similarity of the two time courses. Note that in the insert the venous time-intensity curve was offset by ~6 s to allow for direct comparison with the tissue time-intensity curve. Neither of the time-intensity curves were time-scaled. Results are shown from both legs in Fig. 5 to illustrate the consistency of the time-intensity curves in the arteries, veins, and muscle tissue between legs.
FIG. 5.
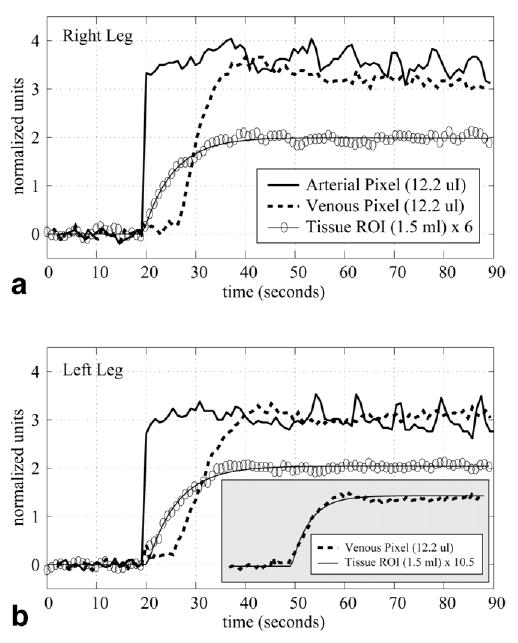
Normalized tissue (medial gastrocnemius), venous, and arterial time-intensity curves display the increase in MR signal intensity following the release of the arterial cuff and the subsequent inflow of Gd-DTPA into the calf. Results are shown for both the (a) right and (b) left legs. Single pixels were selected for the vessel time-intensity curves. The inset in b is an overlay of the venous and tissue time-intensity curves from the left leg. The venous curves was time-shifted and amplitude-scaled to allow for direct comparison of the curve shapes.
Figure 6 shows sample tissue time-intensity curves measured with the SSFP protocol from the medial gastrocnemius and soleus muscle groups from a normal volunteer, along with the curves fit to the data using Eq. [4]. The best-fit ve and Ki values are displayed on the figure. Independent estimates of ve for the same ROIs were calculated with Eq. [6] using blood and tissue T1 values measured before and directly after contrast delivery. This set of calculations was repeated for the three ROIs shown in Fig. 3, in the medial gastrocnemius, soleus, and tibialis anterior muscle groups in both legs for each of the 11 SSFP volunteers. Table 1 summarizes the parameters derived from the perfusion, tissue relaxometry, and blood relaxometry experiments. All values are reported as the means and standard deviations (SDs) from the group of 11 normal volunteers. The mean transit times (MTTs) reported in Table 1 are equivalent to the time constants for the step-input response, ve/Ktrans = ve/(Ki ρ(1 − Hct)), from Eq. [4]. The unidirectional influx constants, Ki, are reported both in terms of absolute flow units (ml/100 g/min) and as normalized values. Normalization was performed for each individual volunteer using the mean flow from the three flow regions (gastrocnemius, soleus, and tiabialis anterior) from both legs. The normalized data highlight the regional differences within the calf muscle for the whole study group, with less sensitivity to total mean flow for each individual. The mean blood and tissue T1 values used for the estimation of ve using Eq. [6] are also reported in Table 1. Tissue time-intensity curves fit using Eq. [4] yielded residuals that consisted predominantly of noise for all ROIs studied in all volunteers.
FIG. 6.
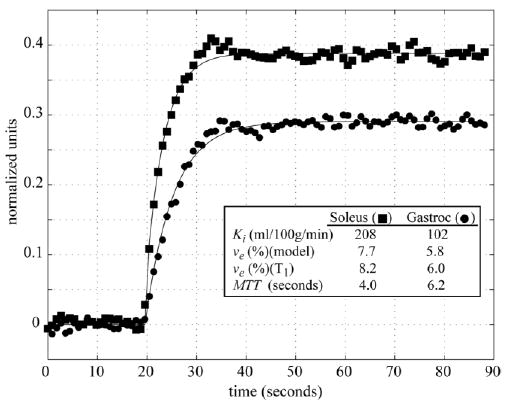
Sample tissue time-intensity curves from the soleus and medial gastrocnemius of a normal volunteer measured with the SR-SSFP protocol. The best-fit curves using Eq. [4] and the corresponding Ki, ve and MTT values are shown for both regions. The ve values calculated directly using tissue and blood T1 values before and after contrast delivery are also shown.
Table 1.
Tissue Kinetic Parameters, Distribution Volumes, and T1 Values
| Medial gastrocnemius
|
Soleus
|
Tibialis anterior
|
||||
|---|---|---|---|---|---|---|
| RL | LL | RL | LL | RL | LL | |
| MTT (sec) | 7.86 ± 1.85 | 8.21 ± 1.93 | 5.44 ± 1.38 | 5.06 ± 1.05 | 6.98 ± 1.66 | 7.28 ± 3.46 |
| vr (model) (%) | 8.32 ± 2.16 | 8.25 ± 2.08 | 9.46 ± 1.79 | 9.00 ± 1.94 | 7.96 ± 1.68 | 7.89 ± 1.89 |
| vr (T1) (%) | 9.06 ± 2.67 | 8.56 ± 2.39 | 9.35 ± 2.16 | 8.78 ± 1.80 | 6.72 ± 1.18 | 7.58 ± 1.61 |
| Ki (ml/100g/min) | 110.6 ± 33.1 | 106.7 ± 38.7 | 183.9 ± 41.9 | 185.0 ± 49.1 | 120.4 ± 38.4 | 124.1 ± 33.3 |
| Ki (norm) | 0.81 ± 0.18 | 0.76 ± 0.14 | 1.32 ± 0.11 | 1.33 ± 0.21 | 0.89 ± 0.27 | 0.89 ± 0.13 |
| ROI size (ml) | 1.20 ± 0.54 | 1.21 ± 0.43 | 0.91 ± 0.45 | 1.02 ± 0.51 | 0.51 ± 0.28 | 0.66 ± 0.22 |
| Tissue T1 (ms) | ||||||
| Pre-Gd | 1048 ± 34 | 1034 ± 33 | 1048 ± 24 | 1037 ± 31 | 1053 ± 21 | 1067 ± 27 |
| 2 min post | 797 ± 31 | 806 ± 23 | 793 ± 27 | 796 ± 27 | 854 ± 45 | 842 ± 26 |
| 9 min post | 789 ± 32 | 799 ± 28 | 794 ± 35 | 796 ± 38 | 848 ± 42 | 850 ± 31 |
| 16 min post | 793 ± 29 | 802 ± 29 | 800 ± 34 | 805 ± 42 | 855 ± 41 | 850 ± 29 |
| Blood T1 (ms) ([Gd-DTPA] (mM)) | RL | LL | ||||
| 3 min post | 375 ± 56 (0.46 ± 0.09) | 391 ± 59 (0.43 ± 0.09) | ||||
| 10 min post | 450 ± 37 (0.35 ± 0.04) | 427 ± 32 (0.37 ± 0.04) | ||||
| 17 min post | 456 ± 61 (0.35 ± 0.07) | 489 ± 56 (0.31 ± 0.05) | ||||
The scatter plot in Fig. 7 compares the bulk blood flow rates measured at the level of the popliteal artery using phase contrast velocity imaging with the unidirectional influx constants, Ki, for each of the 11 volunteers studied with the SSFP protocol. Note that the phase contrast flow rates are normalized to the calf muscle mass, excluding the contributions from the bone, fat, skin, and larger vessels. The influx constants reported from the CE studies are the average of the three regions analyzed in this study. The scatter plot shows a correlation between the phase-contrast and CE methods with an r2 value of 0.62 and P-value of 0.004. The phase-contrast results underestimate the flow rates as compared to the CE method, with a slope of 0.38.
FIG. 7.
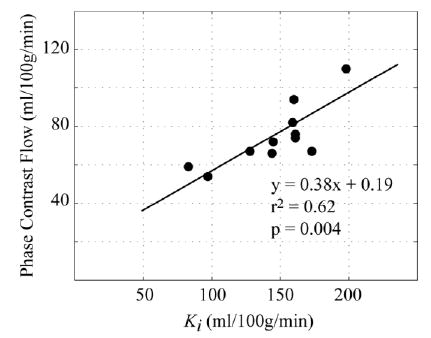
Hyperemic blood flow rates measured with the phase-contrast blood velocity method are compared with the unidirectional influx constants, Ki, measured with the SR-SSFP perfusion method in the same 11 normal volunteers.
Figure 8 highlights the regional flow patterns in a patient with documented peripheral artery disease. Measurements were repeated on consecutive days to illustrate the reproducibility of the technique. Ki maps are shown for four of the six slices, and reveal significantly lower flow in both the gastrocnemius and tibialis anterior groups compared to the soleus. Tissue time-intensity curves from the medial gastrocnemius and soleus groups are shown for two experiments from sequential days, and indicate excellent reproducibility. Comparable reproducibility of tissue time-intensity curves was observed in the two normal volunteers studied with the same protocol.
FIG. 8.
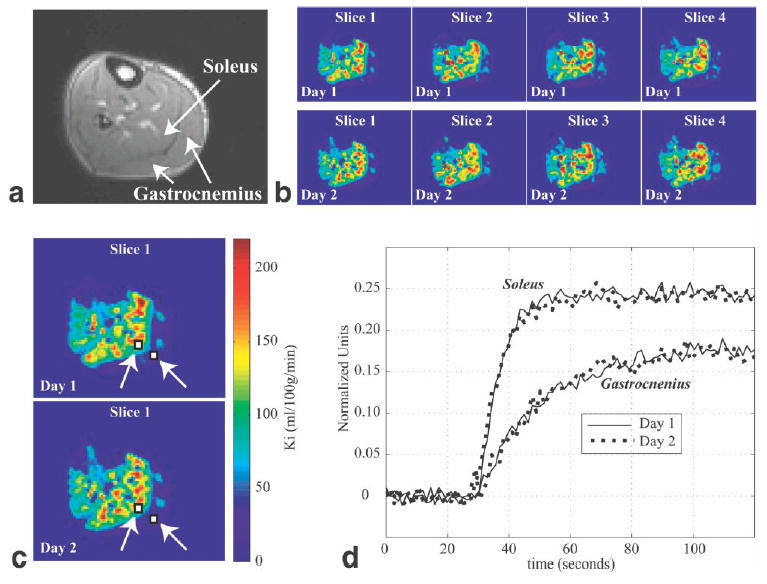
CE perfusion studies were repeated on consecutive days in a patient with documented peripheral artery disease. a: A typical calf cross-section perfusion image with gastrocnemius and soleus groups identified. b: Ki images from four slices collected with the SR-SPGR protocol from 2 consecutive days. c: Slice 1 from b is enlarged, and two ROIs (in the medial gastrocnemius and soleus) are indicated. The same color map is used for b and c. d: Sample tissue time-intensity curves collected on consecutive days from the ROIs identified in c.
DISCUSSION
Skeletal muscle blood flow (Ki) and contrast distribution volume (ve) can be estimated with first-pass CE-MRI. The new methods presented in this study were designed to measure blood flow during a period of postischemic reactive hyperemia while simultaneously delivering a step-input of arterial contrast concentration (Gd-DTPA). Blood flow was measured during a period of reactive hyperemia in order to eliminate the sensitivity of flow to resting vascular tone, which is highly variable and gives rise to corresponding variability in flow. Also, creating conditions of increased energy demands and increase flow are desirable in order to expose potential flow deficits that are not apparent at rest. The step-input of arterial contrast concentration generated at the time of cuff release drastically simplified the analysis of the resulting tissue time-intensity curves, and most notably eliminated the requirement for deconvolution with a measured AIF. Direct evaluation of contrast enhancement in the large arteries in the calves of the volunteers following cuff release clearly illustrated a step-input pattern all subjects. The simple input function reduced the analysis of tissue time-intensity curves to an optimization of a two-parameter equation, which was described by the transfer constant, Ktrans (Ki), and the interstitial fractional distribution volume of the Gd-DTPA, ve. There was good agreement between the distribution volumes estimated from fitting of the tissue time-intensity curves and with direct measurement of tissue and blood T1’s before and after contrast delivery. The distribution volumes ranged from 6% to 12%, in good agreement with values previously reported in the literature for skeletal muscle (18,30).
Postischemic reactive hyperemia (as opposed to exercise stress) was used to increase blood flow, for a number of reasons. First, the cuff inflations required no patient motion, which is particularly important given the constraints of the MR scanner bore and the limited freedom of motion with standard radiofrequency (RF) receiver coils. Second, postischemic reactive hyperemia allows for simple reproducibility of stress conditions simply by maintaining the duration of cuff inflation. Third, the arterial occlusion experiments are compatible with the mixing period required to generate a uniform concentration of contrast agent in the arterial blood pool. Finally, it has previously been shown that postischemic reactive hyperemia can generate conditions of maximal vasodilation (31). While exercise can generate higher peak flow rates compared to the cuff experiment (32), its use in an MR scanner requires specialized equipment to measure energy demands (33), and it is not compatible with the methods for contrast agent preloading described in this study.
In the group of 11 normal volunteers studied with the SR-SSFP protocol, the soleus Ki values were significantly higher than those in the gastrocnemius and tibialis anterior groups, with both higher distribution volumes and shorter MTTs. These results are consistent with previous studies (11), and are perhaps expected given the higher content of red muscle fibers in the soleus, and white muscle fibers in the gastrocnemius and tibialis. The red fibers have higher capillary density and more mitochondria, and consume more oxygen than white fibers, and thus have higher flow rates (34). The peak flow rates (Ki) reported in this study fall within the range of 50 ml/100 g/min to 200 ml/g/min. Although these rates are higher than those reported in many studies (7–10,12), they still fall below the peak flow rates measured in several groups, which ranged from 240 ml/100 g/min to 380 ml/100 g/min (35). Popliteal artery bulk blood flow studies have a moderate correlation with the CE results, although they predict peak flow rates that were lower by a factor of ~40%. Because the phase-contrast experiments used to measure the volumetric blood flow are segmented over many cardiac cycles, and the flow rate will decline over time following cuff release, it is reasonable to expect that the mean measured flow will be considerably less than the peak flow. Also, because blood flow is distributed between the muscle (~60%), fat, bone, and tendon (~25%), and skin and subcutaneous tissue (~15%) in the calf, bulk blood flow is an inaccurate measure of the muscular demands (36). Furthermore, the relative contributions from the array of tissue types vary significantly in the foot and ankle (36).
Both SSFP and the more conventional SPGR pulse sequences were evaluated in this study. While SSFP methods have received consideration attention recently, due the high signal yield and efficiency of this pulse sequence, it was determined that the SPGR approach offers higher sensitivity for SR imaging, particularly if slice interleaving is utilized. Also, the SPGR pulse sequence offers insensitivity to changes in tissue T2, while SSFP image intensity is directly modulated by changes in T2.
This study provides strong evidence that an insignificant amount of contrast agent moves between the vascular and interstitial spaces following the rapid increase in signal intensity after the cuff is released. First, the tissue perfusion time-intensity curves all displayed a long plateau following the initial 15–30 s of rapid signal change. Arterial time-intensity curves were similarly flat for the duration of the perfusion study, although they showed a slight downward slope due to slow clearance of the Gd-DTPA. This decrease in blood contrast agent concentration is also observed in the femoral artery T1 images, which show a slow increase in the blood T1 from ~380 ms to ~480 ms over 17 min after cuff release. Tissue T1 studies performed directly after the perfusion experiments for as long as 16 min post cuff release displayed consistent T1 values of ~800 ms in the soleus and gastrocnemius, and ~850 in the tibialis anterior. The stability of these numbers implies extremely slow movement of Gd-DTPA between the interstitial and vascular spaces after the initial period of inflow. While very slow extraction of the contrast agent is expected under conditions of rest given the low PS value of Gd-DTPA in skeletal muscle (~3ml/100 g/min) (37), this value is not consistent with the rapid extraction directly following cuff release. It is most likely that capillary recruitment (38) and increased permeability (39) during the period of reactive hyperemia significantly and transiently increased PS. Based on the standard representation of the unidirectional influx constant, Ki = F(1 − exp(−PS/F)), and given the large Ki values measured in this study (ranging from 50 ml/100 g/min to 200 ml/100 g/min), it is likely that the PS values increase significantly during the period of postischemic reactive hyperemia. Because Ki ≤F and Ki ≤PS by definition, our results show that PS increases to by up to 2 orders of magnitude during the high-flow period at the onset of postischemic reactive hyperemia. Anecdotal evidence of rapid equilibration of the vascular and interstitial contrast pools is provided by a comparison of the tissue and venous time-intensity curves, which again supports our proposal of a significant increase in PS during postischemic reactive hyperemia. In particular, for the case of highly permeable capillaries (PS > F), the tissue and venous contrast agent pools will be in equilibrium with a concentration ratio given by the distribution volume, ve, in Ct = veCv (17). In the Fig. 5 insert the venous and tissue time-intensity curves are shown to have very similar shapes, and the ratio of the signal intensities, St/Sv ~0.095, is in good agreement with the typical ve values reported in this study. For the case of low permeability, one would expect a much lower ratio of signal intensities, St/Sv, due to incomplete delivery of contrast agent to the interstitial space, and a tissue time-intensity curve with a longer apparent MTT compared to the venous curve. A low input concentration of Gd-DTPA (~0.45 mM) was used this study to minimize the potential effects of water exchange; however, no direct evidence was collected to confirm that the effects of exchange can be excluded. On the other hand, evidence of complete extraction of the contrast agent was presented, which will minimize the concentration gradient between the vascular and extravascular spaces, and thus further mitigate potential exchange effects.
While it was illustrated in this study that a step-input of contrast concentration could be generated in the large distal arteries in the calf, and thus also at the level of the occlusive thigh cuff, it is important to address the potential effects of arterial disease either proximal or distal to the cuff. Proximal disease, such as iliac or femoral artery blockage, will not influence the transfer function from a thigh cuff location to the target tissue region below the knee, and thus will not affect the flow measurements as described in this study, although such blockages will reduce the flow. Distal disease, on the other hand, may disperse the step-input function so that the local tissue in the calf will see a step-input convolved with a Gaussian-like shape (40), and will thus increase the apparent MTTs and lead to an underestimation of Ki. Errors from this kind of dispersive effect are universal in studies of flow that rely on the inflow of a contrast agent. Fortunately, any therapy or recovery that tends to reduce the effects of this dispersion will necessarily be beneficial and thus the change in apparent MTT, or flow, will be reflective of the actual improvement. A delay of the arrival of contrast from the cuff location to the muscle tissue of interest (as opposed to a dispersion) will not give rise to errors because the curve-fitting method used in this study corrects for the onset time, or the t = 0 reference. Although the results are not reported in this study, several volunteers were studied with a coronal slice orientation in addition to the axial slices. This image orientation allowed the step-input function to be observed in conduit arteries both near the knee and as low as the ankles, with negligible delays between arterial time intensity curves from these distant locations.
The kinetic model used in this study works with the assumption that the flow, F, and the permeability surface area, PS, and thus the unidirectional influx constant, Ki, are constant during the period of contrast inflow following cuff release. It is of course more likely that these terms change significantly from their peak values at the onset of hyperemia to the time of full recovery. While it is beyond the scope of this study to include the effects of transient flow and PS in the calculated Ki values, it can be expected that recovery of flow toward rest would tend to reduce the slope of the tissue intensity curves over time, and thus lead to an underestimation of the actual MTT and thus the Ki values. Although the data are acquired for as long as 2 min after the cuff release, the dynamic information is typically contained in the first 10–20 s after cuff release, while the rest of the time is spent sampling a signal plateau (as shown in the tissue time intensity curves in Figs. 5 and 6). This heavy weighting of dynamic information at the onset of the cuff release should reduce the impact of transiently reducing the kinetic parameters. In the future, the use of vascular contrast agents, which are not extracted to the interstitial space, will simplify the relationship between the true flow and the measured changes in MR signal intensity. Errors related to the estimation of the whole-blood hematocrit will also limit the quantitative interpretation of the estimated Ki values. Hematocrit values are known to vary with age, sex, and disease state, and even with local conditions within the capillaries. Despite the current limitations of the methods presented in this study, CE perfusion MRI offers the advantages of high spatial resolution, high temporal resolution, and sufficient SNR for measuring the accumulation of contrast agent in individual muscle groups or even individual pixels.
References
- 1.Wilkinson IB, Webb DJ. Venous occlusion plethysmography in cardiovascular research: methodology and clinical applications. Br J Clin Pharmacol. 2001;52:631–646. doi: 10.1046/j.1365-2125.2001.01495.x. [DOI] [PMC free article] [PubMed] [Google Scholar]
- 2.Rueckert PA, Hanson P. Comparison of arterial occlusion and ischaemic exercise for the study of vasodilatation in the human calf. Clin Sci (Lond) 1995;88:643–649. doi: 10.1042/cs0880643. [DOI] [PubMed] [Google Scholar]
- 3.Jorfeldt L, Vedung T, Forsstrom E, Henriksson J. Influence of leg position and environmental temperature on segmental volume expansion during venous occlusion plethysmography. Clin Sci (Lond) 2003;104:599–605. doi: 10.1042/CS20020257. [DOI] [PubMed] [Google Scholar]
- 4.Ament W, Lubbers J, Rakhorst G, Vaalburg W, Verkerke GJ, Paans AM, Willemsen AT. Skeletal muscle perfusion measured by positron emission tomography during exercise. Pflugers Arch. 1998;436:653–658. doi: 10.1007/s004240050685. [DOI] [PubMed] [Google Scholar]
- 5.Smye SW, Parkin A, Bloor MI. An analysis of a radionuclide technique used to measure reactive hyperaemia in limbs. J Biomed Eng. 1992;14:142–146. doi: 10.1016/0141-5425(92)90019-h. [DOI] [PubMed] [Google Scholar]
- 6.Parkin A, Robinson PJ, Wiggins PA, Leveson SH, Salter MC, Matthews IF, Ware FM. The measurement of limb blood flow using technetium-labelled red blood cells. Br J Radiol. 1986;59:493–497. doi: 10.1259/0007-1285-59-701-493. [DOI] [PubMed] [Google Scholar]
- 7.Toussaint JF, Kwong KK, M’Kparu F, Weisskoff RM, LaRaia PJ, Kantor HL. Interrelationship of oxidative metabolism and local perfusion demonstrated by NMR in human skeletal muscle. J Appl Physiol. 1996;81:2221–2228. doi: 10.1152/jappl.1996.81.5.2221. [DOI] [PubMed] [Google Scholar]
- 8.Lebon V, Carlier PG, Brillault-Salvat C, Leroy-Willig A. Simultaneous measurement of perfusion and oxygenation changes using a multiple gradient-echo sequence: application to human muscle study. Magn Reson Imaging. 1998;16:721–729. doi: 10.1016/s0730-725x(98)00088-5. [DOI] [PubMed] [Google Scholar]
- 9.Frank LR, Wong EC, Haseler LJ, Buxton RB. Dynamic imaging of perfusion in human skeletal muscle during exercise with arterial spin labeling. Magn Reson Med. 1999;42:258–267. doi: 10.1002/(sici)1522-2594(199908)42:2<258::aid-mrm7>3.0.co;2-e. [DOI] [PubMed] [Google Scholar]
- 10.Raynaud JS, Duteil S, Vaughan JT, Hennel F, Wary C, Leroy-Willig A, Carlier PG. Determination of skeletal muscle perfusion using arterial spin labeling NMRI: validation by comparison with venous occlusion plethysmography. Magn Reson Med. 2001;46:305–311. doi: 10.1002/mrm.1192. [DOI] [PubMed] [Google Scholar]
- 11.Donahue KM, Van Kylen J, Guven S, El-Bershawi A, Luh WM, Bandettini PA, Cox RW, Hyde JS, Kissebah AH. Simultaneous gradient-echo/spin-echo EPI of graded ischemia in human skeletal muscle. J Magn Reson Imaging. 1998;8:1106–1113. doi: 10.1002/jmri.1880080516. [DOI] [PubMed] [Google Scholar]
- 12.Nygren AT, Greitz D, Kaijser L. Skeletal muscle perfusion during exercise using Gd-DTPA bolus detection. J Cardiovasc Magn Reson. 2000;2:263–270. doi: 10.3109/10976640009148690. [DOI] [PubMed] [Google Scholar]
- 13.Lee JH, Hargreaves BA, Hu BS, Nishimura DG. Fast 3D imaging using variable-density spiral trajectories with applications to limb perfusion. Magn Reson Med. 2003;50:1276–1285. doi: 10.1002/mrm.10644. [DOI] [PubMed] [Google Scholar]
- 14.Luo Y, Mohning KM, Hradil VP, Wessale JL, Segreti JA, Nuss ME, Wegner CD, Burke SE, Cox BF. Evaluation of tissue perfusion in a rat model of hind-limb muscle ischemia using dynamic contrast-enhanced magnetic resonance imaging. J Magn Reson Imaging. 2002;16:277–283. doi: 10.1002/jmri.10169. [DOI] [PubMed] [Google Scholar]
- 15.Patel PP, Koppenhafer SL, Scholz TD. Measurement of kinetic perfusion parameters of gadoteridol in intact myocardium: effects of ischemia/reperfusion and coronary vasodilation. Magn Reson Imaging. 1995;13:799–806. doi: 10.1016/0730-725x(95)00032-c. [DOI] [PubMed] [Google Scholar]
- 16.Larsson HB, Stubgaard M, Sondergaard L, Henriksen O. In vivo quantification of the unidirectional influx constant for Gd-DTPA diffusion across the myocardial capillaries with MR imaging. J Magn Reson Imaging. 1994;4:433–440. doi: 10.1002/jmri.1880040332. [DOI] [PubMed] [Google Scholar]
- 17.Tofts PS, Brix G, Buckley DL, Evelhoch JL, Henderson E, Knopp MV, Larsson HB, Lee TY, Mayr NA, Parker GJ, Port RE, Taylor J, Weisskoff RM. Estimating kinetic parameters from dynamic contrast-enhanced T(1)-weighted MRI of a diffusable tracer: standardized quantities and symbols. J Magn Reson Imaging. 1999;10:223–232. doi: 10.1002/(sici)1522-2586(199909)10:3<223::aid-jmri2>3.0.co;2-s. [DOI] [PubMed] [Google Scholar]
- 18.Donahue KM, Weisskoff RM, Parmelee DJ, Callahan RJ, Wilkinson RA, Mandeville JB, Rosen BR. Dynamic Gd-DTPA enhanced MRI measurement of tissue cell volume fraction. Magn Reson Med. 1995;34:423–432. doi: 10.1002/mrm.1910340320. [DOI] [PubMed] [Google Scholar]
- 19.Price TB, Gore JC. Effect of muscle glycogen content on exercise-induced changes in muscle T2 times. J Appl Physiol. 1998;84:1178–1184. doi: 10.1152/jappl.1998.84.4.1178. [DOI] [PubMed] [Google Scholar]
- 20.Saab G, Thompson RT, Marsh GD. Effects of exercise on muscle transverse relaxation determined by MR imaging and in vivo relaxometry. J Appl Physiol. 2000;88:226–233. doi: 10.1152/jappl.2000.88.1.226. [DOI] [PubMed] [Google Scholar]
- 21.Nygren AT, Kaijser L. Water exchange induced by unilateral exercise in active and inactive skeletal muscles. J Appl Physiol. 2002;93:1716–1722. doi: 10.1152/japplphysiol.01117.2001. [DOI] [PubMed] [Google Scholar]
- 22.Landis CS, Li X, Telang FW, Molina PE, Palyka I, Vetek G, Springer CS., Jr Equilibrium transcytolemmal water-exchange kinetics in skeletal muscle in vivo. Magn Reson Med. 1999;42:467–478. doi: 10.1002/(sici)1522-2594(199909)42:3<467::aid-mrm9>3.0.co;2-0. [DOI] [PubMed] [Google Scholar]
- 23.Bauer WR, Roder F, Hiller KH, Han H, Frohlich S, Rommel E, Haase A, Ertl G. The effect of perfusion on T1 after slice-selective spin inversion in the isolated cardioplegic rat heart: measurement of a lower bound of intracapillary-extravascular water proton exchange rate. Magn Reson Med. 1997;38:917–923. doi: 10.1002/mrm.1910380610. [DOI] [PubMed] [Google Scholar]
- 24.Donahue KM, Weisskoff RM, Burstein D. Water diffusion and exchange as they influence contrast enhancement. J Magn Reson Imaging. 1997;7:102–110. doi: 10.1002/jmri.1880070114. [DOI] [PubMed] [Google Scholar]
- 25.Larsson HB, Rosenbaum S, Fritz-Hansen T. Quantification of the effect of water exchange in dynamic contrast MRI perfusion measurements in the brain and heart. Magn Reson Med. 2001;46:272–281. doi: 10.1002/mrm.1188. [DOI] [PubMed] [Google Scholar]
- 26.Donahue KM, Weisskoff RM, Chesler DA, Kwong KK, Bogdanov AA, Jr, Mandeville JB, Rosen BR. Improving MR quantification of regional blood volume with intravascular T1 contrast agents: accuracy, precision, and water exchange. Magn Reson Med. 1996;36:858–867. doi: 10.1002/mrm.1910360608. [DOI] [PubMed] [Google Scholar]
- 27.Donahue KM, Burstein D, Manning WJ, Gray ML. Studies of Gd-DTPA relaxivity and proton exchange rates in tissue. Magn Reson Med. 1994;32:66–76. doi: 10.1002/mrm.1910320110. [DOI] [PubMed] [Google Scholar]
- 28.Sobol WT, Jackels SC, Cothran RL, Hinson WH. NMR spin-lattice relaxation in tissues with high concentration of paramagnetic contrast media: evaluation of water exchange rates in intact rat muscle. Med Phys. 1991;18:243–250. doi: 10.1118/1.596722. [DOI] [PubMed] [Google Scholar]
- 29.Hillestad LK. Peripheral blood flow in intermittent claudication. V. Plethysmographic studies—significance of calf blood flow at rest and in response to timed arrest of circulation. Acta Med Scand. 1963;174:23–41. [PubMed] [Google Scholar]
- 30.Vincensini D, Dedieu V, Renou JP, Otal P, Joffre F. Measurements of extracellular volume fraction and capillary permeability in tissues using dynamic spin-lattice relaxometry: studies in rabbit muscles. Magn Reson Imaging. 2003;21:85–93. doi: 10.1016/s0730-725x(02)00638-0. [DOI] [PubMed] [Google Scholar]
- 31.Conway J. A vascular abnormality in hypertension. A study of blood flow in the forearm. Circulation. 1963;1:520–529. doi: 10.1161/01.cir.27.4.520. [DOI] [PubMed] [Google Scholar]
- 32.Andersen P, Saltin B. Maximal perfusion of skeletal muscle in man. J Physiol. 1985;366:233–249. doi: 10.1113/jphysiol.1985.sp015794. [DOI] [PMC free article] [PubMed] [Google Scholar]
- 33.Cheng CP, Schwandt DF, Topp EL, Anderson JH, Herfkens RJ, Taylor CA. Dynamic exercise imaging with an MR-compatible stationary cycle within the general electric open magnet. Magn Reson Med. 2003;49:581–585. doi: 10.1002/mrm.10364. [DOI] [PubMed] [Google Scholar]
- 34.Gray SD, Renkin EM. Microvascular supply in relation to fiber metabolic type in mixed skeletal muscles on rabbits. Microvasc Res. 1978;16:406–425. doi: 10.1016/0026-2862(78)90073-0. [DOI] [PubMed] [Google Scholar]
- 35.Radegran G, Blomstrand E, Saltin B. Peak muscle perfusion and oxygen uptake in humans: importance of precise estimates of muscle mass. J Appl Physiol. 1999;87:2375–2380. doi: 10.1152/jappl.1999.87.6.2375. [DOI] [PubMed] [Google Scholar]
- 36.Strandness DE, Sumner DS. Hemodynamics for surgeons. New York: Grune & Stratton;1975. 698 p.
- 37.Schmittmann G, Rohr UD. Comparison of the permeability surface product (PS) of the blood capillary wall in skeletal muscle tissue of various species and in vitro porous membranes using hydrophilic drugs. J Pharmacol Sci. 2000;89:115–127. doi: 10.1002/(SICI)1520-6017(200001)89:1<115::AID-JPS12>3.0.CO;2-7. [DOI] [PubMed] [Google Scholar]
- 38.Honig CR, Odoroff CL, Frierson JL. Capillary recruitment in exercise: rate, extent, uniformity, and relation to blood flow. Am J Physiol. 1980;238:H31–H42. doi: 10.1152/ajpheart.1980.238.1.H31. [DOI] [PubMed] [Google Scholar]
- 39.Jerome SN, Kong L, Korthuis RJ. Microvascular dysfunction in post-ischemic skeletal muscle. J Invest Surg. 1994;7:3–16. doi: 10.3109/08941939409018278. [DOI] [PubMed] [Google Scholar]
- 40.Weisskoff RM, Chesler D, Boxerman JL, Rosen BR. Pitfalls in MR measurement of tissue blood flow with intravascular tracers: which mean transit time? Magn Reson Med. 1993;29:553–558. doi: 10.1002/mrm.1910290420. [DOI] [PubMed] [Google Scholar]