

Abstract
Objective:
The objective of this study was to evaluate the prognostic significance of preoperative positron emission tomography (PET) using 2-fluoro-2-deoxy-D-glucose (FDG) by calculating the mean standardized uptake values (SUV) in patients with resectable soft tissue sarcomas (STS).
Summary and Background Data:
FDG-PET might be used as an adjunctive tool (in addition to biopsy and radiologic tomography) in the preoperative prognostic assessment of resectable STS.
Methods:
A total of 74 adult patients with STS underwent preoperative FDG-PET imaging with calculation of the SUV. Clinicopathologic data and the SUV were analyzed for an association with the clinical outcome. The first and the third quartiles of the SUV distribution function were used as cutoff values (1.59 and 3.6). Survival was estimated by the Kaplan-Meier method. Univariate and multivariate analyses were performed using log-rank test and the Cox proportional hazards regression model.
Results:
In 55 cases, STS were completely resected (follow up 40 months): 5-year recurrence-free survival rates in patients with SUV <1.59, 1.59 to <3.6, and ≥3.6 were 66%, 24%, and 11%, respectively (P = 0.0034). SUV was a predictor for overall survival (5-year rates: 84% [SUV <1.59], 45% [SUV 1.59 to <3.6], and 38% [SUV ≥3.6]; P = 0.057) and local tumor control (5-year rates: 93% [SUV <1.59], 43% [SUV 1.59 to <3.6], and 15% [SUV ≥3.6]; P = 0.0017). By multivariate analysis, SUV was found to be predictive for recurrence-free survival. The prognostic differences with respect to the SUV were associated with tumor grade (P = 0.002).
Conclusion:
The semiquantitative FDG uptake, as measured by the mean SUV on preoperative PET images in patients with resectable STS, is a useful prognostic parameter. SUV with cutoff values at the first and the third quartiles of the SUV distribution predicted overall survival, recurrence-free survival, and local tumor control. Therefore, FDG-PET can be used to improve the preoperative prognostic assessment in patients with resectable STS.
The prognostic significance of preoperative [18-F] fluorodeoxyglucose (FDG) positron emission tomography (PET) using standardized uptake values (SUV) was evaluated in patients with localized soft tissue sarcoma (STS). A SUV of <1.59 meant significantly better overall and recurrence-free survival and local tumor control than SUV 1.59 to <3.6 and SUV ≥3.6. SUV as measured in STS before resection is a useful prognostic parameter.
Preoperative prognostic assessment of survival and recurrence is limited in adult patients with resectable soft tissue sarcomas (STS). On the one hand, there are no specific preoperative radiologic criteria to evaluate the aggressiveness of STS (unless metastases are detected), and on the other hand, a histopathologic examination of a small tumor biopsy may not reflect the true malignant capacity (tumor grade and tumor subtype) of a STS.1–5
At present, survival and recurrence probability in patients with STS is evaluated postoperatively by the American Joint Committee on Cancer/International Union Against Cancer (AJCC/UICC) or Memorial Sloan-Kettering Cancer Center (MSKCC) staging systems.6,7 Staging systems for STS are important to identify patients with similar systemic risk who might benefit from specific treatment.7 Postoperative prognosis is based on histopathologic data from the resected specimen (tumor grade, tumor size, and resection margin), tumor location, type of surgery, and the absence or presence of metastasis or residual tumor.8–10
Therapeutic decisions concerning neoadjuvant or intraoperative adjuvant treatment (either to improve local control or to target systemic disease), however, are based on preoperative prognostic criteria in STS.11–14 Thus, preoperative evaluation of the malignant capacity of STS is of major importance. An improved presurgical evaluation of the biologic nature of STS might help to identify high-risk patients for additive preoperative or intraoperative treatment modalities (local or systemic). In addition, patients with a low risk for sarcoma recurrence and a favorable prognosis could be excluded from such additive therapies.11 Consequently, preoperative prognostic assessment with respect to tumor recurrence and survival has to be addressed in patients with STS who are scheduled for curative resection.
Positron emission tomography (PET) using 2-fluoro-2-deoxy-D-glucose (FDG) is a unique diagnostic tool with which tumor glucose metabolism can be evaluated in vivo.15–17 Furthermore, there is evidence that FDG-PET can be used a prognostic tool to assess the aggressiveness (staging) and thus the clinical course in patients with malignant tumors.18–20 In certain types of carcinomas (pancreas, colorectal, lung, and head and neck), FDG uptake, expressed semiquantitatively by the standardized uptake values (SUV), has been reported to be associated with prognosis.21–27 Preliminary data on the use of the SUV to evaluate the prognosis in patients with sarcoma (soft tissue, bone, and cartilage) are promising.28 Therefore, the value of preoperative FDG-PET imaging calculating the SUV as a predictor for survival and recurrence (local or systemic) in adult patients with localized STS has to be clarified. We report the results of an observation study investigating the use of semiquantitative FDG-PET imaging (SUV) as a prognostic tool in the preoperative assessment of STS in patients who subsequently are scheduled to undergo sarcoma resection.
MATERIALS AND METHODS
Patients
We gathered data from 74 patients with the diagnosis of STS and treated surgically at the Department of Surgery, University of Heidelberg between January 1996 and March 2002. Patients’ median age was 55 years (range, 19–82 years), and the male-to-female ratio was 1.5 to 1. All patients underwent semiquantitative PET imaging before surgery.
Metabolic disease (diabetes) was an exclusion criterion as a result of the altered glucose metabolism affecting the SUV measurements. Because of the tissue changes during wound healing, we also excluded patients who were referred for reoperation after incomplete sarcoma resection at another institution. According to these criteria, 5 patients (3 with diabetes and 2 for reoperation) were excluded from the analysis. None of the patients had received chemotherapy or radiation therapy within 6 months before the PET studies.
Altogether, 56 of the 74 patients were treated by complete STS resection with no residual tumor (local or distant) diagnosed at the time of surgery. Debulking was carried out in 8 patients (11%) and the tumor was rendered unresectable in 10 patients (biopsy/explorative laparotomy). A total of 37 patients received intraoperative radiation therapy combined with external boost radiation treatment (median, 58 Gy; range, 52–78 Gy), and 3 patients received adjuvant chemotherapy (adriamycin/ifosfamide). Excluding 1 patient who died perioperatively, data from 55 patients who were treated for 32 primary and 23 recurrent localized STS by complete surgical resection were used to analyze the prognostic relevance of the semiquantitative FDG uptake.
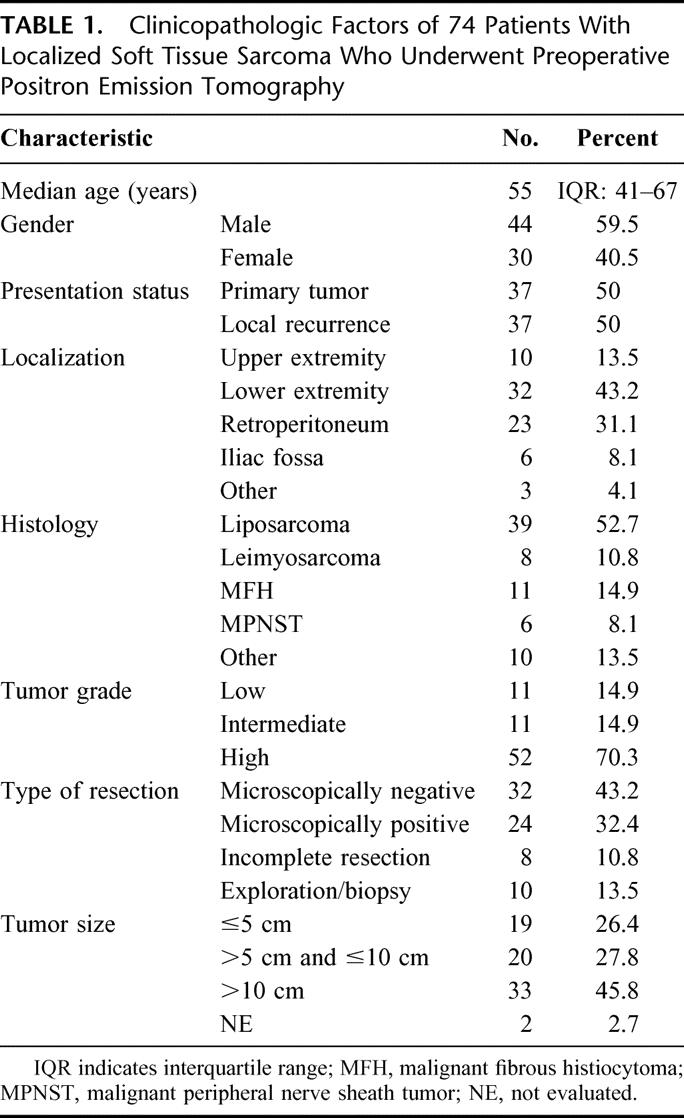
Specimens were seen by 1 pathologist (GM), and the tumors were classified according to international recommendations.6,29,30 Tumors were mainly located in the extremities (57%) and in the retroperitoneum (31%). Liposarcoma was the predominant histologic type, diagnosed in 39 cases (Table 1). The histopathologic report of resected STS revealed high-grade tumors in 70% and intermediate-grade as well as low-grade malignancies in 15% each. In patients with completely resected STS, resection margins were microscopically negative in 32 cases (as compared with 24 patients with positive margins).
TABLE 1. Clinicopathologic Factors of 74 Patients With Localized Soft Tissue Sarcoma Who Underwent Preoperative Positron Emission Tomography
Patients were entered in a close clinical follow-up study conducted according to a standard protocol at our outpatient department and in cooperation with the family physician (end of the follow-up period was January 2003). SUV was correlated with the follow-up data and clinicopathologic parameters from our prospective Sarcoma Database.
Positron Emission Tomography
Written informed consent was obtained from all patients before the PET studies. A PET scanner with 2 rings of detectors (PC 2048–7 WB; Scanditronix Co., Uppsala, Sweden) or a system with 32 rings in block detector technology (ECAT EXACT HR plus; Siemens CTI Co., Knoxville, TN) was used. The evaluation of spatial linearity, FDG generation, and radiochemical purity verification have been described before.31 Serum glucose levels were measured before PET imaging (patients fasted overnight). After intravenous application of 370 to 440 MBq FDG, serial images were obtained during a total acquisition time of 60 minutes. The last images (55–60 minutes postinjection) were used for semiquantitative analysis. PET cross-sections were reconstructed with an image matrix of 256 × 256 using an iterative reconstruction program.32 Images were scatter- and attenuation-corrected. Regions of interest (ROIs) were placed over the lesion. To acquire information about the tumor viability, the hypermetabolic areas of the tumors were evaluated and hypometabolic areas that correlate to necrotic tissue were excluded. The SUV in the tumor was calculated according to the following equation: SUV = tissue concentration [MBq/g]/injected dose [MBq]/body weight [g]. The SUV reflected the average SUV value provided by the quantification software in a ROI. This value is more robust than the maximum SUV, because it is less influenced by the parameters used for the image reconstruction (number of iterations and subsets) as well as by potential artifacts. The analysis of the PET images was performed together by 2 nuclear medicine physicians (AD-S, LGS) using the software package Pmod (provided in cooperation with the University of Zurich, Switzerland).33 The nuclear medicine physicians were masked to the medical records and follow-up data of the patients for the semiquantitative PET analysis.
Statistical Analysis
SAS software, release 6.12, was used for statistical analysis. Recurrence-free survival, overall survival, and local tumor control were considered end points. Recurrence-free survival was defined as the time interval from the date of complete resection until the tumor recurred or the patient died of sarcoma-related causes. Overall survival was defined as the time interval from the date of operation in our clinic until death. Patients who were still alive were censored at the last follow up. Local tumor control was defined as the time interval from the date of complete resection until local failure occurred.
Survival rates and the rate of local tumor control were estimated by the Kaplan-Meier method. Survival curves were compared with the log-rank test. Multivariate analysis was performed with the proportional hazards model to assess the predictive value of the following dichotomized variables on recurrence-free survival: SUV (cutoff value 1.59), tumor location (retroperitoneal vs. other), tumor grade (high vs. low/intermediate), and microscopic margin of resection (negative vs. positive).
The distribution of SUV was asymmetrically right-skewed with a range of 0.29 to 10.9. The quartiles of the SUV distribution were 1.59 (Q1), 2.16 (median), and 3.6 (Q3). To examine a linear correlation of SUV and survival, a Cox model with SUV as a continuous variable was performed. To analyze the impact of SUV on the study end points, the quartiles were used to divide patients into groups of equal numbers. Distinct prognostic groupings were produced with SUV cutoff values of 1.59 and 3.6.
Comparisons of SUV groups with grading, localization, and margin of resection were analyzed with Fisher exact test. Two-sided P values were always computed and an effect was considered statistically significant at a P value ≤0.05.
RESULTS
The SUV as measured in STS before complete resection is a useful prognostic parameter. Patients with a preoperative SUV that is equal to or exceeding 1.59 had a higher risk of local and distant STS recurrence after complete resection than patients with a SUV lower than 1.59. Furthermore, local tumor control of patients with a low FDG uptake (SUV <1.59) was significantly better than in patients with a high FDG uptake (SUV 1.59–3.6 and SUV ≥3.6). Multivariate analysis showed that the SUV with a cutoff value of 1.59 is prognostically relevant in predicting recurrence-free survival. The prognostic differences observed among patients with a SUV <1.59 and SUV ≥1.59 seemed to be associated with the tumor grade of STS (correlation between the tumor grade and the SUV, P = 0.002).
Follow-up Data
Seventy-four patients with a histologic diagnosis of STS were included. Analysis of the overall survival showed that patients with unresectable tumors and patients with incomplete tumor resection did not survive longer than 3 years. Estimated median survival times in patients with unresectable and incompletely resected STS were 6 and 26 months, respectively (Fig. 1). A total of 55 patients who were treated by complete tumor resection were used for the estimation of local tumor control, recurrence-free, and overall survival analysis. Median follow up was 40 months (interquartile range: 25–62 months). In all, 32 patients developed local or distant relapse after a median time period of 14 months, 16 patients local recurrence (29%), 10 patients distant metastases (18%), and 6 patients local recurrence and distant metastases (11%). The 5-year overall survival was 56% for the entire group (n = 55), 63% after complete resection with microscopically clear margins (n = 32) and 46% after complete resection with microscopically positive margins (n = 23). The difference between the survival curves (negative margin vs. positive margin) was not statistically significant (P = 0.11).

FIGURE 1. Overall survival distribution function stratified by extent of operation (complete resection with microscopically negative and positive margin, incomplete resection, and exploration/biopsy) of 74 patients with soft tissue sarcomas.
Univariate Analysis
The univariate analysis of the recurrence-free survival in patients undergoing complete resection of their STS was correlated with different prognostic factors. Besides tumor grade (low vs. intermediate vs. high) (P <0.001) and margin of resection (negative vs. positive) (P = 0.0072), the SUV (<1.59 vs. ≥1.59) (P = 0.0034) also correlated with recurrence-free survival (Table 2). Tumor location (retroperitoneal vs. other locations [extremities, trunk, and pelvis]) and presentation status (primary tumor vs. local recurrence) failed to reach statistical significance (P = 0.17 and P = 0.68). The distribution of SUV in primary sarcoma and in local recurrence was comparable (median SUV, 2.38 vs. 2.11, P = 0.99). The strongest impact on recurrence-free survival of SUV was observed at cutoff values of 1.59 and 3.6, representing the first and the third quartiles of the SUV distribution (Fig. 2). Consequently, patients were divided into 3 groups: group I, SUV <1.59 (n = 14); group II, SUV 1.59 to <3.6 (n = 27); and group III, SUV ≥3.6 (n = 14).
TABLE 2. Univariate Analyses of Clinicopathologic Factors and Recurrence-Free Survival After Complete Resection of Soft Tissue Sarcoma in 55 Patients


FIGURE 2. Recurrence-free survival distribution function stratified by the mean standardized uptake value (SUV). Preoperative SUV <1.59 versus preoperative SUV 1.59 to <3.6 versus preoperative SUV ≥3.6 in 55 patients treated by complete resection of soft tissue sarcomas.
The 5-year recurrence-free survival rate of group I was 66% compared with 24% for group II and to 11% for group III (P = 0.0034) (Fig. 2). In group I, only 4 of 14 patients (29%) experienced tumor relapse, whereas 16 of 27 patients (59%) did so in group II and 12 of 14 (86%) did so in group III.
SUV furthermore proved to be a predictor for overall survival. As shown in Figure 3, there was a difference concerning the 5-year survival between the 3 groups. Although the overall survival in group I was estimated at 84% after 5 years, the corresponding 5-year overall survival rates of group II and group III were calculated at 45% and 38% (P = 0.057). During follow up, only 2 disease-related deaths were observed in group I, whereas 9 patients of group II and 7 patients of group III died of recurrent disease. The median survival times in group II and group III were 47 and 36 months; the median survival time in group I was not yet observed at the end of follow up.

FIGURE 3. Overall survival distribution function stratified by the mean standardized uptake value (SUV). Preoperative SUV <1.59 versus preoperative SUV 1.59 to <3.6 versus preoperative SUV ≥3.6 in 55 patients treated by complete resection of soft tissue sarcomas.
A strong difference was also observed with respect to local tumor control after complete resection. Hardly any of the patients in group I (n = 1) developed local recurrence. Local recurrence, however, was common event in patients in group II (n = 11) and in patients in group III (n = 10) (Fig. 4). The 5-year local control rate in group I according to the Kaplan-Meier estimates was noted with 93% as compared with 43% in group II and 15% in group III (P = 0.0017).

FIGURE 4. Local tumor control stratified by the mean standardized uptake value (SUV). Preoperative SUV <1.59 versus preoperative SUV 1.59 to <3.6 versus preoperative SUV ≥3.6 in 55 patients treated by complete resection of soft tissue sarcomas.
Multivariate Analysis
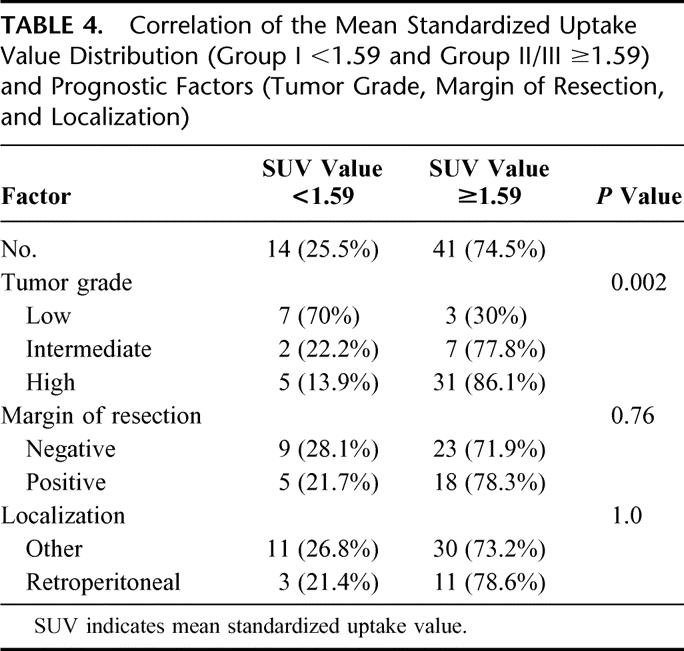
Multivariate analyses were performed for recurrence-free survival with the variables tumor grading, tumor location, margin of resection, and SUV. In the final Cox model (likelihood ratio test: P <0.001), tumor grade (high vs. low/intermediate) was confirmed as the strongest predictor of disease-free survival (Table 3). Tumor location (retroperitoneal vs. other [extremities, trunk, pelvic]) did not affect the prognosis and was excluded from the final model. SUV dichotomized at the cutoff value of 1.59, and resection margin shows prognostic relevance, but did not reach statistical significance (Table 3). However, we found a relationship between tumor grade and SUV measurements in patients after complete STS resection (Table 4). In group I (SUV <1.59), low-grade tumors (70%) were predominantly diagnosed at histopathologic examination of the resected specimen. In contrast to this finding, the histopathologic grade of the resected STS in patients in groups II and III (SUV ≥1.59) was in most cases referred to as high (n = 31) or intermediate (n = 7). The correlation between the tumor grade and the SUV of patients in group I and those in group II/III was statistically significant (P = 0.002). In contrast to this observation, the margin of resection and location (retroperitoneal vs. other [extremities, trunk, pelvis]) did not show a difference among patients in group I or II/III. This was also reflected by a P value of 0.76 with respect to margin of resection (negative vs. positive) and a P = 1.0 for tumor location between groups I and II/III.
TABLE 3. Multivariate Analysis (Tumor Grade, Margin of Resection, Location, Mean Standardized Uptake Value) of Recurrence-Free Survival After Complete Resection of Soft Tissue Sarcomas in 55 Patients (Final Cox Model)
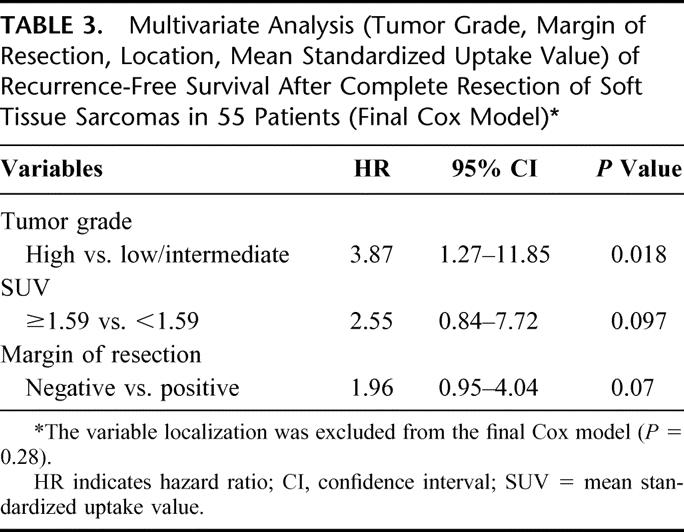
TABLE 4. Correlation of the Mean Standardized Uptake Value Distribution (Group I <1.59 and Group II/III ≥1.59) and Prognostic Factors (Tumor Grade, Margin of Resection, and Localization)
DISCUSSION
We found a statistically significant association between FDG uptake in preoperative PET imaging, as measured by the mean SUV, and prognosis in adult patients undergoing complete resection of localized STS. In patients with a SUV <1.59, prognosis was significantly better (overall and recurrence-free survival), and local tumor control improved more than in patients whose STS was diagnosed with a SUV ≥1.59. Prognostic differences as indicated by the SUV seemed to be influenced by tumor grade.
Recently, considerable data regarding the diagnostic use of FDG-PET for the detection of primary tumors and local recurrence in patients with STS have emerged in the literature. An actual metaanalysis clearly demonstrates that FDG-PET is an effective diagnostic tool for the evaluation of both primary and recurrent soft tissue lesions.34 FDG-PET has also been used for monitoring the clinical response of chemotherapy in patients with STS.35,36 The role of preoperative FDG-PET scanning in patients with resectable STS for predicting survival and recurrence is unclear. Therefore, we extended our observations to the prognostic significance of preoperative semiquantitative FDG-PET imaging in patients undergoing sarcoma resection.
We used the mean SUV for semiquantitative measurement of FDG uptake and evaluated the hypermetabolic areas of the lesions to assess primarily sarcoma viability. SUV represents an average value of different regions of interest in the entire tumor excluding effects of high-glucose uptake effects. SUVs of 1.59 and 3.6 proved to be the most specific cutoff values for the purpose of predicting overall, recurrence-free survival and local recurrence. Reviewing the current literature, there is only 1 report about the predictive value of FDG-PET in patients with sarcoma including bone, soft tissue, and cartilage tumors.28 In the latter investigation, the use of the maximum SUV (SUVmax) was suggested for predicting survival. Patients whose tumor SUVmax were greater than the median SUVmax of different sarcomas (bone, soft tissue, and cartilage) were seen to have a poorer prognosis (survival and disease-free survival) than those whose tumor SUVmax values were below that cutoff.28
We, like other investigators, showed previously that SUV correlates with tumor grade in STS.31,34,37,38 Grade is a major predictor for survival and recurrence in patients with STS.6–10 The correlation between grade and the FDG uptake as measured by the SUV might be 1 explanation for the value of FDG-PET as a predictor of survival and recurrence-free survival in this series. Interestingly, we found a correlation between FDG uptake and the probability of local recurrence, indicating that preoperative SUV measurements can be used as a predictor for local control after complete resection. The use of adjunctive parameters such as the transport rates of FDG was addressed in a recent analysis, as discussed by Dimitrakopoulou-Strauss et al.37 In the latter analysis, the discriminant analysis showed that the combined application of the mean SUV and dedicated kinetic parameters (eg, the transport rates k1 and k3, the distribution volume VB, the metabolic rate according to Patlak, and the fractal dimension of the time-activity curve) led to superior results with respect to the noninvasive PET grading of soft tissue tumors. This multiparameter approach helped to discriminate in particular intermediate-grade tumors (positive predictive value of 84% for high-grade, 37.5% for intermediate-grade, and 80% of low-grade sarcomas). In comparison, the use of SUV alone demonstrated a positive predicted value of 92% for high-grade and 50% for low-grade tumors. However, intermediate-grade tumors could not be discriminated as a result of an overlap using SUV as a single criterion. Although, the multiparameter analysis appeared helpful for a noninvasive grading of STS, we restricted the prognostic analysis to the mean SUV for the purpose of this report because of the simple clinical application. In breast cancer, FDG uptake was reported to be a function of multiple factors (delivery [microvasculature], transport [Glut-1], and glycolysis [Hexokinases], amount of tumor cells/volume, proliferation rate, and number of lymphocytes).39 SUV is also known to correlate with diverse biologic and clinical prognostic parameters (eg, histologic subtype and proliferative activity [Ki-67]).40,41 Similarly, STS are heterogeneous tumors with diverse histopathologic characteristics that may influence glucose metabolism and thus the FDG uptake.31,42 On a broader basis, further factors influencing FDG uptake may be identified that might explain the prognostic capacity of semiquantitative PET scanning.
Considering the wide range of clinical courses in adult patients subsequent to function-sparing resection of localized STS and the improved effectiveness of neoadjuvant or intraoperative treatment modalities (radiotherapy and chemotherapy), preoperative prognostic assessment becomes increasingly important. Current prognostic parameters in STS do not always equate with tumor relapse or poor survival. For example, 72% of patients with a positive microscopic resection margin after surgery for localized STS did not develop recurrence.9 Thus, the Memorial Sloan-Kettering Cancer Center physicians concluded that considerable clinical judgment is required when deciding on additional treatment to increase local control.9 Neither radiologic tomography nor clinical evaluation is sufficient for the preoperative assessment of the malignant capacity of soft tissue tumors.1–3,30 In large masses, the preoperative histopathologic evaluation of a small specimen obtained by random incisional or needle biopsy may not be representative for the true malignant potential (grade and subtype), although in most cases the malignancy is diagnosed.3–5,30 Our observation data suggests that the calculation of SUV is a useful method for preoperative noninvasive assessment of the aggressiveness of resectable STS with respect to the overall, recurrence-free survival and local recurrence. FDG-PET imaging using the SUV may complement radiologic tomography and histopathologic grading, thus improving the preoperative assessment of STS and implying an influence on therapeutic decisions in the future.
ACKNOWLEDGMENTS
The authors gratefully acknowledge the continuous support from Gisela Irngartinger, MD, and the staff members of the PET facility for their assistance in preparing the radiopharmaceuticals and performing the imaging studies.
Footnotes
Supported in part by a grant by the “Tumorzentrum Heidelberg-Mannheim” and by the National Council for Science and Technology (CONACYT, fellowship of Servando Cardona, Mexico).
Reprints: Matthias H. M. Schwarzbach, MD, Department of Surgery, University of Heidelberg, Im Neuenheimer Feld 110, 69120 Heidelberg, Germany. E-mail: matthias_schwarzbach@med.uni-heidelberg.de.
REFERENCES
- 1.Frassica FJ, Khanna JA, McCarthy EF. The role of MR imaging in soft tissue tumor evaluation: perspective of the orthopedic oncologist and musculoskeletal pathologist. Magn Reson Imaging Clin North Am. 2000;8:915–927. [PubMed] [Google Scholar]
- 2.De Schepper AM, De Beuckeleer L, Vandevenne J, et al. Magnetic resonance imaging of soft tissue tumors. Eur Radiol. 2000;10:213–223. [DOI] [PubMed] [Google Scholar]
- 3.Imaizumi S, Morita T, Ogose A, et al. Soft tissue sarcoma mimicking chronic hematoma: value of magnetic resonance imaging in differential diagnosis. J Orthop Sci. 2002;7:33–37. [DOI] [PubMed] [Google Scholar]
- 4.Jones C, Liu K, Hirschowitz S, et al. Concordance of histopathologic and cytologic grading in musculoskeletal sarcomas: can grades obtained from analysis of the fine-needle aspirates serve as the basis for therapeutic decisions? Cancer. 2002;96:83–91. [DOI] [PubMed] [Google Scholar]
- 5.Hoeber I, Spillane AJ, Fisher C, et al. Accuracy of biopsy techniques for limb and limb girdle soft tissue tumors. Ann Surg Oncol. 2001;8:80–87. [DOI] [PubMed] [Google Scholar]
- 6.Sobin LH, Wittekind C, eds. International Union Against Cancer (UICC): TNM Classification of Malignant Tumors, 6th ed. New York: Wiley; 2002:114–118. [Google Scholar]
- 7.Wunder JS, Healey JH, Davis AM, et al. A comparison of staging systems for localized extremity soft tissue sarcoma. Cancer. 2000;88:2721–2730. [DOI] [PubMed] [Google Scholar]
- 8.Stefanovski PD, Bidoli E, De Paoli A, et al. Prognostic factors in soft tissue sarcomas: a study of 395 patients. Eur J Surg Oncol. 2002;28:153–164. [DOI] [PubMed] [Google Scholar]
- 9.Stojadinovic A, Leung DH, Hoos A, et al. Analysis of the prognostic significance of microscopic margins in 2.084 localized primary adult soft tissue sarcomas. Ann Surg. 2002;235:424–434. [DOI] [PMC free article] [PubMed] [Google Scholar]
- 10.Lewis JJ, Leung D, Espat J, et al. Effect of reresection in extremity soft tissue sarcoma. Ann Surg. 2000;231:655–663. [DOI] [PMC free article] [PubMed] [Google Scholar]
- 11.Eble MJ, Quentmeier A, Ewerbeck V, et al. Methodology, technical prerequisites and postoperative morbidity of intraoperative radiotherapy (IORT) of soft tissue sarcomas. Heidelberg Krankengut 6/91–9/92. Radiologe. 1993;33:513–519. [PubMed] [Google Scholar]
- 12.Lehnert T, Schwarzbach M, Willeke F, et al. Intraoperative radiotherapy for primary and locally recurrent soft tissue sarcoma: morbidity and long-term prognosis. Eur J Surg Oncol. 2000;26(suppl A):21–24. [PubMed] [Google Scholar]
- 13.Gortzak E, Azzarelli A, Buesa J, et al. EORTC Soft Tissue Bone Sarcoma Group and the National Cancer Institute of Canada Clinical Trials Group/Canadian Sarcoma Group. A randomised phase II study on neo-adjuvant chemotherapy for ‘high-risk’ adult soft-tissue sarcoma. Eur J Cancer. 2001;37:1096–1103. [DOI] [PubMed] [Google Scholar]
- 14.Edmondson JH, Petersen IA, Shives TC, et al. Chemotherapy, irradiation, and surgery for function-preserving therapy of primary extremity soft tissue sarcomas: initial treatment with ifosfamide, mitomycin, doxorubicin, and cisplatin plus granulocyte macrophage-colony-stimulating factor. Cancer. 2002;94:786–792. [DOI] [PubMed] [Google Scholar]
- 15.Warburg O. The Metabolism of Tumors. New York: Smith; 1931. [Google Scholar]
- 16.Som P, Atkins HL, Bandoypadhyay D, et al. A fluorinated glucose analog, 2-fluoro-2-deoxy-D-glucose (F-18): nontoxic tracer for rapid tumor detection. J Nucl Med. 1980;21:670–675. [PubMed] [Google Scholar]
- 17.Coleman RE. Single photon emission computed tomography and positron emission tomography in cancer imaging. Cancer. 1991;67:1261–1270. [DOI] [PubMed] [Google Scholar]
- 18.Van der Hoeven JJ, Hoekstra OS, Comans EF, et al. Determinants of diagnostic performance of [F-18]fluorodeoxyglucose positron emission tomography for axillary staging in breast cancer. Ann Surg. 2002;236:619–624. [DOI] [PMC free article] [PubMed] [Google Scholar]
- 19.Strasberg SM, Dehdashti F, Siegel BA, et al. Survival of patients evaluated by FDG-PET before hepatic resection for metastatic colorectal carcinoma: a prospective database study. Ann Surg. 2001;233:293–299. [DOI] [PMC free article] [PubMed] [Google Scholar]
- 20.Hannah A, Scott AM, Tochon-Danguy H, et al. Evaluation of 18 F-fluorodeoxyglucose positron emission tomography with histopathologic correlation in the initial staging of head and neck cancer. Ann Surg. 2002;236:208–217. [DOI] [PMC free article] [PubMed] [Google Scholar]
- 21.Nakata B, Chung YS, Nishimura S, et al. 18F-fluorodeoxyglucose positron emission tomography and the prognosis of patients with pancreatic adenocarcinoma. Cancer. 1997;79:695–699. [PubMed] [Google Scholar]
- 22.Dimitrakopoulou-Strauss A, Strauss LG, Rudi J. PET-FDG as predictor of therapy response in patients with colorectal carcinoma. Q J Nucl Med. 2003;47:8–13. [PubMed] [Google Scholar]
- 23.Oku S, Nakagawa K, Momose T, et al. FDG-PET after radiotherapy is a good prognostic indicator for rectal cancer. Ann Nucl Med. 2002;16:409–416. [DOI] [PubMed] [Google Scholar]
- 24.Ahuja V, Coleman RE, Herndon J, et al. The prognostic significance of fluorodeoxyglucose positron emission tomography imaging for patients with non small cell lung carcinoma. Cancer. 1998;83:918–924. [PubMed] [Google Scholar]
- 25.Halfpenny W, Hain SF, Biassoni L, et al. FDG-PET. A possible prognostic factor in head and neck cancer. Br J Cancer. 2002;86:512–516. [DOI] [PMC free article] [PubMed] [Google Scholar]
- 26.Wong RJ, Lin DT, Schoder H, et al. Diagnostic and prognostic value of [(18)F] fluorodeoxyglucose positron emission tomography for recurrent head and neck squamous cell carcinoma. J Clin Oncol. 2002;20:4199–4208. [DOI] [PubMed] [Google Scholar]
- 27.Kunkel M, Reichert TE, Benz P, et al. Overexpression of Glut-1 and increased glucose metabolism in tumors are associated with a poor prognosis in patients with oral squamous cell carcinoma. Cancer. 2003;97:1015–1024. [DOI] [PubMed] [Google Scholar]
- 28.Eary JF, O'Sullivan F, Powitan Y, et al. Sarcoma tumor FDG uptake measured by PET and patient outcome: a retrospective analysis. Eur J Nucl Med. 2002;29:1149–1154. [DOI] [PubMed] [Google Scholar]
- 29.Weiss SW. WHO Histological Typing of Soft Tissue Tumors, 2nd ed. Berlin: Springer Verlag; 1994:1–86. [Google Scholar]
- 30.Enzinger FM, Weiss SW. Soft Tissue Tumors, ed 3. St. Louis: Mosby; 1995:17–87. [Google Scholar]
- 31.Schwarzbach MHM, Dimitrakopoulou-Strauss A, Willeke F, et al. Clinical value of [18-F] fluorodeoxyglucose positron emission tomography imaging in soft tissue sarcomas. Ann Surg. 2000;231:380–386. [DOI] [PMC free article] [PubMed] [Google Scholar]
- 32.Kontaxakis G, Tzanakos GS, Strauss LG, et al. Characteristics of the local convergence behavior of the iterative ML-EM image reconstruction algorithms. J Nucl Med. 1997;38:202–204. [Google Scholar]
- 33.Burger C, Buck A. Requirements and implementation of a flexible kinetic modelling tool. J Nucl Med. 1997;38:1818–1823. [PubMed] [Google Scholar]
- 34.Ioannidis JP, Lau J. 18F-FDG PET for the diagnosis and grading of soft-tissue sarcoma: a meta-analysis. J Nucl Med. 2003;44:717–724. [PubMed] [Google Scholar]
- 35.Jones DN, McCowage GB, Sostman HD, et al. Monitoring of neoadjuvant therapy response of soft-tissue and musculoskeletal sarcoma using fluorine-18-FDG PET. J Nucl Med. 1996;37:1438–1444. [PubMed] [Google Scholar]
- 36.Young H, Baum R, Cremerius U, et al. Measurements of clinical and subclinical tumor response using [18F]-fluorodeoxyglucose and positron emission tomography: review and 1999 EORTC recommendations. European Organization for Research and Treatment of Cancer (EORTC) PET study group. Eur J Cancer. 1999;35:1773–1782. [DOI] [PubMed] [Google Scholar]
- 37.Dimitrakopoulou-Strauss A, Strauss LG, Schwarzbach M, et al. Dynamic PET F-18-FDG studies in patients with recurrent soft-tissue sarcomas: impact on diagnosis and correlation to grading. J Nucl Med. 2001;42:713–720. [PubMed] [Google Scholar]
- 38.Eary JF, Conrad EU, Bruckner JD, et al. Quantitative [F-18]fluorodeoxyglucose positron emission tomography in pretreatment and grading of sarcoma. Clin Cancer Res. 1998;4:1215–1220. [PubMed] [Google Scholar]
- 39.Bos R, van Der Hoeven JJ, van Der Wall E, et al. Biologic correlates of (18)fluorodeoxyglucose uptake in human breast cancer measured by positron emission tomography. J Clin Oncol. 2002;20:379–387. [DOI] [PubMed] [Google Scholar]
- 40.Buck A, Schirrmeister H, Kuhn T, et al. FDG uptake in breast cancer: correlation with biological and clinical prognostic parameters. Eur J Nucl Med Mol Imaging. 2002;29:1317–1323. [DOI] [PubMed] [Google Scholar]
- 41.Strauss LG, Dimitrakopoulou-Strauss A, Koczan D. Gene chip data and FDG kinetics in tumors [Abstract]. Eur J Nucl Med. 2002;29:S145. [Google Scholar]
- 42.Schwarzbach MHM, Dimitrakopoulou-Strauss A, Mechtersheimer G, et al. Prospective assessment of masses suspicious for liposarcomas by fluorine-18-2-fluoro-2-deoxy-D-glucose (FDG) positron emission tomography (PET). Anticancer Res. 2001;21:3609–3614. [PubMed] [Google Scholar]