Abstract
Summary Background Data:
The purpose of this study was to determine the type of relationship between tumor size and mortality in early breast carcinoma.
Methods:
The data was abstracted from 83,686 cases registered in the Surveillance, Epidemiology, and End Results Program of women diagnosed with primary breast carcinoma between 1988 and 1997 presenting with a T1–T2 lesion and no metastasis in whom axillary node dissection was performed: 58,070 women were node-negative (N0) and 25,616 were node-positive (N+). End point was death from any cause. Tumor size was modeled as a continuous variable by proportional hazards using a generalized additive models procedure.
Results:
Functionally, a Gompertzian expression exp(-exp(-(size-15)/10)) provided a good fit to the effect of tumor size (in millimeters) on mortality, irrespective of nodal status. Quantitatively, for tumor size between 3 and 50 mm, the increase of crude cumulative death rate (number of observed deaths divided by the number of patients at risk) increased with size from 10% to 25% for N0 and from 20% to 40% for N+.
Conclusions:
The functional relationship of tumor size with mortality is concordant with current knowledge of tumor growth. However, its qualitative and quantitative independence of nodal status is in contradiction with the prevailing concept of sequential disease progression from primary tumor to regional nodes. This argues against the perception that nodal metastases are caused by the primary tumor.
To determine the type of relationship between tumor size and mortality in early breast carcinoma, 83,686 cases of women diagnosed with a T1–2, N0–3, M0 primary and registered in the SEER Program were analyzed using a generalized additive models procedure. There is a functional relationship of tumor size with mortality, which is qualitatively and quantitatively independent from the nodal status.
As noted by the College of American Pathologists Consensus Statement in 1999 on prognostic factors in breast cancer, tumor size is one of the most powerful predictors of tumor behavior in breast cancer.1,2 It constitutes the basis of major staging systems3,4; hence, tumor size is incorporated in almost all clinical reports.
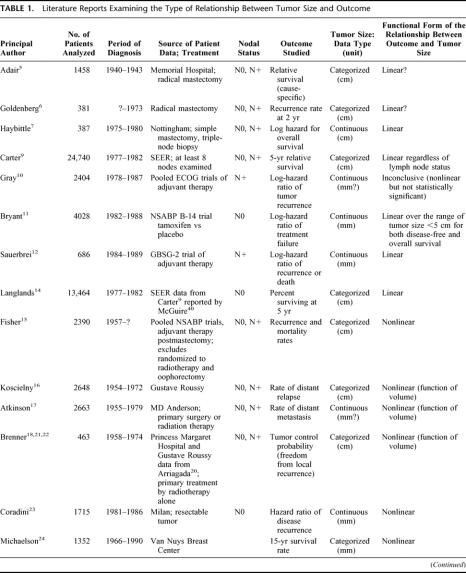
Despite the clinical importance of tumor size, few studies have investigated the functional form linking size to outcome (functional form means a mathematical statement of the relationship between an explanatory variable and a dependent variable). As shown in Table 1, some studies suggested a linear effect of tumor size,5–14 whereas others found a nonlinear effect.15–26 Because of the diversity of end points used to evaluate outcome (local–regional or metastatic recurrence, cause-specific or overall survival, relative or absolute end points), and the complexity of the mathematical expressions, there is no apparent agreement. To add to the confusion, a “linear” relation, as implied by proportional hazards (PH) models, means that the risk is exponentially related to tumor size, but an “exponential-power” expression such as proposed by Michaelson et al24,27 and other authors18,21,22 describes a sigmoidal relationship (nonlinear). The fact that size (generally measured as the largest tumor dimension) is related to volume by a power expression adds to the difficulty in interpreting the studies. The issue is further complicated by concepts of breast cancer disease; it has been argued that tumor size is of little consequence to the fate of the patient,15 or even inconsequential,28 when nodal status is taken into account, ie, implying that tumor size has no intrinsic effect, that its apparent effect as a harbinger of systemic disease disappears when a more potent indicator of systemic disease (lymph node involvement) is present.
TABLE 1. Literature Reports Examining the Type of Relationship Between Tumor Size and Outcome
TABLE 1.(Continued)
The issue of identifying the functional form is more than an academic exercise. For example, if the functional form is sigmoidal, then its representation by a linear form would overestimate the prognostic role of large tumors and underestimate the effect of small tumors, with the consequent risk of recommending inappropriate diagnostic procedures or treatments as a result of over- or under-emphasis placed on tumor size.
In the present study, we investigated the functional form relating tumor size to mortality, taking into account nodal status, by using an extended survival modeling approach.
MATERIALS AND METHODS
The Surveillance, Epidemiology, and End Results (SEER) Program provides extensive cancer incidence data originating from several U.S. registries.29 The “9-registries” database was used for data extraction. Selected patients were women without a history of cancer presenting with a noninflammatory invasive breast carcinoma, histologically confirmed and diagnosed between 1988 and 1997, with specified tumor size no larger than 50 mm (T1 and T2), strictly confined to the breast (involvement of skin, hypodermis, pectoral muscles, and deep fixation were excluded), without distant metastasis, for whom the type of surgery was specified and axillary node dissection was performed. Postoperative radiotherapy was not a selection criterion, but preoperative or intraoperative radiotherapy was excluded. Certain records were rejected because of data-quality concerns30: uncertain sequence of treatment, nonhospital-based data records, month of diagnosis unknown, or race unknown. Further screening of the data excluded cases with more than 50 nodes examined, cases with “0 month” of follow up, and cases with age at diagnosis <25 years or >95 years. Event was defined as death from any cause. Follow-up cutoff date was December 31, 1999.
A Poisson regression approach, adapted from Therneau and Grambsch,31 was used to derive the effect of tumor size as a mathematical function. Briefly, the procedure starts by assuming that the effect of tumor size on the log-hazard of mortality is linear. Tumor size (in millimeters) is incorporated as an untransformed continuous covariate in a PH model. A diagnostic of the PH model is performed using a Poisson regression, which implements the generalized additive models (GAM) procedure of Hastie and Tibshirani.32 The regression results in a nonparametric curve that represents the effect of tumor size. An analysis of variance test of the linearity of the curve is performed. If the linearity test fails, a search is made for mathematical expressions of tumor size (ie, a transform), which approximates the shape of the curve. The whole procedure is repeated using each transform as a covariate replacing tumor size in the initial PH model until the condition of linearity is satisfied.
Other quantitative covariates included in the PH models were: age at diagnosis, number of nodes examined, and year of diagnosis. Qualitative covariates were: registry area, race, marital status, tumor topography, histologic type and grade, estrogen and progesterone receptor status, type of primary surgery, and administration of postoperative radiotherapy. All qualitative variables were converted or expanded as needed to dummy variables to allow coding using binary indicators, eg, “married” versus “not married,” “high grade” versus “not high grade,” and so on. Verification of the covariates found departures from the PH assumption as might be expected,33 but there was no notable impact on the results when alternative categorizations or subset analyses were performed. A first-order interaction between type of surgery and postoperative radiotherapy (variable built by multiplying the 2 binary indicators) was included for consistency with a previous analysis.30
A comparison with a more direct representation of mortality was performed using crude death rate, defined as the number of observed deaths at the follow-up cutoff date divided by the number of patients at risk.
Node-positive cases were not considered until all these analyses were performed in node-negative cases,34 providing the opportunity of a validation set. The mathematical expression found with node-negative cases was used in a PH analysis of the node-positive cases. The appropriateness of the transform was verified by the linearity test in this validation set.
All statistical analyses were performed using Splus (Insightful Corp., Seattle, WA) statistical software. The search for mathematical expressions representing the shapes of curves used a dictionary of curves provided by TableCurve 2D (Systat Software Inc., Richmond, CA).
RESULTS
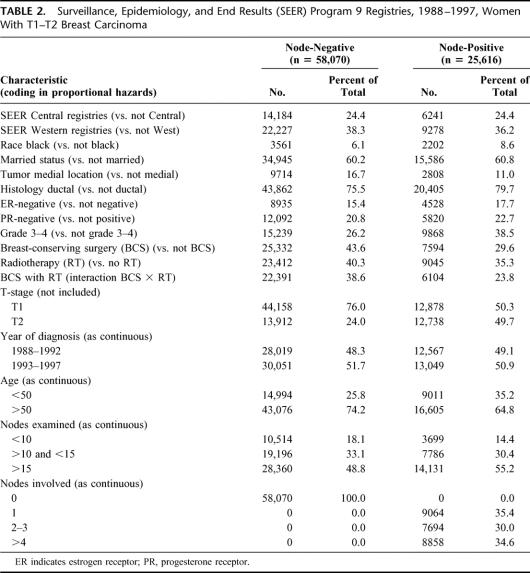
In the 2002 SEER release,29 188,410 women were diagnosed with a breast tumor from 1988 to 1997, of whom 132,457 had a hospital-based diagnosis of unilateral invasive carcinoma microscopically confirmed by a positive histology. A total of 83,686 cases matched the selection criteria, 58,070 were node-negative and 25,616 node-positive. The median follow up was 73 months (range, 1–143 months) for patients still alive at the follow-up cutoff date (December 31, 1999). Table 2 shows the characteristics of patients as a function of their nodal status. Figure 1 shows the distribution of tumor size measurements. Almost all qualitative and quantitative covariates included in the PH analyses were highly significant (supplemental material TableCharact.xls).
TABLE 2. Surveillance, Epidemiology, and End Results (SEER) Program 9 Registries, 1988–1997, Women With T1–T2 Breast Carcinoma
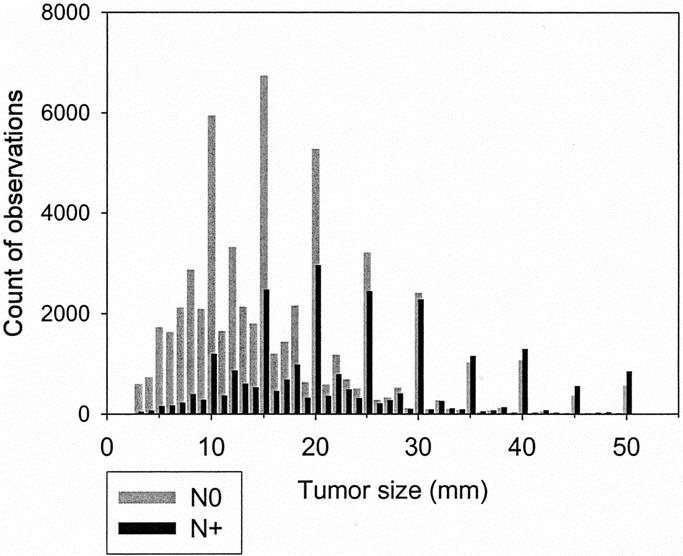
FIGURE 1. Frequency of tumor size measurements. Gray: node-negative (N0). Black: node-positive (N+).
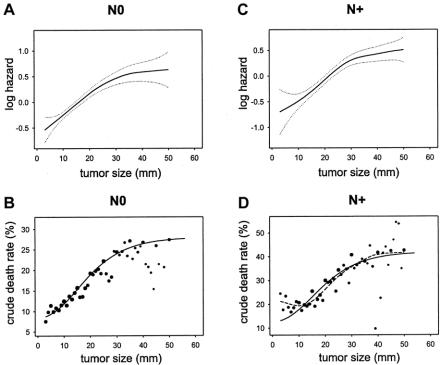
The PH analysis performed in node-negative cases showed a mortality hazard ratio of 1.027 (95% confidence interval, 1.025–1.029) for a difference in tumor size of 1 mm. The GAM procedure showed a nonlinear effect of tumor size on the log-hazard of mortality (Fig. 2A). The test for nonlinearity was statistically significant (chi-square = 72.57, 3 degrees of freedom, P <0.0001). Several generic functions provided a good fit – fractional polynomial, logistic, lognormal, gompertzian. A good fit was also obtained with Michaelson's exponential power.24,27 However, the gompertzian was found to be the most flexible without requiring excessive precision and a double exponential was selected to express the functional form (size in millimeters):
FIGURE 2. Similarity of the effect of tumor size on mortality in node-negative (N0, left graphs) and node-positive (N+, right graphs) shown by multivariate modeling (top graphs) and by crude death rates (bottom graphs). (A) Functional form of the effect of tumor size on the log-hazard of mortality based on GAM modeling in node-negative (N0) cases, with 95% confidence intervals (dotted curves). (B) Crude death rates in function of tumor size, N0 cases. Dot size represents a log10 function of the number of cases; small dots are <100 cases; larger dots represent up to 7000 cases (see Fig. 1). Plain curve: plot of the scaled function exp(–exp(–(size–15)/10)). (C) Functional form based on GAM modeling in node-positive (N+) cases. (D) Crude death rates in function of tumor size in N+. Dot size based on log10 function of the number of cases; small dots are <100 cases; larger dots represent up to 3000 cases (see Fig. 1). Plain curve: plot of the scaled function exp(–exp(–(size–15)/10)). Dashed curve: spline smoothing of the crude death rate data points.
The test of linearity for PH using the transform was satisfied (chi-square = 3.82, 3 degrees of freedom, P = 0.280, ie, nonsignificant nonlinearity). The PH model was marginally improved (sum of squares of deviance residuals reduced from 43,541 to 43,488). The significance and hazard ratios of other covariates were unaffected.
The tumor size transform was scaled and drawn onto a plot of the crude death rates (Fig. 2B). The graph shows a good concordance with the GAM plot (Fig. 2A). The dispersion of the data points is concordant with the confidence intervals of the GAM plot.
Next, a PH analysis was performed in node-positive cases. The effect of tumor size appeared similar to that of node-negative cases (Fig. 2C). The hazard ratio for tumor size was 1.021 (1.018–1.023). The nonlinearity was statistically significant (chi-square = 85.13, 3 degrees of freedom, P <0.0001). The transform derived from node-negative cases was used as a plug-in covariate replacing size in the PH analysis of node-positive cases. It satisfied the test of linearity (chi-square = 6.97, 3 degrees of freedom, P = 0.070, ie, nonsignificant nonlinearity).
As done for node-negative cases, the size transform was plotted onto the graph of crude death rates of patients with positive nodes (Fig. 2D). It shows that the overall shapes are similar. A nonparametric spline smoothed curve of the death rates is superimposed in the same graph as a dashed curve. (The smoothed curve is similar to a moving average: it provides a visual indication of how much the size-transform differs from the average death rates.) The concordance was also good, except a small mismatch for tumor sizes less than 10 mm. The slopes corresponding to the 2 curves (Fig. 2B, D) are shown in Figure 3. Figure 3 shows the similarity of the global shape of the slopes while highlighting the differences. The peaks indicate where the maximal change of slope occurs. The plain curve, which is derived from modeling the node-negative cases, suggests that the transition occurs around 15 mm. The dashed curve, which is derived from smoothing the death rates of patients with positive nodes, suggests that the transition occurs around 20 mm. The irregularities of the dashed slope at larger tumor sizes appear attributable to the lack of precision of the data points at large size measurement. The small dashed inflection at smaller tumor sizes suggests a secondary peak of increased death rate for very small node-positive tumors.
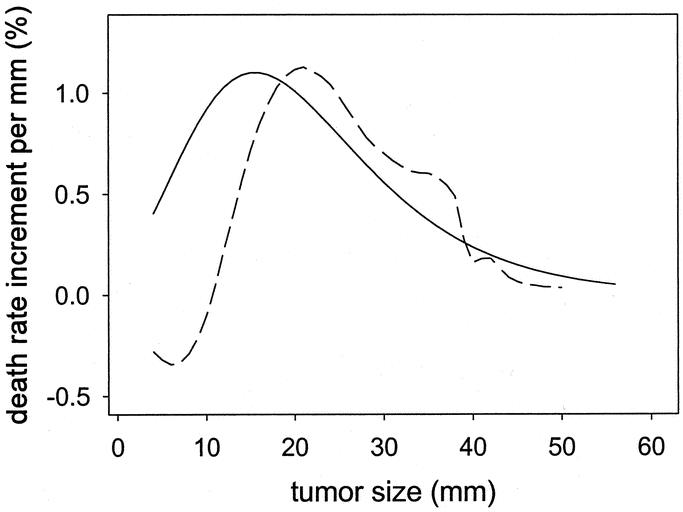
FIGURE 3. Relative increase in risk of death for each 1-mm increment in tumor size. Plain curve: Plot of the slope of the scaled function exp(–exp(–(size–15)/10)) based on modeling in node-negative cases. Dashed curve: Plot of the slope of the smoothed crude death rates observed in node-positive cases.
DISCUSSION
The results of the log-hazard analysis show that patients with node-negative breast cancer have a linear increase of mortality with tumor size up to approximately 30 mm. The mortality risk plateaus beyond 30 to 50 mm (Fig. 2). The relationship was modeled as a gompertzian double exponential function (Fig. 4). The function was validated by finding an almost identical relationship in patients who had positive nodes (Fig. 3).
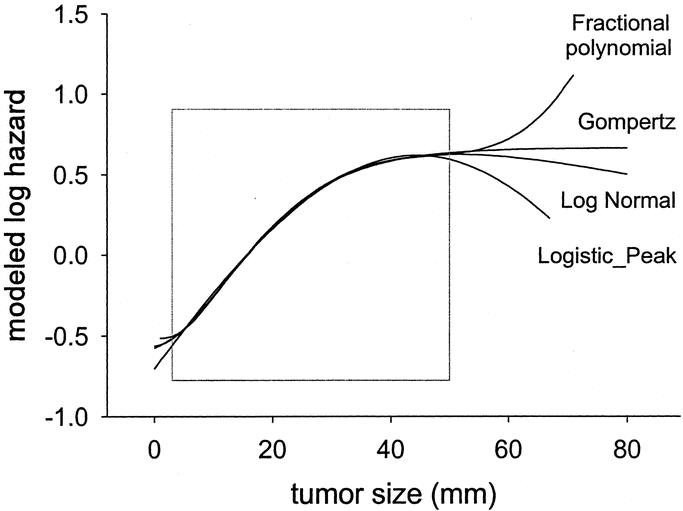
FIGURE 4. Selected nonlinear functions that provided an almost identical fit to the functional form of tumor size within the range of data 3 to 50 mm (square).
There is no doubt that the selection of cases might have excluded high-risk patients. Patients with a more aggressive tumor would already have died or developed clinical metastases and therefore would have been excluded. However, because cases presenting at diagnosis with large tumors or with macroscopic metastases are much less frequent, it is unlikely that such a selection can be sufficient to explain the observed functional form of tumor size. Furthermore, the interpretation of a plateau in mortality risk as meaning “less aggressive tumor” is not a correct assumption. The data was also limited to registered cases for whom complete records were available. Results cannot be considered as representative of the whole population. Data on tumor size were used in this analysis without verification of the pathologic examination. Errors might have resulted from difficulties of determining tumor extension, from interobserver variations, or from transcription mistakes. The spikes in Figure 1 show that rounding occurred. Other limitations such as the lack of data on systemic treatment that might have influenced survival outcome have been mentioned in detail elsewhere.35
The GAM procedure allowed a multivariate analysis, which examined the deviation from the PH assumption and searched for the amount of correction that was required to fulfill the PH requirement. Crude death rates were used to complement the GAM analysis. Although crude death rates do not take into account the length of follow up and may be biased indicators of outcome, they appeared concordant with the results of the GAM modeling and remained immediately understandable.
We selected a gompertzian function to represent the functional form of tumor size, not because this model was more valid than any other, but for pragmatic reasons. One reason was the link to cytokinetics models.36,37 The second reason was the ease of interpretation. In the expression exp(–exp(–(size–15)/10)), representing a sigmoid, the value “15 mm” corresponds to the transition from an “accelerating” to a “decelerating” growth (Fig. 3). A third reason was the consideration that the precision of the parameters should not exceed the precision of size measurements (Fig. 1).
A summary of the literature that modeled tumor size or reported at least 5 data points is presented in Table 1. The shape of the effect of tumor size on survival found in our study is comparable to the shape of nonlinear models that have been reported. For example, the expression (size in mm)
derived from the Michaelson's model,24 (also representative of a family of tumor control probability models18,21,22), gave an almost perfect fit in patients with negative nodes. Hence, there was no obvious “best” function. Figure 4 shows a selection of functions that appropriately described the shape within the data range of 3 to 50 mm.
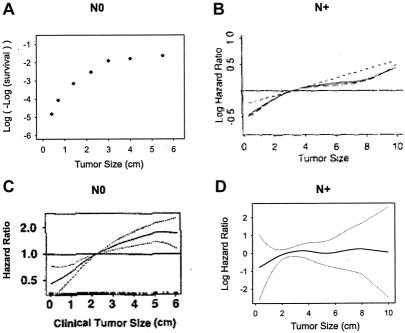
Among the studies that reported a linear effect, 4 are of particular importance. One because it is the largest and also uses the SEER data9; the 3 others because the data is collected from prospective clinical trials and analyzed with modern statistical tools.10–12 For the SEER study, node-negative cases were selected because this subset has been widely used by other authors38–40 and has served as the basis of a linear model.14 Figure 5A displays the original paper's survival graph,9 converted to mortality log-hazards by log(-log(survival)).41 Figures 5B and 5C display the functional form of tumor size from the ECOG trials (node-positive)10 and the NSABP B-14 trial (node-negative),11 respectively. Figure 5D displays the output of GAM modeling using Sauerbrei and Royston data from a GBSG trial (node-positive).12 Thus, although we classified the studies as indicating a linear relationship, the shapes shown by comparable methods are similar to the one we describe in Figure 2. Despite different outcomes, various measurement scales, heterogeneous selection of patients, and diverse mathematical expressions, all studies show a profound unity, which points to the same nonlinear functional form.
FIGURE 5. Graphs from the literature data showing the similarity of the functional form of tumor size for different outcomes in node-negative (N0) and in node-positive (N+). (A) Cumulative relative-mortality hazard in N0, adapted from Carter.9 (B) Log-hazard ratio of recurrence in N+, reprinted from Gray,10 with permission of the author and the American Statistical Association. (C) Hazard ratio of treatment failure (local, regional, or distant recurrence, or second primary tumor) in N0, reprinted from Bryant,11 with permission of the author and Kluwer Academic Publishers. (D) Log-hazard ratio of recurrence or death in N+. Functional form for tumor size based on the GBSG-2 data, from Willi Sauerbrei.13
Cell kinetics studies have shown that, in general, tumor growth is constrained after an initial exponential phase, although some controversy exists over what type of function best represents that pattern, gompertzian36,42 or nongompertzian.43,44 Tumors have a tendency to exhibit a growth slowdown.45 Factors slowing down tumor growth after an initial exponential phase include epigenetic modifications, aberrant genetics,46–51 and interaction with the microenvironment52–56 including hypoxia.57–61
This short list of mechanisms suggests an extreme biologic heterogeneity within tumors, within hosts, and between patients. Therefore, it is unlikely that an aggregate functional form such as derived from the SEER data can represent any single individual tumor growth pattern. Nevertheless, the observed relationship between tumor size and mortality, which ends in a plateau, is concordant with the biologic mechanisms of tumor growth. However, a slow down in tumor growth does not mean that cancer cells become less aggressive, for example, cells that survive hypoxia are also the most resistant to treatments.58–60
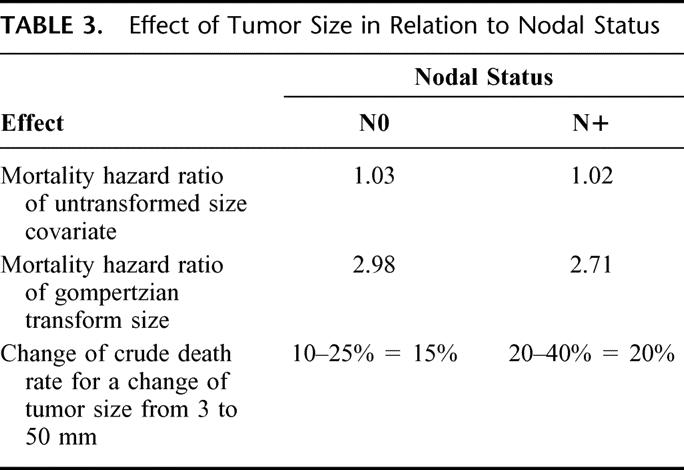
Axillary lymph node status has repeatedly been shown to be the single most important predictor of disease-free survival and overall survival.1,62 Nodal involvement may be an indicator of metastatic disease, the cause of death of patients with breast cancer.63 Hence, the generally admitted conclusion is that tumor size loses its prognostic role in cases of nodal involvement. The finding of an almost identical effect of tumor size, both qualitatively (functional form) and quantitatively (by hazard ratios of untransformed size covariate, gompertzian transform, and change of crude death rate for a change of tumor size from 3–50 mm), was unexpected (Table 3). Nodal positivity caused a dramatic shift in the prognosis, but tumor size maintained its effect on mortality (Fig. 2). In other words, although prognosis is worse for node-positive patients, curves of tumor size versus mortality remain parallel.
TABLE 3. Effect of Tumor Size in Relation to Nodal Status
These results suggest different processes through which tumor size and nodal status affect the risk of death. This is in contradiction with what should have been expected from a Halstedian paradigm of sequential progression from primary tumor to nodal metastasis, but fits the concept of breast cancer as a systemic disease,64 in which the effect of tumor size represents the phenotypic manifestation of tumor growth, whereas the effect of nodal involvement represents the phenotypic manifestation of metastasis. The impact of local tumor growth is in keeping with a recent pooled analysis that found a survival advantage when radiation was delivered to the breast after breast-conserving surgery.65
In summary, this study on a large population database suggests that the functional form of the effect of tumor size on all-cause mortality might be represented by a gompertzian type of function. It highlights that, on average, each millimeter increment in size is associated with a considerable relative increase in mortality for smaller tumors than for larger tumors (Fig. 3). Although the time scale for successive measurements of tumor size is missing in the present analyses, which thereby do not allow extrapolation to growth rates, the consistency of our results with the literature argues for the importance of screening and early intervention. The study further finds that node-positive status does not abate the effect of tumor size. This finding emphasizes the need for a dual approach in the management of breast cancer that has to consider both processes of metastasis and tumor growth.
ACKNOWLEDGMENTS
The authors thank Dirk Van Den Berge, Donald Promish, Guy Soete, Hung Van Le, and Jan Van de Steene for the encouraging comments during the design of the study. Much of the present work owes to Tomasz Burzykowski who stimulated discussions and introduced the authors to different methods of extended survival analysis. Figure 5B was reproduced with permission from the American Statistical Association and Robert J. Gray. Figure 5C was reproduced with permission from Kluwer Academic/Plenum Publishers and John Bryant. The authors also thank Willi Sauerbrei for the availability of the GBSG-2 data.
Footnotes
Gábor Cserni was supported by a János Bolyai Research Fellowship from the Hungarian Academy of Sciences. Richard Gordon was supported in part by a grant from Friends You Can Count On.
Presented at the 4th European Breast Cancer Conference, Hamburg, March 16–20, 2004 (VVH, GS).
Reprints: Claire Verschraegen, MD, The University of New Mexico, Cancer Research and Treatment Center, 900 Camino de Salud, Albuquerque, NM 87131. E-mail: cverschraegen@salud.unm.edu.
REFERENCES
- 1.Fitzgibbons PL, Page DL, Weaver D, et al. Prognostic factors in breast cancer. College of American Pathologists Consensus Statement 1999. Arch Pathol Lab Med. 2000;124:966–978. [DOI] [PubMed] [Google Scholar]
- 2.Mirza AN, Mirza NQ, Vlastos G, et al. Prognostic factors in node-negative breast cancer: a review of studies with sample size more than 200 and follow-up more than 5 years. Ann Surg. 2002;235:10–26. [DOI] [PMC free article] [PubMed] [Google Scholar]
- 3.Greene FL, Page DL, Fleming ID, et al. AJCC Cancer Staging Handbook. TNM Classification of Malignant Tumors, 6th ed. New York: Springer Verlag; 2002. [Google Scholar]
- 4.Sobin LH, Wittekind CH, eds. TNM Classification of Malignant Tumours, 6th ed. New York: John Wiley & Sons; 2002. [Google Scholar]
- 5.Adair F, Berg J, Joubert L, et al. Long-term followup of breast cancer patients: the 30-year report. Cancer. 1974;33:1145–1150. [DOI] [PubMed] [Google Scholar]
- 6.Goldenberg IS, Carter AC, Friedell GH, et al. Identification of breast cancer patients with high risk of early recurrence after radical mastectomy. II. Clinical and pathological correlations. A report of the Primary Therapy of Breast Cancer Study Group. Cancer. 1978;42:2809–2826. [DOI] [PubMed] [Google Scholar]
- 7.Haybittle JL, Blamey RW, Elston CW, et al. A prognostic index in primary breast cancer. Br J Cancer. 1982;45:361–366. [DOI] [PMC free article] [PubMed] [Google Scholar]
- 8.Todd JH, Dowle C, Williams MR, et al. Confirmation of a prognostic index in primary breast cancer. Br J Cancer. 1987;56:489–492. [DOI] [PMC free article] [PubMed] [Google Scholar]
- 9.Carter CL, Allen C, Henson DE. Relation of tumor size, lymph node status, and survival in 24,740 breast cancer cases. Cancer. 1989;63:181–187. [DOI] [PubMed] [Google Scholar]
- 10.Gray RJ. Flexible methods for analyzing survival data using splines, with application to breast cancer prognosis. J Am Stat Assoc. 1992;87:942–951. [Google Scholar]
- 11.Bryant J, Fisher B, Gunduz N, et al. S-phase fraction combined with other patient and tumor characteristics for the prognosis of node-negative, estrogen-receptor-positive breast cancer. Breast Cancer Res Treat. 1998;51:239–253. [DOI] [PubMed] [Google Scholar]
- 12.Sauerbrei W, Royston P, Bojar H, et al. Modelling the effects of standard prognostic factors in node-positive breast cancer. German Breast Cancer Study Group (GBSG). Br J Cancer. 1999;79:1752–1760. [DOI] [PMC free article] [PubMed] [Google Scholar]
- 13.Sauerbrei W, Royston P. Building multivariable prognostic and diagnostic models: transformation of the predictors by using fractional polynomials. J R Stat Soc [Ser A]. 1999;162:71–94. [Google Scholar]
- 14.Langlands AO, Gebski V, Hirsch D, et al. Delay in the clinical diagnosis of breast cancer: estimating its effect on prognosis, with particular reference to medical litigation. Breast. 2002;11:386–393. [DOI] [PubMed] [Google Scholar]
- 15.Fisher B, Slack NH, Bross ID. Cancer of the breast: size of neoplasm and prognosis. Cancer. 1969;24:1071–1080. [DOI] [PubMed] [Google Scholar]
- 16.Koscielny S, Tubiana M, Le MG, et al. Breast cancer: relationship between the size of the primary tumour and the probability of metastatic dissemination. Br J Cancer. 1984;49:709–715. [DOI] [PMC free article] [PubMed] [Google Scholar]
- 17.Atkinson EN, Brown BW, Montague ED. Tumor volume, nodal status, and metastasis in breast cancer in women. J Natl Cancer Inst. 1986;76:171–178. [PubMed] [Google Scholar]
- 18.Brenner DJ. Dose, volume, and tumor-control predictions in radiotherapy. Int J Radiat Oncol Biol Phys. 1993;26:171–179. [DOI] [PubMed] [Google Scholar]
- 19.Sivaramakrishna R, Gordon R. Detection of breast cancer at a smaller size can reduce the likelihood of metastatic spread: a quantitative analysis. Acad Radiol. 1997;4:8–12. [DOI] [PubMed] [Google Scholar]
- 20.Arriagada R, Mouriesse H, Sarrazin D, et al. Radiotherapy alone in breast cancer. I. Analysis of tumor parameters, tumor dose and local control: the experience of the Gustave-Roussy Institute and the Princess Margaret Hospital. Int J Radiat Oncol Biol Phys. 1985;11:1751–1757. [DOI] [PubMed] [Google Scholar]
- 21.Dubben HH, Thames HD, Beck-Bornholdt HP. Tumor volume: a basic and specific response predictor in radiotherapy. Radiother Oncol. 1998;47:167–174. [DOI] [PubMed] [Google Scholar]
- 22.Buffa FM, Fenwick JD, Nahum AE. An analysis of the relationship between radiosensitivity and volume effects in tumor control probability modeling. Med Phys. 2000;27:1258–1265. [DOI] [PubMed] [Google Scholar]
- 23.Coradini D, Daidone MG, Boracchi P, et al. Time-dependent relevance of steroid receptors in breast cancer. J Clin Oncol. 2000;18:2702–2709. [DOI] [PubMed] [Google Scholar]
- 24.Michaelson JS, Silverstein M, Wyatt J, et al. Predicting the survival of patients with breast carcinoma using tumor size. Cancer. 2002;95:713–723. [DOI] [PubMed] [Google Scholar]
- 25.Sauerbrei W, Schumacher M, Cuzick J, et al. Prognostic factors determine groups with different prognoses in pre- and perimenopausal women with estrogen receptor-positive, node-positive breast cancer treated with goserelin (ZoladexR) or CMF—results from the ZEBRA study. Abstract 509. Breast Cancer Res Treat. 2003;82(suppl 1):S121. [Google Scholar]
- 26.Jonat W, Kaufmann M, Sauerbrei W, et al. Goserelin versus cyclophosphamide, methotrexate, and fluorouracil as adjuvant therapy in premenopausal patients with node-positive breast cancer: The Zoladex Early Breast Cancer Research Association Study. J Clin Oncol. 2002;20:4628–4635. [DOI] [PubMed] [Google Scholar]
- 27.Michaelson JS, Silverstein M, Sgroi D, et al. The effect of tumor size and lymph node status on breast carcinoma lethality. Cancer. 2003;98:2133–2143. [DOI] [PubMed] [Google Scholar]
- 28.Beenken SW, Urist MM, Zhang Y, et al. Axillary lymph node status, but not tumor size, predicts locoregional recurrence and overall survival after mastectomy for breast cancer. Ann Surg. 2003;237:732–738. [DOI] [PMC free article] [PubMed] [Google Scholar]
- 29.National Cancer Institute. Surveillance, Epidemiology, and End Results (SEER) Program Public-Use Data (1973–1999), National Cancer Institute, DCCPS, Surveillance Research Program, Cancer Statistics Branch, released April 2002, based on the November 2001 submission. 2002. Available at: [http://seer.cancer.gov].
- 30.Vinh-Hung V, Burzykowski T, Van de Steene J, et al. Post-surgery radiation in early breast cancer: survival analysis of registry data. Radiother Oncol. 2002;64:281–290. [DOI] [PubMed] [Google Scholar]
- 31.Therneau TM, Grambsch PM. Modeling Survival Data: Extending the Cox Model. New York: Springer-Verlag; 2000. [Google Scholar]
- 32.Hastie T, Tibshirani R. Generalized Additive Models. New York: Chapman and Hall; 1990. [Google Scholar]
- 33.Hilsenbeck SG, Ravdin PM, de Moor CA, et al. Time-dependence of hazard ratios for prognostic factors in primary breast cancer. Breast Cancer Res Treat. 1998;52:227–237. [DOI] [PubMed] [Google Scholar]
- 34.Vinh-Hung V, Van Den Berge D, Van de Steene J, et al. Functional form of tumor size and other quantitative variables in T1–T2 node negative breast cancer. Abstract No 3611. Proc Am Soc Clin Oncol. 2003;22:898. [Google Scholar]
- 35.Vinh-Hung V, Voordeckers M, Van de Steene J, et al. Omission of radiotherapy after breast-conserving surgery: survival impact and time trends. Radiother Oncol. 2003;67:147–158. [DOI] [PubMed] [Google Scholar]
- 36.Gilewski TA, Dang C, Surbone A, et al. Section 13, Principles of chemotherapy: Chapter 38, Cytokinetics. In: Bast RC Jr, Kufe DW, Pollock RE, et al., eds. Holland-Frei Cancer Medicine, 5th ed. Hamilton, Ontario: BC Decker Inc; 2000:511–538. [Google Scholar]
- 37.Clare SE, Nakhlis F, Panetta JC. Molecular biology of breast cancer metastasis. The use of mathematical models to determine relapse and to predict response to chemotherapy in breast cancer. Breast Cancer Res. 2000;2:430–435. [DOI] [PMC free article] [PubMed] [Google Scholar]
- 38.McGuire WL, Tandon AK, Allred DC, et al. Prognosis and treatment decisions in patients with breast cancer without axillary node involvement. Cancer. 1992;70:1775–1781. [DOI] [PubMed] [Google Scholar]
- 39.McGuire WL, Clark GM. Prognostic factors and treatment decisions in axillary-node-negative breast cancer. N Engl J Med. 1992;326:1756–1761. [DOI] [PubMed] [Google Scholar]
- 40.McGuire WL, Tandon AK, Allred DC, et al. Treatment decisions in axillary node-negative breast cancer patients. J Natl Cancer Inst Monogr. 1992;11:173–180. [PubMed] [Google Scholar]
- 41.Clark TG, Bradburn MJ, Love SB, et al. Survival analysis part I: basic concepts and first analyses. Br J Cancer. 2003;89:232–238. [DOI] [PMC free article] [PubMed] [Google Scholar]
- 42.Norton L. A Gompertzian model of human breast cancer growth. Cancer Res. 1988;48:7067–7071. [PubMed] [Google Scholar]
- 43.Speer JF, Petrosky VE, Retsky MW, et al. A stochastic numerical model of breast cancer growth that simulates clinical data. Cancer Res. 1984;44:4124–4130. [PubMed] [Google Scholar]
- 44.Retsky MW, Swartzendruber DE, Wardwell RH, et al. Is Gompertzian or exponential kinetics a valid description of individual human cancer growth? Med Hypotheses. 1990;33:95–106. [DOI] [PubMed] [Google Scholar]
- 45.Hahnfeldt P, Panigrahy D, Folkman J, et al. Tumor development under angiogenic signaling: a dynamical theory of tumor growth, treatment response, and postvascular dormancy. Cancer Res. 1999;59:4770–4775. [PubMed] [Google Scholar]
- 46.Sato T, Akiyama F, Sakamoto G, et al. Accumulation of genetic alterations and progression of primary breast cancer. Cancer Res. 1991;51:5794–5799. [PubMed] [Google Scholar]
- 47.Dairkee SH, Smith HS. Genetic analysis of breast cancer progression. J Mammary Gland Biol Neoplasia. 1996;1:139–151. [DOI] [PubMed] [Google Scholar]
- 48.Hampl M, Hampl JA, Schwarz P, et al. Accumulation of genetic alterations in brain metastases of sporadic breast carcinomas is associated with reduced survival after metastasis. Invasion Metastasis. 1998;18:81–95. [DOI] [PubMed] [Google Scholar]
- 49.Tomlinson IP. Mutations in normal breast tissue and breast tumours. Breast Cancer Res. 2001;3:299–303. [DOI] [PMC free article] [PubMed] [Google Scholar]
- 50.Bertucci F, Viens P, Hingamp P, et al. Breast cancer revisited using DNA array-based gene expression profiling. Int J Cancer. 2003;103:565–571. [DOI] [PubMed] [Google Scholar]
- 51.Frigyesi A, Gisselsson D, Mitelman F, et al. Power law distribution of chromosome aberrations in cancer. Cancer Res. 2003;63:7094–7097. [PubMed] [Google Scholar]
- 52.Ben Baruch A. Host microenvironment in breast cancer development: inflammatory cells, cytokines and chemokines in breast cancer progression: reciprocal tumor-microenvironment interactions. Breast Cancer Res. 2003;5:31–36. [DOI] [PMC free article] [PubMed] [Google Scholar]
- 53.Neumark E, Sagi-Assif O, Shalmon B, et al. Progression of mouse mammary tumors: MCP-1-TNFalpha cross-regulatory pathway and clonal expression of promalignancy and antimalignancy factors. Int J Cancer. 2003;106:879–886. [DOI] [PubMed] [Google Scholar]
- 54.Schor SL, Schor AM. Phenotypic and genetic alterations in mammary stroma: implications for tumour progression. Breast Cancer Res. 2001;3:373–379. [DOI] [PMC free article] [PubMed] [Google Scholar]
- 55.Shekhar MP, Werdell J, Santner SJ, et al. Breast stroma plays a dominant regulatory role in breast epithelial growth and differentiation: implications for tumor development and progression. Cancer Res. 2001;61:1320–1326. [PubMed] [Google Scholar]
- 56.Shekhar MP, Pauley R, Heppner G. Host microenvironment in breast cancer development: extracellular matrix-stromal cell contribution to neoplastic phenotype of epithelial cells in the breast. Breast Cancer Res. 2003;5:130–135. [DOI] [PMC free article] [PubMed] [Google Scholar]
- 57.Hohenberger P, Felgner C, Haensch W, et al. Tumor oxygenation correlates with molecular growth determinants in breast cancer. Breast Cancer Res Treat. 1998;48:97–106. [DOI] [PubMed] [Google Scholar]
- 58.Hockel M, Vaupel P. Biological consequences of tumor hypoxia. Semin Oncol. 2001;28:36–41. [PubMed] [Google Scholar]
- 59.Knowles HJ, Harris AL. Hypoxia and oxidative stress in breast cancer. Hypoxia and tumourigenesis. Breast Cancer Res. 2001;3:318–322. [DOI] [PMC free article] [PubMed] [Google Scholar]
- 60.Boudreau N, Myers C. Breast cancer-induced angiogenesis: multiple mechanisms and the role of the microenvironment. Breast Cancer Res. 2003;5:140–146. [DOI] [PMC free article] [PubMed] [Google Scholar]
- 61.Wouters BG, Koritzinsky M, Chiu RK, et al. Modulation of cell death in the tumor microenvironment. Semin Radiat Oncol. 2003;13:31–41. [DOI] [PubMed] [Google Scholar]
- 62.Cserni G. Axillary staging of breast cancer and the sentinel node. J Clin Pathol. 2000;53:733–741. [DOI] [PMC free article] [PubMed] [Google Scholar]
- 63.Nicolson GL. Breast cancer metastasis-associated genes: role in tumour progression to the metastatic state. Biochem Soc Symp. 1998;63:231–243. [PubMed] [Google Scholar]
- 64.Fisher B. From Halsted to prevention and beyond: advances in the management of breast cancer during the twentieth century. Eur J Cancer. 1999;35:1963–1973. [DOI] [PubMed] [Google Scholar]
- 65.Vinh-Hung V, Verschraegen C. Breast-conserving surgery with or without radiotherapy: pooled-analysis for risks of ipsilateral breast tumor recurrence and mortality. J Natl Cancer Inst. 2004. In press. [DOI] [PubMed]


