Abstract
Objective:
The purpose of this study was to identify gene-expression changes in leg muscle for up to 24 months after a severe thermal injury.
Summary Background Data:
Hypermetabolism associated with severe burns was thought to cease with wound healing and closure. It has been recently shown that hypermetabolism does not completely resolve after healing, and muscle catabolism continues after hospital discharge; however, just how long after discharge has not been established.
Methods:
Six children, admitted to our hospital within 1 week after injury, were studied. Patients ranged in age from 3 to 18 years, with flame or scald burns covering more than 40% of their body surface area. At 1.5, 6, 12, 18, and 24 months postburn, a biopsy of the vastus lateralis muscle was taken and snap frozen at −80°C. Total RNA was isolated and in vitro transcribed and hybridized to HG-U95 Av.2 Affymetrix arrays. The images were scanned and analyzed using Affymetrix GeneChip Analysis Suite 5.2 and dChip programs. Using 1 to 7 days after injury as baseline, comparisons were made of expression profiles at the various time intervals after injury.
Results:
When comparisons are made to nonburned children, 38 genes were significantly altered at 1.5 months, 10 genes remained altered at 6 months, 4 remained altered at 12 months, and 2 at 18 months. No differences could be shown at 24 months. Western blot analysis of β-2 microglobulin and myosin light chain was used to corroborate the microarray data.
Conclusions:
Gene changes can be identified for up to 18 months after burn but not at 24 months. These gene changes may provide information concerning what genes in skeletal muscle contribute to recovery from burn trauma.
The hypermetabolism related to a severe thermal injury does not completely resolve after the cutaneous wound has healed but continues long after. Changes in the gene expression pattern of the vastus lateralis muscle from burned children, 3 to 18 years of age, could be identified up to 18 months postburn but not at 24 months.
Increased energy expenditure and substrate release from protein and fat stores are both characteristic of the hypermetabolic response to large severe burns. In severe trauma, there is an increase in protein catabolism with a loss of lean muscle mass.1,2 Hypermetabolism associated with severe burns was thought to end with wound closure;3,4 however, as more children survived severe burns, the long-term complications of the hypermetabolic response become apparent. It has been shown that hypermetabolism does not resolve after burn wound healing, but muscle catabolism continues for nearly 9 months or more5 and growth arrest for 2 years.6 These delays in muscle growth and strength occur at a critical time in burn recovery and severely prolong rehabilitation and the reentry back into society as a productive citizen.
The purpose of this study was to identify changes in gene expression patterns in skeletal muscle at different times after a severe thermal injury. The identification of changes in gene expression patterns may lead to new therapies, which ameliorate prolonged muscle catabolism and growth arrest.
METHODS
Study Subjects
Six children, admitted to our hospital within 1 week after injury, were studied. These patients ranged in age from 3 to 18 years, with flame or scald burns covering more than 40% of their total body surface area. Six cleft-lip and cleft-palate patients between 3 and 18 years of age admitted to our hospital for reconstructive surgery were used as nonburned normal controls. Those with other severe injuries, not related to the burn or preexisting conditions such as asthma or pneumonia, were excluded.
All subjects received standard burn care as previously described.7 Each patient underwent wound excision and grafting with skin autografts and allografts within 72 hours of admission. Sequential grafting procedures were performed over time until the wounds were 95% healed. Enteral nutrition was started at admission and continued until the wounds were 95% healed. Patients were fed a commercial enteral formula (Vivonex T.E.N.; Sandoz Nutritional, Minneapolis, MN) through a nasoduodenal tube. The daily caloric intake was calculated to deliver 1500 kcal per square meter of body-surface area burned plus 1500 kcal per square meter of total body surface area. Patients remained in bed for 5 days after each excision and grafting procedure and then were allowed daily walks. All patients were administered antianxiety medication after the first week postburn. Biopsy of the vastus lateralis muscle was taken during the first 1 to 7 days and 1.5, 6, 12, 18, and 24 months postburn. Biopsies were snap frozen at −80°C for microarray and Western blot analysis (Fig. 1).
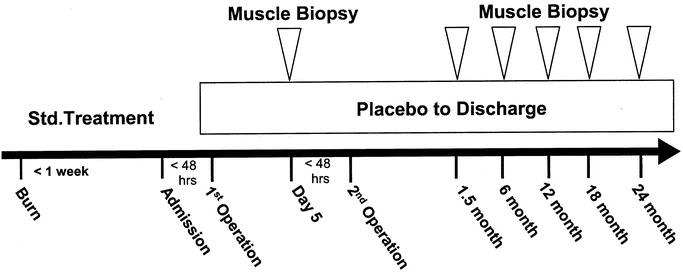
FIGURE 1. Study protocol for burned children admitted within 7 days after burn. Initial baseline studies were conducted 5 days after the first operation to replace burn tissue with donor-site or cadaver skin. Muscle biopsies were taken at the indicated time points.
RNA Extraction
For microarray analysis, we used sequential muscle biopsies collected from 6 patients. Total RNA was isolated from muscle biopsies by acid guanidinium thiocyanate–phenol-chloroform extraction using TRI reagent (Molecular Research Center Inc., Cincinnati, OH). This method was based on the single-step method of RNA isolation described by Chomcyzynski and Sacchi.8 Samples were homogenized in TRI reagent on ice, and total RNA was extracted following the manufacturer's instructions. Purified RNA was quantified by UV absorbance at 260 and 280 nm and stored in 25 μg aliquots at −80°C for microarray hybridization and analyses. The adequacy and integrity of the extracted RNA were determined by gel electrophoresis. Sequential muscle biopsies from 2 patients showed insufficient quantity of RNA for microarray analysis and were omitted from any further analysis.
Microarray Analysis
Probe labeling, hybridization, and image acquisition were done according to the standard Affymetrix protocol. Briefly, 25 μg of purified, total RNA were transcribed into cRNA, purified, and used as templates for in vitro transcription of biotin-labeled antisense RNA. Biotinylated antisense RNA preparation was fragmented and placed in a hybridization mixture containing 4 biotinylated hybridization controls (BioB, BioC, BioD, and Cre) and hybridized to an identical lot of 24 Affymetrix Gene Chip arrays (HG-U95 Av2) for 16 hours. The arrays were washed and stained using the instrument's standard Eukaryotic GE Wash 2′ protocol and antibody-mediated signal amplification. The images were scanned and analyzed with Affymetrix GeneChip Analysis Suite 5.2. Images from each Gene Chip were scaled and adjusted to an average intensity value for all arrays of 1500. Scaled average-difference values and absolute call data from each Gene Chip were exported to data files and used for statistical analysis. In vitro transcription and chip hybridization were performed in collaboration with the UTMB Genomic Core Facility.
Data Analysis
Microarray data analyses included chip validation, normalization, filtering, and generation of consensus gene lists by comparing burn groups over time, using methods previously described.9–12 The first criterion was that the ratio of standard deviation and the mean of a gene's expression values across all samples were greater than the threshold of 0.85 and the upper limit of 8. Data were discarded if there was a large deviation in the number of present calls or if the correlation coefficient among samples within the group was less than 0.85. The second criterion required a gene to be called present in more than 80% of arrays at all times. We determined the presence (P) or absence (A) of each probe within the group (according to the Affymetrix algorithm). A probe is “present” if its absolute call was “P” for at least 2 members of the group containing 3 samples. Otherwise, the gene was considered not expressed in the group. The primary goal was to identify genes with significant differences in expression between the test and control group. The within-group average of expression was calculated and comparisons were made between groups. Comparisons were done by computing the expression-fold difference for each gene and listing those that show larger than 1.5-fold increase or decreases in activity. An entry was discarded as an outlier when its value was outside 3 standard deviations. Only the statistically significant differences at P < 0.05 were retained.9 Considering the number of samples per group and its influence on the validity of the analysis, the power of the t test was computed. If it was less than 0.8, results were discarded even when significant. By using HG-U95A Affymetrix arrays, about 4000 genes of 12,000 genes present in the array were always expressed.
Western Blot Analysis
Total protein from the muscle tissue was extracted, and 20 μg of the protein were separated on a 4% to 20% SDS-polyacrylamide gel under reducing conditions and transferred to nitrocellulose membranes (Hybond-C; Amersham Pharmacia, NJ) in a semidry blotting chamber, as previously described.13 After blockage of nonspecific binding sites with 5% nonfat milk in TBS containing 0.1% Tween-20 (Sigma, St. Louis, MO), blots were incubated in 1:1000 dilution of anti-β-2 microglobulin mouse monoclonal antibody (Abcam, Cambridge, MA), antimyosin goat polyclonal antibody (ventricular light chain; Cortex Biochem, CA), and antiactin rabbit polyclonal antibody (Sigma) as an internal control for 2 hours at room temperature. After extensive washing, the blots were incubated with HRP-conjugated antimouse IgG, antigoat IgG, and antirabbit IgG (final concentration, 1:2000) for 90 minutes at room temperature, respectively. Bound antibodies were detected with ECL Western blotting detection reagents (Amersham Pharmacia) according to manufacturer's instructions.
This study was approved by the institutional review board of the University of Texas Medical Branch, Galveston, TX, with written informed consent obtained from each patient's parent or guardian.
Statistical Analysis
Data are presented as means ± SEM. Comparisons between groups was by paired t test. P < 0.05 was accepted as statistically significant.
RESULTS
Patient Demographics and Gene-Expression Profiles
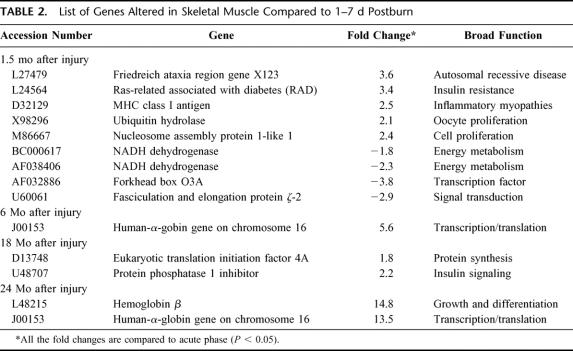
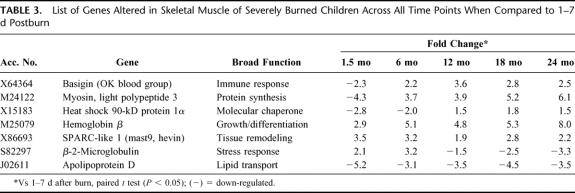
Patient demographics are listed in Table 1. Comparisons were made using 1 to 7 days after injury as baseline versus expression profile at time intervals of 1.5, 6, 12, 18, and 24 months after injury. The specific number of genes altered at each time point is depicted in Table 2. Sixteen genes at 1.5 months, 8 genes at 6 months, 7 genes at 12 months, and 9 genes at 18 and 24 months postburn were altered compared with 1 to 7 days after injury (Fig. 2). A list of 7 genes altered across all time points is shown in Table 3. Nine genes were specifically altered at 1.5 months (total number of genes altered, 16, minus number of common genes altered, 7, across all time points = specific number of genes altered at each time point, 1 gene after 6 months and 2 genes at 18 and 24 months in a paired comparison; Fig. 2). The categories of genes affected include structural proteins, genes related to developmental processes, transcription factors, glucose metabolism, growth factors, stress response modulators, and collagen-associated proteins.
TABLE 1. Demographics of Study Patients (n = 6)
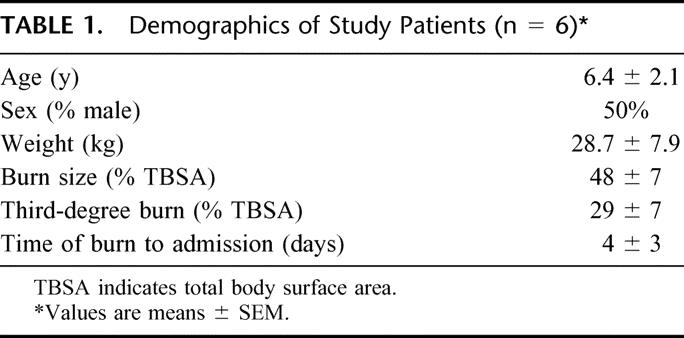
TABLE 2. List of Genes Altered in Skeletal Muscle Compared to 1–7 d Postburn
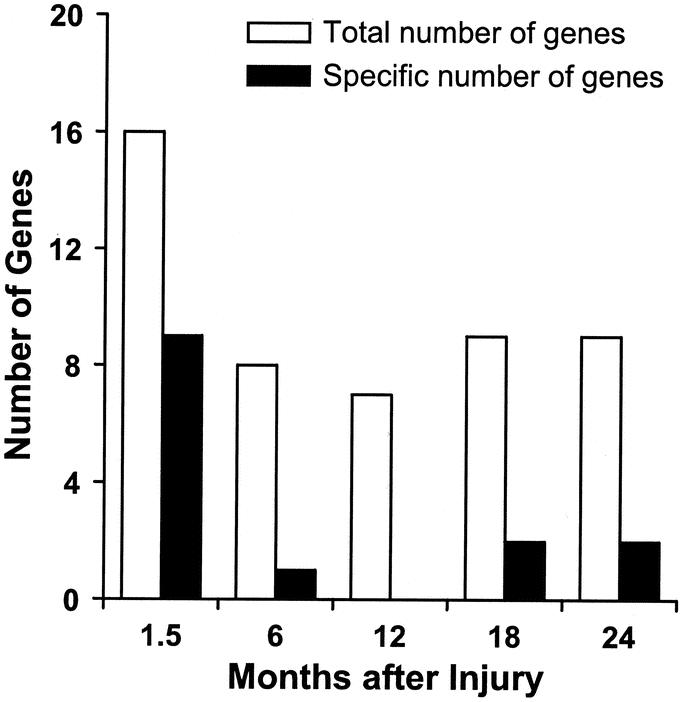
FIGURE 2. Total number of genes altered in skeletal muscle of severely burned children over time. Open bars indicate the total number and closed bars indicate the specific number of genes altered (up- or down-regulated) at the indicated time points.
TABLE 3. List of Genes Altered in Skeletal Muscle of Severely Burned Children Across All Time Points When Compared to 1–7 d Postburn
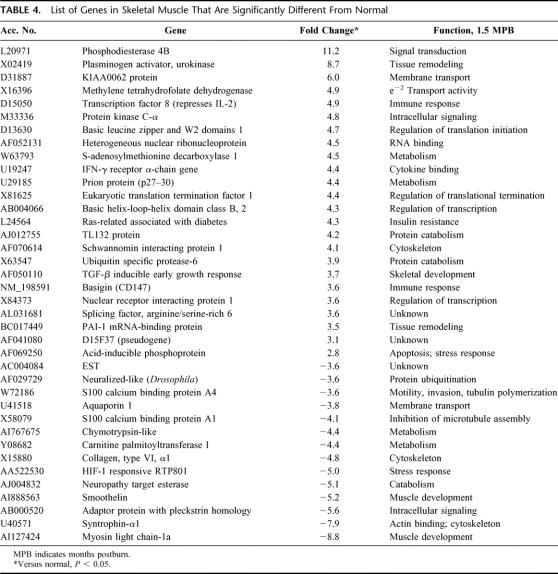
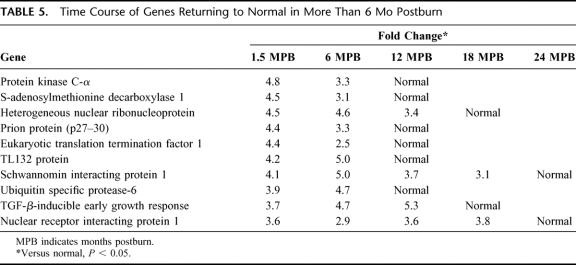
A comparison was also made using the normal controls as baseline versus expression profile at intervals of 1.5, 6, 12, 18, and 24 months after injury. Thirty-eight genes that were altered at 1.5 months postburn when compared with normal are depicted in Table 4. Time course of genes returning to normal in more than 1.5 months postburn is shown in Table 5. The categories of genes affected include skeletal/muscle development, genes related to protein catabolism/ubiquitination, metabolism, intracellular signaling, transcription, and cytoskeleton.
TABLE 4. List of Genes in Skeletal Muscle That Are Significantly Different From Normal
TABLE 5. Time Course of Genes Returning to Normal in More Than 6 Mo Postburn
Verification of mRNA Changes
Messenger RNA changes were verified through expression of related proteins by Western blot analyses. Beta-2 microglobulin and myosin light-chain transcription, which was altered across all time points, corroborated our microarray data (Fig. 3).
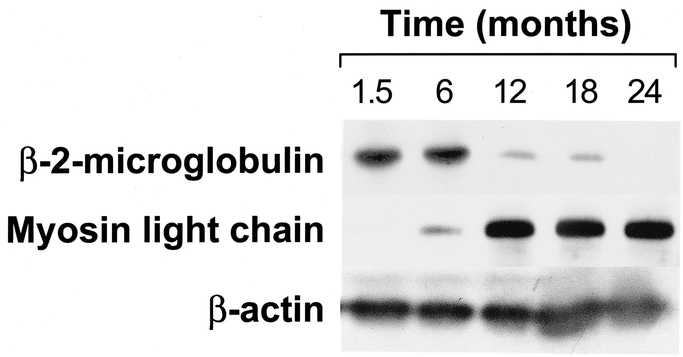
FIGURE 3. Western blot for β-2-microglobulin and myosin light chain in muscle from severely burned children. β-Actin is depicted to show any loading differences. Each lane represents pooled muscle protein extract from 3 patients.
DISCUSSION
The role of altered genes in the etiology or adaptation to reduced muscle mass and performance in burn children is unclear. To address this issue, we have shown the efficacy of anabolic agents to effectively diminish muscle catabolism in burn patients. Insulin has been shown beneficial in protein metabolism primarily by stimulating protein synthesis.14,15 Recombinant human growth hormone and insulin-like growth factor-1 binding protein-3 have also shown efficacy in improving muscle protein kinetics and wound healing in severely burned children.16–18 Anabolic steroids have been used to restore lean body mass and muscle loss as a consequence of starvation and, more recently, severe thermal injury, trauma, or HIV and chronic infections.19–22 We identified genes specifically altered in skeletal muscle with anabolic therapies using microarrays.23,24 Some genes whose expression is restored with anabolic therapy continue to be suppressed. For example, myosin light polypeptide-3 (M24122) gene expression was stimulated with oxandrolone; however, without oxandrolone this polypeptide continued to be inhibited for 6 months after burn. Myosin, in association with actin and other contractile proteins, plays an important role in the maintenance of cell shape and in cellular movement and is a major structural component of muscle sarcomere. Several isoforms of myosin light-chain polypeptide have been identified, which is in keeping with our previous findings of increased muscle mass in association with anabolic drug therapy24 and increases in mRNAs encoding energy metabolism and glucose metabolism.
The perturbation of normal homeostasis in critical illnesses and sepsis is brought about by injurious external stimuli to cells. Whether the stimuli are thermal, chemical, mechanical, or infection, the cell has adapted an intricate system to propagate this external signal to the nucleus in an effort to achieve an appropriate gene-induction response. In this respect, the integration of multiple cellular signal transduction pathways regulates most cellular functions. One common mechanism used by signal transduction pathways calls on rapid and reversible protein phosphorylation. The process of protein phosphorylation is mediated by protein kinases, whereas dephosphorylation is by phosphatases. Protein phosphatase-1 inhibitor (U48707) is a 19-kD protein which is phosphorylated by cyclic AMP-dependent protein kinase, which subsequently inhibits protein phosphatase-1. This event is primarily initiated in the skeletal muscle and leads to imbalance in the enzymatic activity critical for glygenolysis.25
In this study β-2-microglobulin (S82297) gene expression was up-regulated for up to 6 months after burn and down-regulated 12 months after injury, which indicated a positive recovery from the trauma. β-2-Microglobulin, the light chain of the class I major histocompatibility antigens (histocompatibility locus antigens A, B, and C), is present in all nucleated cells, through noncovalent attachment to the heavy chain of the HLA molecule.26 Association with β-2-microglobulin is generally required for the transport of class-I heavy chains from the endoplasmic reticulum to the cell surface. β-2-Microglobulin is present in smaller amounts in serum, csf, and urine of normal people and to a much greater degree in the urine and plasma of patients with tubular proteinemia, renal failure, or kidney transplants.27
In this study, increases in the expression of SPARC-like 1 mRNA were identified across all time points. SPARC-like 1 (SPARCL1, X86693), also known as MAST9 or hevin, is expressed at high levels in bone tissue, is distributed widely in many other tissues and cell types, and is associated generally with tissue remodeling (eg, tissues undergoing morphogenesis, mineralization, angiogenesis, and pathologic responses to injury and tumorigenesis). Experiments in vitro have provided evidence that SPARC disrupts cell adhesion, promotes changes in cell shape, inhibits the cell cycle, regulates cell differentiation, inactivates cellular responses to certain growth factors, and regulates extracellular matrix and matrix metalloprotease production. SPARC has demonstrated activities in angiogenesis, tumorigenesis, cataractogenesis, and wound healing.28
Data suggest that burn children return to near-normal conditions by 12 months postburn, with protein catabolism diminishing at 24 months. In this study, the comparison of gene-expression patterns in a paired study design provides some validity that the results are not outliers associated with the large number of gene probes used (12,625; Affymetrix). It is possible that some of the important changes, which occur at a lower level of significance, might be masked, as the fold change is volume averaged over the entire muscle volume. This suggests that there are genes that are highly regulated within small compartments of muscle and may escape detection with this assay.
While little information is currently available on changes in gene expression in the muscle of burn children with time, new technology currently stimulates the measurement of changes in gene expression using high-density oligonucleotide microarrays in a timed sequence. This gene profiling is expected to provide valuable information concerning the genes in skeletal muscle which may contribute to burn recovery.
Footnotes
This study was supported by Shriners Hospitals for Children grants 8660 and 8490 and National Institutes of Health grants 1P50GM60338-1 and 5RO1GM572903.
Reprints: Robert E. Barrow, PhD, Shriners Hospitals for Children, 815 Market St., Galveston, TX 77550. E-mail: rbarrow@utmb.edu.
REFERENCES
- 1.Bessey PQ, Jiang ZM, Johnson DJ, et al. Posttraumatic skeletal muscle proteolysis: the role of the hormonal environment. World J Surg. 1989;13:465–471. [DOI] [PubMed] [Google Scholar]
- 2.Monk DN, Plank LD, Franch-Arcas G, et al. Sequential changes in the metabolic response in critically injured patients during the first 25 days after blunt trauma. Ann Surg. 1996;223:395–405. [DOI] [PMC free article] [PubMed] [Google Scholar]
- 3.Moore FD. Response to starvation and stress. In: Moore FD, ed. Metabolic Care of the Surgical Patient. Philadelphia: W. B. Saunders; 1959:202–275. [Google Scholar]
- 4.Warden CD, Heimbach DC. Burns. In: Schwartz SI, ed. Principles of Surgery. New York: McGraw-Hill Inc; 1999:232–254. [Google Scholar]
- 5.Hart DW, Wolf SE, Mlcak R, et al. Persistence of muscle catabolism after severe burn. Surgery. 2000;128:312–319. [DOI] [PubMed] [Google Scholar]
- 6.Rutan RL, Herndon DN. Growth delay in postburn pediatric patients. Arch Surg. 1990;125:392–395. [DOI] [PubMed] [Google Scholar]
- 7.Herndon DN, Barrow RE, Rutan TC, et al. Effect of propranolol administration on hemodynamic and metabolic responses of burned pediatric patients. Ann Surg. 1988;208:484–492. [DOI] [PMC free article] [PubMed] [Google Scholar]
- 8.Chomczynski P, Sacchi N. Single-step method of RNA isolation by acid guanidinium thiocyanate-phenol-chloroform extraction. Ann Biochem. 1987;162:156–159. [DOI] [PubMed] [Google Scholar]
- 9.Dudoit S, Yang YH, Callow M, et al. Statistical Methods for Identifying Differentially Expressed Genesin Replicated cDNA Microarray Experiments. Berkley, CA: Department of Statistics, University of California; 2000. Technical Report #578.
- 10.Li C, Wong WH. Model-based analysis of oligonucleotide arrays: expression index computation and outlier detection. Proc Natl Acad Sci U S A. 2001;98:31–36. [DOI] [PMC free article] [PubMed] [Google Scholar]
- 11.Spies M, Dasu MR, Svrakic N, et al. Gene expression analysis in burn wounds of rats. Am J Physiol Regul Integr Comp Physiol. 2002;283:R918–930. [DOI] [PubMed] [Google Scholar]
- 12.Svrakic NM, Nesic O, Dasu MR, et al. Statistical approach to DNA chip analysis. Recent Prog Horm Res. 2003;58:75–93. [DOI] [PubMed] [Google Scholar]
- 13.Herndon DN, Dasu MR, Wolfe RR, et al. Gene expression profiles and protein balance in skeletal muscle of burned children after beta-adrenergic blockade. Am J Physiol Endocrinol Metab. 2003;285:E783–789. [DOI] [PubMed] [Google Scholar]
- 14.Sakurai Y, Aarsland A, Herndon DN, et al. Stimulation of muscle protein synthesis by long-term insulin infusion in severely burned patients. Ann Surg. 1995;222:283–287. [DOI] [PMC free article] [PubMed] [Google Scholar]
- 15.Ferrando AA, Chinkes DL, Wolf SE, et al. A submaximal dose of insulin promotes net skeletal muscle protein synthesis in patients with severe burns. Ann Surg. 1999;229:11–18. [DOI] [PMC free article] [PubMed] [Google Scholar]
- 16.Gore DC, Honeycutt D, Jahoor F, et al. Effect of exogenous growth hormone on whole-body and isolated-limb protein kinetics in burned patients. Arch Surg. 1991;126:38–43. [DOI] [PubMed] [Google Scholar]
- 17.Knox J, Demling R, Wilmore D, et al. Increased survival after major thermal injury: the effect of growth hormone therapy in adults. J Trauma 1995;39:526–530. [DOI] [PubMed] [Google Scholar]
- 18.Demling RH. Comparison of the anabolic effects and complications of human growth hormone and the testosterone analog, oxandrolone, after severe burn injury. Burns. 1999;25:215–221. [DOI] [PubMed] [Google Scholar]
- 19.Hausmann DF, Nutz V, Rommelsheim K, et al. Anabolic steroids in polytrauma patients: influence on renal nitrogen and amino acid losses: a double-blind study. J Parenter Enteral Nutr. 1990;14:111–114. [DOI] [PubMed] [Google Scholar]
- 20.Demling RH, DeSanti L. Oxandrolone, an anabolic steroid, significantly increases the rate of weight gain in the recovery phase after major burns. J Trauma. 1997;43:47–51. [DOI] [PubMed] [Google Scholar]
- 21.Strawford A, Barbieri T, Van Loan M, et al. Resistance exercise and supraphysiologic androgen therapy in eugonadal men with HIV-related weight loss: a randomized controlled trial. JAMA. 1999;281:1282–1290. [DOI] [PubMed] [Google Scholar]
- 22.Ferrando AA, Sheffield-Moore M, Wolf SE, et al. Testosterone administration in severe burns ameliorates muscle catabolism. Crit Care Med. 2001;29:1936–1942. [DOI] [PubMed] [Google Scholar]
- 23.Barrow RE, Dasu MR, Ferrando AA, et al. Gene expression patterns in skeletal muscle of thermally injured children treated with oxandrolone. Ann Surg. 2003;237:422–428. [DOI] [PMC free article] [PubMed] [Google Scholar]
- 24.Wolf SE, Thomas SJ, Dasu MR, et al. Improved net protein balance, lean mass, and gene expression changes with oxandrolone treatment in the severely burned. Ann Surg. 2003;237:801–811. [DOI] [PMC free article] [PubMed] [Google Scholar]
- 25.Shanley TP. Phosphatases: counterregulatory role in inflammatory cell signaling. Crit Care Med. 2002;30:S80–S88. [PubMed] [Google Scholar]
- 26.Cresswell P, Springer T, Strominger JL, et al. Immunological identity of the small subunit of HL-A antigens and beta2-microglobulin and its turnover on the cell membrane. Proc Natl Acad Sci U S A. 1974;71:2123–2127. [DOI] [PMC free article] [PubMed] [Google Scholar]
- 27.Warr GW. Beta 2 microglobulins: a brief comparative review. Dev Comp Immunol. 1985;9:769–775. [DOI] [PubMed] [Google Scholar]
- 28.Yan Q, Sage EH. SPARC, a matricellular glycoprotein with important biological functions. J Histochem Cytochem. 1999;47:1495–1506. [DOI] [PubMed] [Google Scholar]


