

Abstract
Objective:
The VA National Surgical Quality Improvement Program (NSQIP) formula for risk factors was applied to the University of Texas Health Science Center at San Antonio (UTHSCSA)/University Hospital (UH) database. Its applicability to a civilian organization was established. Logistic regression analysis of the UH database revealed that operative complexity was significantly related to mortality only at high complexity levels. Patient risk factors were the major determinants of operative mortality for most civilian surgical cases.
Summary Background Data:
Since 1994, the NSQIP has collected preoperative risk factors, intraoperative data, 30-day morbidity, and mortality within the VA health system. The VA formula to predict 30-day postoperative mortality was applied to our UH patients (N = 8593). The c-index of .907, a statistical measure of accuracy, compared favorably to the VA patient c-index of .89. The UH database did not include a surrogate for operative complexity. We were elated by the predictive accuracy but had concern that operative complexity needed further evaluation.
Methods:
Operative complexity was ascribed to each of the 8593 UH cases, and logistic regression analyses were compared with and without operative complexity. Operative complexity was graded on a scale of 1 to 5; 5 was the most complex.
Results:
Without operative complexity, a c-index was .915. With operative complexity: an even higher c-index of .941 was reached. The large volume of level 2–3 operative cases obscured to a degree the effect of operative difficulty on mortality.
Conclusion:
Operative complexity played a major role in risk estimation, but only at the extreme. The dominance of cases of midlevel complexity masked the effect of higher complexity cases on mortality. In any individual case, operative complexity must be added to estimate operative mortality accurately. Patient risk factors alone accounted for operative mortality for operations less than level 4 (95% of patients).
The VA National Surgical Quality Improvement Program (NSQIP) formula for risk factors was applied to the University of Texas Health Science Center at San Antonio (UTHSCSA)/University Hospital (UH) database. Logistic regression analysis of the UH database revealed that operative complexity was significantly related to mortality only at high complexity levels. Patient risk factors were the major determinants of operative mortality for the vast majority of civilian surgical cases.
In 1986, the US Congress passed a law mandating that the Veterans Administration (VA) compare surgical outcomes with the national average. A VA committee was appointed to compare its results with national listed surgical outcome databases then in existence. The senior author was the only non-VA employee included on this committee. A frustrating search to identify comparable risk-adjusted databases to compare VA statistics with civilian ones was undertaken. The results of our analysis were published in 1993,1 reflecting an inability to find comparable databases to compare with the VA experience.
It was obvious that the only way to evaluate the VA surgical outcomes was to collect prospective risk data for each patient and to analyze these data across the VA surgical services. This program was headed by Dr Shukri Khuri after he joined the committee in 1988. A prospective database had been in existence at the University of Texas Health Science Center under the supervision of Dr. Carey Page since 1978. However, that program was proprietary and could not be adapted to the computerized system in the VA.
This study was designed to answer 2 questions:
Can the VA formulas for calculating mortality be applied to a civilian prospectively collected of comparable data?
Can we examine and define the role of operative complexity in the determination of surgical risk?
METHODS
The VA prospective database was made up of preoperative data, including 10 demographic, 30 clinical, 12 laboratory, and 14 intraoperative variables and postoperative data comprising complications, 30-day postoperative mortality, and length of stay. Data were collected prospectively at 44 VA medical centers, beginning in October 1991. When 117,000 operations had been collected, it was possible to use the statistical techniques of logistic regression to provide a formula for operative risk that had a c-index of .89, indicating a high predictive accuracy.2 The c-index, a test of discrimination, is the proportion of cases in which 2 randomly selected members of the test sample show agreement between the comparison of the observed and predicted outcomes. A c-index of 0.5 means no predictability and a c-index of 1.0 means perfect predictability. The formula, as then calculated, has withstood the test of time with very little change. There are currently over 1 million operations in the database. Figure 1 is the formula for 1997 accrual.3–5 The top factors in order of their importance as determined by logistic regression for 1997 are listed in Table 1. Operative complexity was not among the top 10 factors in calculating risk. Operative complexity in the VA database is measured on a scale of 1–5. Table 2 illustrates the grades of operative complexity with examples.
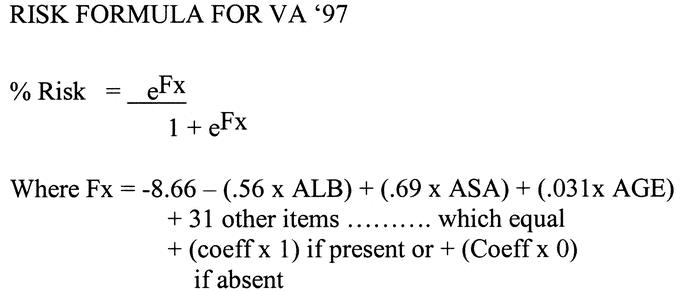
FIGURE 1. Logistic regression equation used to evaluate the VA operations for 1997.
TABLE 1. Priority Listing of Items in the Order of the Entrance Into the Logistic Regression Equation Using VA 1997 Data

TABLE 2. A Listing of the Items in Order of Their Entrance in the Linear Regression Equation of UH Database
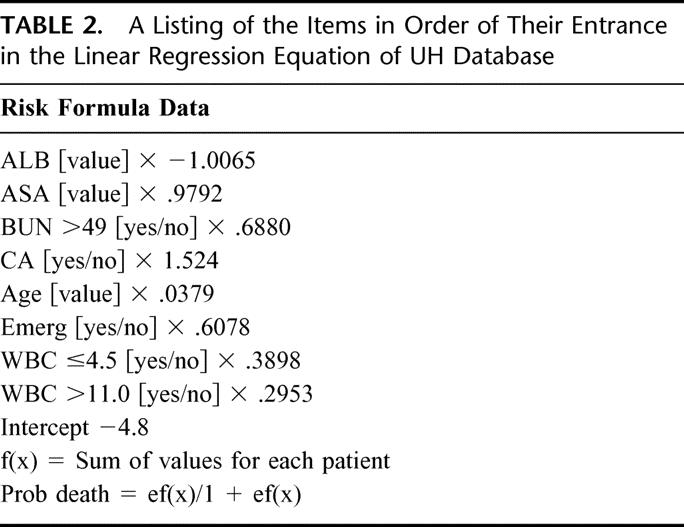
Figure 2 shows the general plot of a risk formula. A zero index for any individual patient indicates 50% mortality. A value positive above zero has a mortality greater than 50%; below zero, a lower mortality. Using the known operative mortality for the entire group of operations and solving the equation determines the negative number intercept (Fx). This number and the albumin coefficient are the only negative numbers in the formula and therefore are the only factors which influence the calculation of a lower mortality. All the remaining factors contribute to increased expected mortality. When the formula is applied to an individual patient, an expected mortality is calculated. For a given surgical service, the summation of these calculated data will give the expected mortality for patients on that particular service. This can be compared with the actual mortality, and an observed versus expected ratio can be calculated (O/E ratio).3
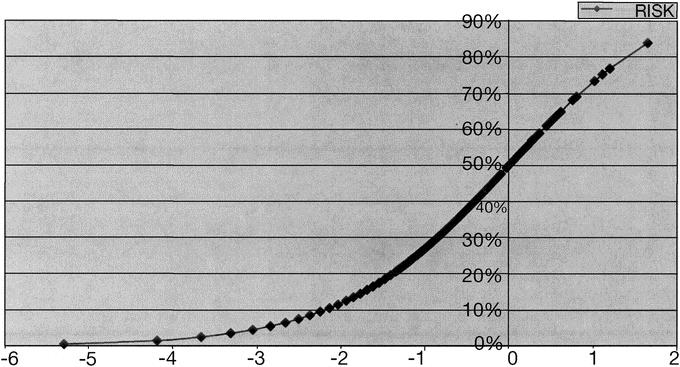
FIGURE 2. Standard logistic regression curve.
The University Hospital (UH) database of 100,000 patients was culled for 8593 operations where data were complete for serum albumin, ASA, BUN, age, cancer, emergency operation, and increased or decreased WBC. Operative complexity was not included in the original UH database. The logistic regression of the VA database using only the values listed in common with the UH database was derived and applied to the calculation of risk for the UH patients. Ac-index was also calculated for this formula. An operative complexity value was then added to each of the 8593 UH patient records. A logistical regression of the UH database was then carried out with and without operative complexity values included. A c-index was derived for each of the 2 ensuing formulas.
RESULTS
Figure 3 shows the VA formula derived for the 8 variables in common with the VA database. Even though our database had a higher percentage of women and children, it was clear that the VA formula was able to estimate operative mortality with a high degree of accuracy, as evidenced by the c-index of .902. This c-index was even higher than that value calculated for the VA formula applied to the VA population. This result probably reflected a lack of data points that had required imputation in the VA database. Figure 4 shows a plot of the standard curve and a plot of the expected mortality for the 8593 UH operations. The congruency of the 2 curves is impressive since operative complexity was not included in this particular database collection. It was apparent that the major factors in operative mortality were those that the patient brought to the operating room rather than the complexity of the surgical procedure.
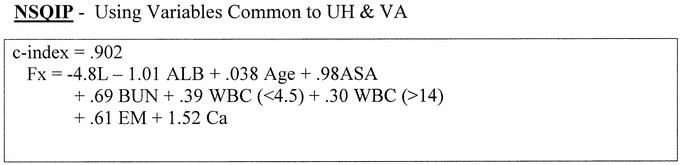
FIGURE 3. The equation developed applying 1997 VA data to UH limited data set.
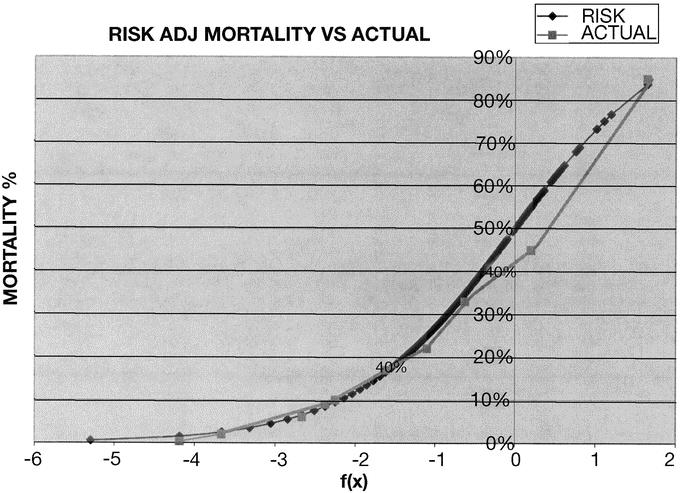
FIGURE 4. Comparison of standard values with actual mortality values.
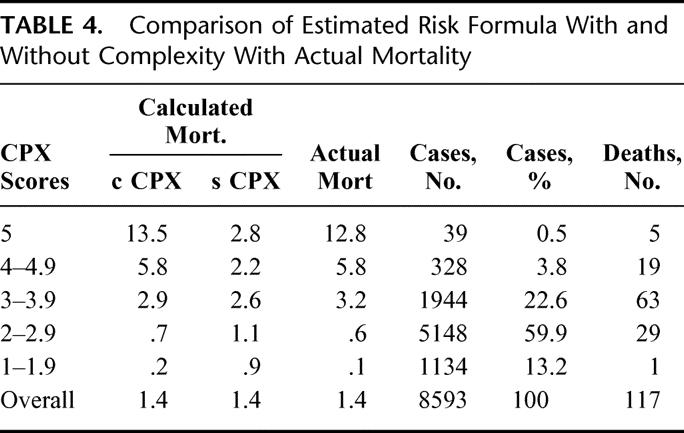
The application of the formulas in Figure 5 reveals a c-index of .915 without operative complexity and a very high c-index of .941 with operative complexity included. Operative complexity played an important role in operative mortality, but only at operative complexity grades 4 and 5 (Table 3). Of note is the accurate prediction of mortality with operative complexity added, as well as the similarity of operative mortality with and without operative complexity for the bulk of patients in all other operative levels (Table 4. The number of patients with operations at grades 4 and 5 complexity was so very small that the overall accuracy of prediction without operative complexity masked the contribution of high grades of operative complexity because of the sheer number of more straightforward cases. Mortality without operative complexity added to the formulas for operations in the 4 and 5 grades was underestimated by 2 and 4 times, respectively. It is noteworthy that, of the 4000 patients including all grades of complexity who had predictions of less than 0.5% mortality, only 1 patient who had a colon resection died.

FIGURE 5. UH data formulas with and without operative complexity.
TABLE 3. Operation Complexity Grades
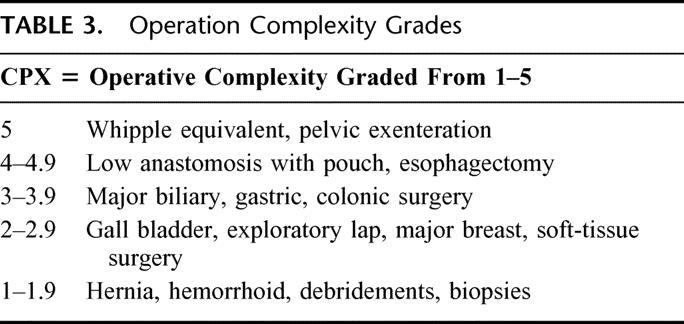
TABLE 4. Comparison of Estimated Risk Formula With and Without Complexity With Actual Mortality
Simplified formulas can provide estimates of risk and flag those patients who may benefit from preoperative attention. A simplified formula using rounded or whole numbers with a c-index of .816, shown in Figure 6, facilitates bedside calculations. The Fx calculation requires only ALB, ASA, age, and the presence of cancer or an emergency operation to determine the major risk factors the patient brings to the operating room. If the patient is undergoing a difficult or complex procedure, adding 1 to the equation will adjust for operative complexity. The Fx can be converted to mortality % using the short table in the left side of Figure 6.
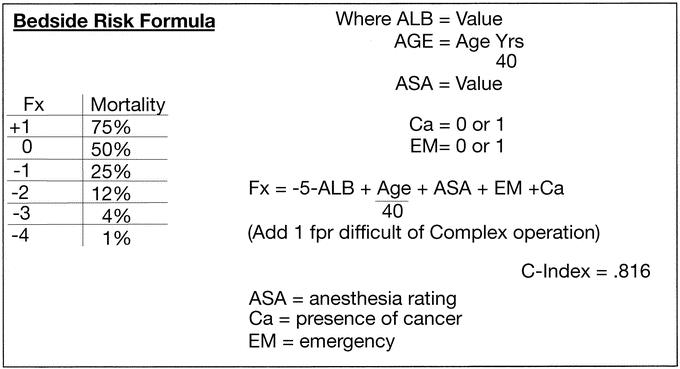
FIGURE 6. Beside risk formula.
DISCUSSION
What were considered complicated operations 50 years ago, such as colon resections and bile duct procedures, are now considered grade 3 complexity. Patient risk factors predominate over the operative intervention as a cause for operative mortality for grade 3 and lower patients. When patients have operations of operative complexity in the grades of 4 or 5, the generic patient risk factors still contribute a share to operative mortality but are dominated by the issue of the complexity of the procedure. When difficult operations become standardized and operative mortality falls, we predict that the generic risk factors the patient brings to the operating table will then dominate as the major contributions to operative mortality.
It is clear that operative complexity plays a major role in operative mortality using the risk-adjusted formula, but only at an extreme. The dominance of the large numbers of cases of midlevel complexity masks the effect of higher complexity cases in the overall comparison of generic patient risk factors in large databases. In any individual case, operative complexity must be added to estimate operative mortality accurately. The main message of this investigation is that the risk factors that patients bring to the operating room account for the majority of operative deaths. Prospective utilization of this information, notably albumin and ASA classification, may permit time to improve the patient's risk in elective cases. Preoperative nutritional support to repair liver function, as well as efforts to improve cardiac, pulmonary, kidney, and endocrine function and to alter the ASA rating favorably, may lower operative mortality. Age, emergency operation, cancer status, and the other major components of increased risk are not amenable to such manipulation.
Discussions
Dr. R. Scott Jones (Charlottesville, Virginia): Before I comment on the presentation I will say a word or two about the presenter and simply point out that Brad Aust has been a pioneer in data-driven quality improvement probably longer than anybody else I know. And I think his experience and attention to this problem is reflected in his work presented today. I comment and emphasize a couple of things.
One thing that he showed from his data is that the program that was developed in the Veterans Administration, the National Surgical Quality Improvement Program, can be applied to non-VA hospitals because it applied very effectively in his university hospital. There is additional data available to support that contention.
First of all, there was an alpha trial done with three university hospitals using this data—Emory, University of Michigan, University of Kentucky – and the methodology applied extremely well in general surgery and vascular surgery. In addition, there is a large study going on now that is a collaboration between the American College of Surgeons and the VA investigators. We have completed two years of data in 14 university hospitals and then the latter three community hospitals. The complete data in the first year has been analyzed and looked at very carefully and the methodology holds up extremely well at university hospitals. So the methodology that has been developed by Dr. Aust and his partners in the VA is a very rigorous and usable tool.
The second point I would make is to emphasize the point that was in the paper, and that is the risk adjustment methodology that has been developed is very accurate. As these databases have been developed, it is clear that we can do a fairly reasonable job, actually an excellent job, of predicting the risk of mortality, talking about the data, in many cases morbidity, in patients. So I think we have to use this and go forward with it.
I will close by asking two questions. First, having said all of this, Dr. Aust, would you please tell us where we should place the role of complexity score in our data collection process and analysis process? I think you have emphasized that it is very useful in the very high complexity cases but its value tends to go down, as one would expect. But as a practical matter, fit this into the overall project. As we are going ahead, should we have this in our database?
And the other thing I will ask and point out—and of course Dr. Aust knows this—there has been some discussion about whether the system that was developed by the VA surgeons is in fact the best assessment of operative complexity. And the people, the Executive Committee, are looking at other ways of doing this, and there was some discussion, actually there has been some look at relative value units as a surrogate complexity score. I would like for you to tell us what your opinion would be about using either RVU or some other measure of assessing complexity.
Dr. Maurice J. Jurkiewicz (Atlanta, Georgia): Perhaps this is a naive question, but I am struck by the issue of operative complexity. Dr. Aust did not take into account the skill and experience of the surgeon. I remember Gene Bricker at Barnes Hospital. In performing a pelvic examination, which rates 5 in the Aust scale, Dr. Bricker made it look easy so that a 5 became a 1. So complexity to me is both intrinsic to the procedure and extrinsic and relates to the individual performing that particular operation. Nowhere in this formula do I see that represented.
Dr. Kevin M. Reavis (Portland, Oregon): I would like to applaud Dr. Aust for taking on the challenge of objectifying the subjective nature of clinical judgment, our foundation for determining the appropriate course of treatment for our patients.
What legal implications might the operative complexity scale have in situations involving an adverse surgical outcome, where the decision to operate is not in line with the operative complexity score?
Dr. J. Bradley Aust (San Antonio, Texas): The complexity score is an artificial score and is unique to the VA. We decided at our last meeting that we would transpose it to an RVS score so that people outside the VA could make use of a value they already had in their database.
I think the best system for comparing services or surgeons is probably the one that includes the seven or eight major items I have listed, plus the RVS for complexity. This will give an extremely high C-index. It will enable comparison of observed versus expected outcomes for surgical services and even individual surgeons, if they have enough cases.
Dr. Jurkiewicz asked, “Where does the role of the individual surgeon come in?” Let me suggest that operative complexity and operative mortality varies over time.
Thirty years ago operative mortality for gastric resection and a host of other procedures was 10% to 15%. Now it is down to 2% to 3%. I am suggesting that once an operation becomes standardized and it can be done safely, as Dr. Bricker has shown, surgeons can then teach others to do that operation safely. Then the mortality will come down. But, it is only going to decrease to a point where the patient risk factors will dominate over the operative complexity.
For Whipple's operation, mortality used to be about 30%, and now in many series it is down to less than 5%. When operative complexity is included in the risk formula, O/E ratios can be used to compare both surgical services and surgeons. The O/E ratio is the best way to evaluate not just surgical competence, but the environment's competence, because the O/E ratio reflects more than what the surgeon does, it reflects the environment—the nurses, the ICU, the OR, and anything in that environment, which can contribute to operative mortality.
I am sorry I can't really suggest an answer to your legal question.
Footnotes
Reprints: J. Bradley Aust, MD, PhD, University of Texas Health Science Center at San Antonio, 7703 Floyd Curl Drive, San Antonio, TX 78229. E-mail: aust@uthscsa.edu.
REFERENCES
- 1.Stremple JF, Bross DS, Davis CL, et al. Comparison of postoperative mortality in VA and private hospitals. Ann Surg. 1993;217:277–285. [DOI] [PMC free article] [PubMed] [Google Scholar]
- 2.Daley J, Henderson WG, Khuri SF. Risk-adjustment surgical outcomes. Ann Rev Med. 2001;42:275–287. [DOI] [PubMed] [Google Scholar]
- 3.Khuri SF, Daley J, Henderson W, et al. Risk adjustment for the comparative assessment of the quality of surgical care. J Am Coll Surg. 1995;180:519–531. [PubMed] [Google Scholar]
- 4.Khuri SF, Daley J, Henderson W, et al. Risk adjustment of the postoperative mortality rate for the comparative assessment of the quality of surgical care: results for the National VA Surgical Risk Study. J Am ColI Surg. 1997;185:315–327. [PubMed] [Google Scholar]
- 5.Khuri SF, Daley J, Henderson W, et al. The Department of Veterans Affairs’ NSQIP: the first national, validated, outcome-based, risk-adjusted, and peer-controlled program for the measurement and enhancement of the quality of surgical care. Ann Surg. 1998;228:491–507. [DOI] [PMC free article] [PubMed] [Google Scholar]