

Abstract
Cardiopulmonary imaging in rodents using micro-computed tomography (CT) is a challenging task due to both cardiac and pulmonary motion and the limited fluence rate available from micro-focus x-ray tubes of most commercial systems. Successful imaging in the mouse requires recognition of both the spatial and temporal scales and their impact on the required fluence rate. Smaller voxels require an increase in the total number of photons (integrated fluence) used in the reconstructed image for constant signal-to-noise ratio. The faster heart rates require shorter exposures to minimize cardiac motion blur imposing even higher demands on the fluence rate. We describe a system with fixed tube/detector and with a rotating specimen. A large focal spot x-ray tube capable of producing high fluence rates with short exposure times was used. The geometry is optimized to match focal spot blur with detector pitch and the resolution limits imposed by the reproducibility of gating. Thus, it is possible to achieve isotropic spatial resolution of 100 μm with a fluence rate at the detector 250 times that of a conventional cone beam micro-CT system with rotating detector and microfocal x-ray tube. Motion is minimized for any single projection with 10 ms exposures that are synchronized to both cardiac and breathing motion. System performance was validated in vivo by studies of the cardiopulmonary structures in C57BL/6 mice, demonstrating the value of motion integration with a bright x-ray source.
Keywords: micro-CT, resolution, mouse, gating
I. INTRODUCTION
The growing interest in mouse models of human disease has produced a need for imaging systems that are designed specifically for small animals. The mouse represents a specific and important challenge. At 25 g, the mouse is nearly 3000× smaller than humans and requires a commensurate increase in resolution over clinical systems for comparable organ definition. A number of investigators have already demonstrated the potential for micro-computed tomography (CT) in small animal models.1–3 However, cardiopulmonary studies have been limited.4,5 Since the image noise is proportional to (Δx)−2, where Δx is the dimension of the isotropic voxel, the signal-to-noise ratio (SNR) will decrease significantly over that typical in clinical settings if the x-ray exposure to the animal is held constant relative to that in the clinical setting.1,2,6 At the same time, the physiological motion in the mouse is at least 10× faster than humans. Thus, for in vivo imaging of lung and heart in the mouse, special strategies must be considered, e.g., short exposures to limit the motion blur with high fluence rate to improve the SNR. A number of commercial systems are now available that are scaled versions of third-generation clinical CT scanners with x-ray tube and detector rotating about the object being scanned.6–8 Since this geometry results in magnification, it requires the use of x-ray tubes with small focal spots to maintain the desired spatial resolution. We describe a design that allows the use of larger focal spot x-ray tubes capable of producing much higher fluence rates with exposure times short enough (10 ms) to limit motion blur in the heart and lungs. The system has been constructed to allow simultaneous use of scan synchronous ventilation and cardiac gating.
II. MATERIALS AND METHODS
The system shown in Fig. 1 employs a fixed detector and x-ray tube with the sample placed as close to the detector as possible to minimize magnification. The animal is suspended vertically in a 30 mm acrylic tube that is locked to a support attached to a stepping motor that rotates the animal under computer control. This approach provides two advantages over the traditional third-generation CT geometry. First, this approach allows use of a larger x-ray tube with a higher fluence rate. Second, it is easier to rotate the 25 g animal than the more massive tube and detector assembly. The system uses a high-capacity rotating anode x-ray source designed for clinical angiography (Philips SRO 09 50) with a dual 0.3/1.0 mm focal spot operating at 9 kW (0.3 mm focal spot) and 50 kW (1.0 mm focal spot). The detector is a cooled charge-coupled device camera with a Gd2O2S phosphor on a 3:1 fiber optic reducer (X-ray ImageStar, Photonics Science, East Sussex, UK). The camera has a 106 mm2 active field of view with an image matrix of 2048×2048 pixels of 51×51 microns. The camera drivers permit flexible readout and rebinning. For the studies shown here, data were acquired over a whole field of view with binning producing two-dimensional 1024×1024 projections.
Fig. 1.
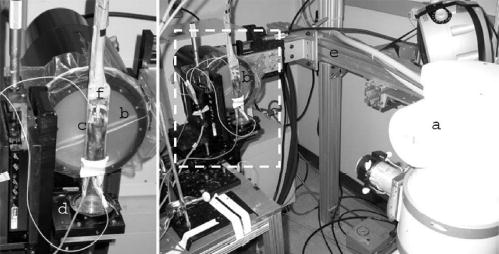
The x-ray tube (a) and detector (b) are stationary. The mouse is supported in an acrylic tube (c) placed on a support which is rotated by a computer-controlled stepping motor (d). The tube and detector are supported on a gantry (e) constructed from extruded aluminum to limit the impact of building vibration. The relative position of the elements of the scanner is easily adjusted. The valve for scan synchronous ventilation (f) and ECG leads are supported from the top of the gantry.
A larger focal spot produces a higher fluence rate. But the blur from the larger focal spot reduces the spatial resolution. One can reduce this blur by moving the tube further from the object and detector, but this in turn reduces the fluence rate at the detector. The fluence rate can be optimized by careful tradeoff between the source detector distance and the resolution. The resolution limit due to penumbral blurring (b) in the projection plane is related to the focal spot diameter (fs), the object detector distance (odd), and the source detector distance (sdd) by Eq. (1)
| (1) |
A 25 g mouse is <30 mm in diameter. If one allows a 10 mm space for clearance between the detector and mouse, one can use 40 mm as a conservative value for odd. The fluence rate from an x-ray tube is linearly related to the current. The maximum current one can use is limited by heating. To first order, the current, and therefore the fluence rate from a given focal spot is proportional to the area of the focal spot. Heat transfer for larger spots is less efficient than for small focal spots giving rise to a general expression for the fluence rate (φ) at a given sdd that is shown by Eq. (2).
| (2) |
where n ranges between 1 and 2. For a given focal spot, the fluence rate will be optimized when sdd is set such that the blur equals the desired resolution. Solving Eq. (1) for that condition we obtain
| (3) |
Substituting sdd in Eq. (2) yields an expression that defines the maximum fluence rate for a given focal spot at a given resolution.
| (4) |
Fitting the two focal spot available on the Phillips tube (0.3 mm at 9 kW and 1.0 mm at 50 kW) yields n=1.44. Figure 2 shows a plot of the maximum fluence rate that can be obtained as a function of the focal spot dimension for three different cases of limiting resolution (25, 50, and 100 μm). The curves have all been normalized to the maximum fluence rate available for a resolution of 100 μm, which occurs for a focal spot dimension of ~0.3 mm. For the 0.3 mm focal spot, the sdd for resolution of 100, 50, and 25 μm is 160, 280, and 520 mm, respectively. The same graph shows the relative exposure for 80 kVp, 10 ms exposure measured with an MDH 1015 ionization chamber for the 0.3 and 1.0 mm focal spots at the sdd appropriate for 25, 50, and 100 μm resolution and the maximum current permissible for the focal spot. These experimental values are also normalized to the maximum measured for 100 μm resolution at fs =0.3 mm. For the 1.0 mm focal spot, the sdd for resolution of 100, 50, and 25 μm is 440, 840, and 1640 mm, respectively. While the optimum fluence rate is attained for a 0.3 mm focal spot, the majority of our studies were performed with the 1.0 mm focal spot at sdd of 440 mm yielding a half cone angle of 6.86°, which is adequate with respect to artifacts associated with the Feldkamp reconstruction algorithm.9
Fig. 2.
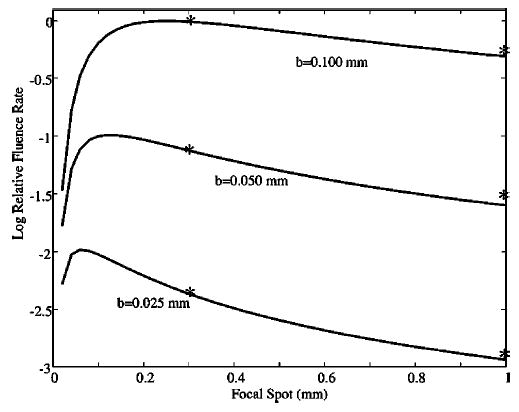
Relative fluence rate is plotted as a function of focal spot dimension for limiting resolution at 25, 50, and 100 μm. The fluence rate is normalized to the maximum that is attained for resolution at 100 μm with a focal spot of 0.3 mm. The normalized exposures for 80 kVp, 10 ms are plotted for the 0.3 and 1.0 mm focal spots at the sdd required for resolution of 100, 50, and 25 μm and the maximum current available for the two focal spots (100 and 620 mA).
Degradation of the resolution arising from the combination of respiratory and cardiac motion is limited through a combination of scan synchronous ventilation and cardiac gating. Mice were perorally intubated, and maintained on isoflurane anesthesia delivered by a mechanical ventilator10 that also provides a trigger that controls x-ray exposure and camera readout. The programs synchronizing the x-ray exposure and the detector readout to the physiological parameters were developed under LABVIEW (National Instruments, Austin, TX). The system includes three different computers (Dell PCs running Microsoft XP), each assigned specific tasks, as shown in Fig. 3. A screen capture of the monitoring program showing the relevant signals from the physiologic monitor is also included. The first computer is used for monitoring physiological parameters [body temperature, electrocardiographic (ECG) signal, airway pressure] and controlling the ventilator.11 The second computer sends pulses that control the camera and the x-ray generator in synchrony with the ECG and ventilation phase. This computer also controls rotation of the animal through a RS-232 interface to an Oriel Model 13049 digital stepping motor. The third computer acquires and stores the individual two-dimensional projections. An acquisition window is defined at a specific phase of the ventilation cycle, e.g., during inspiration, during a period of breath hold or at end expiration. The first QRS complex of the ECG occurring within the window triggers a 10 ms x-ray exposure. This prospective gating ensures that the images are always acquired at the same phase of the cardiac cycle and breathing cycle. After an image is acquired, the animal is rotated to the next image scanning angle and the procedure is repeated.
Fig. 3.
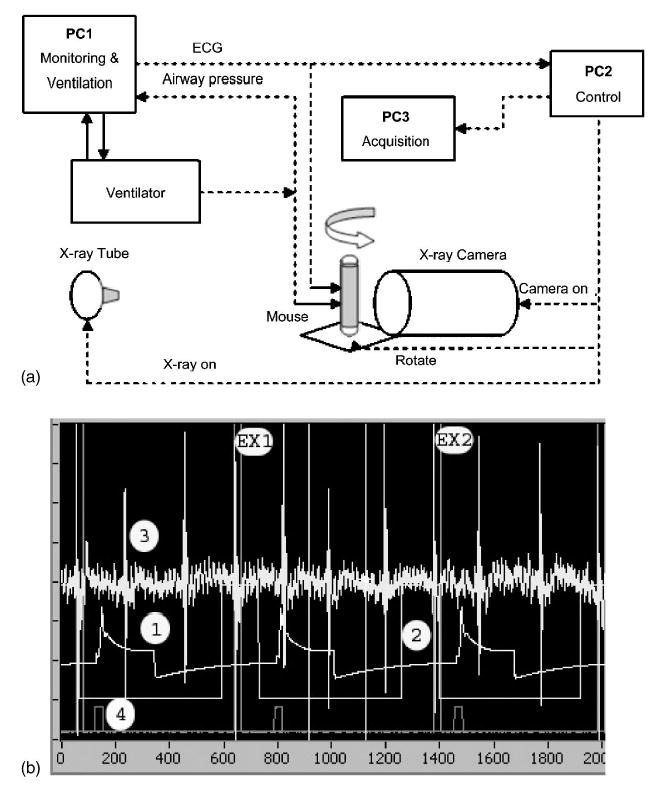
A schematic of the system is shown (a) and the signal wave forms during sampling in (b). The system is controlled by three computers each running LABVIEW. PC1 controls the ventilator and monitors the physiologic signals from the animal. PC2 acts as the sequencer for the system. It receives triggers from PC1 that control the x-ray generator and the stepping motor for the gantry. PC3 receives the trigger from PC2 that controls the camera acquisition, integration, and readout. (b) shows a capture of the monitoring application during sampling. Trace 1 shows the pressure at the ventilator. In this example a window is enabled at end expiration (trace 2) which is then logically combined with the ECG (trace 3) to allow exposures 1 and 2 (EX1, EX2). Trace 4 shows the digital signal to advance the table to the next projection.
X-ray parameters for volume imaging were typically 80 kVp, 150 mA, and 10 ms resulting in an exposure of ~70 mR per projection. After checking the alignment of the micro-CT system using a pin phantom, 380 projection images were acquired over a circular orbit of 190° (i.e., 180° +fan angle) with a step angle of 0.5°. The scanning time for a complete dataset was 15 min. The 2D projection images were used to reconstruct tomograms with a Feldkamp algorithm,9 using a commercial software package (Cobra EXXIM, EXXIM Computing Corp., Livermore, CA). Data were reconstructed with Parker weighting12 as isotropic 1024×1024×1024 arrays with effective digital sampling in the image plane of 90.9 μm, since the magnification factor for the geometry used was 1.1.
All animal studies were conducted under a protocol approved by the Duke University Institutional Animal Care and Use Committee. Studies were performed on C57BL/6 mice weighing between 25 and 30 g. Animals were anesthetized with a 45 mg/Kg intraperitoneal injection of methohexital and following endotracheal intubation, anesthesia was maintained with 2%–3% isoflurane. Anesthetic gas was delivered by the custom-made ventilator, which has been described elsewhere.10,11 The animals were mechanically ventilated at a rate of 90 breaths/min with a tidal volume of 0.4 ml. A solid state pressure transducer on the breathing valve measured airway pressure. ECG electrodes were taped to the footpads. Body temperature was recorded using a rectal thermistor. The animals were placed in the cradle in a vertical position with flexible tubes and wires carrying anesthesia gas and physiologic signals suspended from above to allow free rotation. All physiological signals were processed (Coulbourn Instruments, Allentown, PA) and displayed on a computer using a LABVIEW application, described above. For some studies images were acquired during tail vein infusion (1 ml/h) of Isovue 370.
III. RESULTS
Figure 4 shows images of a lead bar phantom placed at an odd of 40 mm acquired with (a) 1.0 mm and (b) 0.3 mm focal spots with sdd=440 and sdd=160 mm, respectively. The projections were acquired as unbinned images, i.e., the pixel size was 51×51 μm. The 5 lp/mm resolution pattern is resolved in both cases, as predicted by Eq. (1). The modulation transform function (MTF) of the entire system [Fig. 4(c)] was determined in the reconstructed images using a procedure described in the American Society of Testing Materials (ASTM) standards.13 To determine the MTF, we used both unbinned (pixel size=51 μm) and binned projections (pixels size=102 μm). The MTF at 10% value was in both cases close to 3 lp/mm. The low contrast detectability of ~0.78%. was determined using a phantom containing different concentrations of Isovue (370 mg/ml iodine) in solutions of water.
Fig. 4.

The limiting resolution imposed by the focal spot and geometry was verified in projection images for the 0.3 mm (a) and 1 mm (b) focal spots using a digital camera with a 0.05 mm pitch. (c) The MTF of the entire micro-CT system measured in reconstructed images with a disk phantom as described in ASTM.13
Figure 5 shows a comparison image in the thorax of a C57/BL/6 mouse acquired under four different conditions: (1) live animal with neither ventilatory or cardiac gating; (2) live animal with ventilatory synchronization; (3) live animal with both ventilatory synchronization and cardiac gating; and (4) dead animal. Without ventilatory (and cardiac) gating [Figs. 5(a) and 5(e)], the edge of the diaphragm is poorly defined and there is very little internal structure visible in the lung [arrow, Fig. 5(a)]. While the cardiac shadow is clear, the edge of the heart is blurred. The addition of ventilatory synchronization [Figs. 5(b) and 5(f)] improves the definition of the edge of the diaphragm but the cardiac border is very poorly defined [arrow, Fig. 5(b)]. While pulmonary vasculature and airways are more clearly seen, they are still blurred by motion of the heart. Note for example, the branching airways in the magnified section of the left lung [arrow, Fig. 5(f)]. The combination of cardiac gating with ventilatory synchronization results in markedly improved definition of the cardiac boundary [arrow, Fig. 5(c)] and the surrounding pulmonary structures [arrow, Fig. 5(g)]. Note in Fig. 5(g), the definition of airways that are at least fourth-order branches. The anatomic resolution with the use of ventilatory and cardiac gating is very nearly equal to that when there is no physiologic motion, i.e., when the animal is dead [Figs. 5(d) and 5(h)]. Note the subtle shift in the pulmonary structures and narrowing of the airways upon death [arrow, Fig. 5(h)].
Fig. 5.

Coronal slices are shown at the same level from four studies done on the same mouse. The lower images show the left lung from each image magnified by 3×. (a) and (e) are from the ungated study. (b) and (f) were obtained with ventilatory synchronization; (c) and (g) were obtained with ventilatory synchronization and cardiac gating; (d) and (h) were obtained on the same animal after sacrifice with an anesthetic overdose.
The isotropic resolution can be used to advantage in verifying the structures. Figure 6 shows axial and coronal slabs that have been oriented obliquely to follow the main stem bronchus allowing one to track the branching airways and determine from the coronal slab, the level of airway seen in the axial. Each slice is rendered from four contiguous pixels (i.e., the slice thickness is 400 μm), thus presenting a larger slice through which one can track the airways and vessels. In these two images, one sees vena cava (VC) descending aorta (DA), right (RB), and left (LB) pulmonary bronchi and associated bronchial vessels, and the gall bladder. These images show room for improvement. Note the streaks off the ribs, probably arising from beam hardening and imperfect alignment. In some slices, telltale circles suggest the need for more careful gain equalization. Work is currently under way to make these improvements.
Fig. 6.
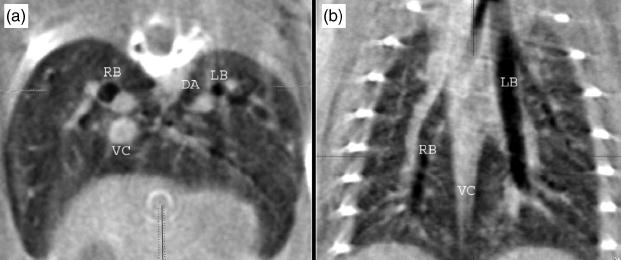
Axial and coronal 400 μm slabs extracted from the study with ventilatory and cardiac gating providing detailed anatomy of the thorax: vena cava (VC), descending aorta (DA), right (RB) and left (LB) pulmonary bronchi and associated bronchial vessels, and the gall bladder.
IV. DISCUSSION AND CONCLUSIONS
Motion and photon fluence rate are the two most important determinants of the image quality in micro-CT. Current work under way in our laboratory suggests that with proper care, the position of the heart and diaphragm can be reliably reproduced through the course of a physiologically controlled study to ~100 μm.14 Ford et al.15 have recently reported the characteristics of a commercial system with a microfocal x-ray tube operating at 80 kVp and 0.1 mA yielding a fluence rate at the detector of 2.6×10⁷ photons/mm2 s. The angiographic tube used in this work, operating at 80 kVp, 100 mA produced an exposure of 70 mR at the detector in a 10 ms exposure or ~1.5×10⁹ photons/mm2 s, i.e., a fluence rate that is 57 times higher. The tube is capable of operating at 620 mA, i.e., a fluence nearly 250 times greater than the microfocal tubes.
The fundamental resolution limits in the system described here are imposed by the precision with which pulmonary and cardiac motion are repeatable across the time course of a study (10–20 min) and motion during a single exposure. Recent work has shown the reproducibility to be on the order of 50–100 μm.14 The beating heart of a mouse moves as much as 2 mm through the course of one cardiac cycle. Given that diastole is ~50% of the 100 ms R-R interval, the exposure time must be less than 50 ms in order to minimize the impact of cardiac motion. As seen in Fig. 5, the impact of cardiac motion is seen in the lung even if ventilatory synchronization is used. This is not surprising given the motion that the heart must induce in the surrounding lung parenchyma. Thus to minimize these effects, one must have a fluence rate that is significantly higher than available from microfocal tubes. For spatial resolution ~100 μm, imposed by the reproducibility of the motion control, the 1 mm focal spot delivers a fluence rate 250× higher than that available from microfocal spot tubes. The gain is less dramatic as one seeks higher spatial resolution, which might be attainable outside the thoracic cavity. But even at 25-μm resolution, there are still flux gains from 0.3/1.0 mm focal spots that can be obtained for rotating anodes.
Compensation for both cardiac and ventilatory motion is essential for successful pulmonary imaging. Cavanaugh et al. have demonstrated ventilatorygated micro-CT with exposure integration periods of 100 ms.5 But as is demonstrated in Fig. 5, the cardiac motion can have a substantial impact on the surrounding lung tissue. Prospective and retrospective gating are both possible. Retrospective gating has been particularly successful for magnetic resonance imaging, where one must match the cardiac cycle and the TR to keep the magnetization constant from view to view.16 A CT study to use both cardiac and ventilatory gating used prospective gating,17 which was easily implemented. The limitation when using a conventional third-generation geometry is that gating is accomplished while the gantry is moving at a constant angular velocity. Thus some views can be lost if there are any irregularities in the heartbeat. The major advantage of the geometry used here is that it allows prospective gating of both ventilatory and cardiac motion, since the period between views (angles) is not important. Moreover, the mouse is so small that the stepping motor can advance asynchronously. The use of the fixed gantry with the rotating animal is not without problems. Animal support is more difficult. The system is not well suited for high throughput. Radiation shielding is necessary. And some may argue that the vertical orientation of the animal is not natural. For the present, the benefit of a high fluence rate allowing reduction of cardiac blur appears to outweigh these disadvantages in those studies of the thorax requiring the highest possible spatial resolution.
The use of micro-CT in cardiopulmonary studies of the mouse has been limited to date because of the lack of appropriate instrumentation and the challenges of physiological support. While studies of the mouse heart and lungs have been successful using magnetic resonance imaging (MRI), they are very challenging for many of the same reasons seen in this work.18–20 MR of the lung is particularly difficult because of magnetic susceptibility and the very limited proton density in the lung.21 The lung is a very appealing target for micro-CT, since the CT contrast is high. Dose, a major concern in micro-CT, will be relatively low because of the inherent low (radiographic) density. The approach outlined here has addressed two of the most critical barriers making high quality micro-CT of the mouse cardiopulmonary system much more accessible.
Acknowledgments
All work was performed at the Duke Center for In Vivo Microscopy, a NCRR National Resource (P41 RR05959). Additional support was provided by NCI (R24-CA 92656) and a grant from the Department of Defense (DoD-DAMD 17-02-2-0004). The authors would like to thank Ted Wheeler for animal support.
References
- 1.Jorgensen SM, Demirkaya O, Ritman EL. “Three-dimensional imaging of vasculature and parenchyma in intact rodent organs with X-ray micro-CT,”. Am J Physiol. 1998;275:H1103–1114. doi: 10.1152/ajpheart.1998.275.3.H1103. [DOI] [PubMed] [Google Scholar]
- 2.Ritman EL. “Molecular imaging in small animals—roles for micro-CT,”. J Cell Biochem Suppl. 2002;39:116–24. doi: 10.1002/jcb.10415. [DOI] [PubMed] [Google Scholar]
- 3.Paulus MJ, et al. “High resolution X-ray computed tomography: an emerging tool for small animal cancer research,”. Neoplasia. 2000;2:62–70. doi: 10.1038/sj.neo.7900069. [DOI] [PMC free article] [PubMed] [Google Scholar]
- 4.Kennel SJ, et al. “High resolution computed tomography and MRI for monitoring lung tumor growth in mice undergoing radioimmunotherapy: correlation with histology,”. Med Phys. 2000;27:1101–1107. doi: 10.1118/1.598974. [DOI] [PubMed] [Google Scholar]
- 5.Cavanaugh D, et al. “In vivo respiratory-gated micro-CT imaging in small-animal oncology models,”. Molecular Imaging. 2004;3:55–62. doi: 10.1162/15353500200403184. [DOI] [PubMed] [Google Scholar]
- 6.Holdsworth DW, Thornton MM. “Micro-CT in small animal and specimen imaging,”. Trends Biotechnol. 2002;20:S34–39. [Google Scholar]
- 7.Paulus MJ, et al. “A review of high-resolution X-ray computed tomography and other imaging modalities for small animal research,”. Lab Anim. 2001;30:36–45. [PubMed] [Google Scholar]
- 8.Wang G, Vannier M. “Micro-CT scanners for biomedical applications: An overview,”. Adv Imaging Electron Phys. 2001;16:18–27. [Google Scholar]
- 9.Feldkamp LA, Davis LC, Kress JW. “Practical cone-beam algorithm,”. J Opt Soc Am A. 1984;1:612–619. [Google Scholar]
- 10.Hedlund LW, Johnson GA. “Mechanical ventilation for imaging the small animal lung,”. ILAR J. 2002;43:159–174. doi: 10.1093/ilar.43.3.159. [DOI] [PubMed] [Google Scholar]
- 11.Hedlund LW, et al. “MR-compatible ventilator for small animals: computer-controlled ventilation for proton and noble gas imaging,”. Magn Reson Imaging. 2000;18:753–759. doi: 10.1016/s0730-725x(00)00154-5. [DOI] [PubMed] [Google Scholar]
- 12.Parker DL. “Optimal short scan convolution reconstruction for fan beam CT,”. Med Phys. 1982;9:254–257. doi: 10.1118/1.595078. [DOI] [PubMed] [Google Scholar]
- 13.Standard Test Method for Measurements of Computed Tomography (CT) System Performance (American Society for Testing and Materials, Philadelphia, 1995).
- 14.W. Mai et al., “Effects of breathing motion on the spatial resolution in microscopic imaging techniques of rodents,” Proceedings of the IEEE International Symposium on Biomedical Imaging, pp. 472–476 (2004).
- 15.Ford NL, Thornton MM, Holdsworth DW. “Fundamental image quality limits for microcomputed tomography in small animals,”. Med Phys. 2003;30:2869–2877. doi: 10.1118/1.1617353. [DOI] [PubMed] [Google Scholar]
- 16.Glover GH, Pelc NJ. “A rapid-gated cine MRI technique,”. Magn Reson Annu. 1988:299–333. [PubMed] [Google Scholar]
- 17.Johnson GA, Godwin JD, Fram EK. “Gated multiplanar computed tomography,”. Radiology. 1982;145:195–197. doi: 10.1148/radiology.145.1.7122877. [DOI] [PubMed] [Google Scholar]
- 18.Slawson SE, et al. “Cardiac MRI of the normal and hypertrophied mouse heart,”. Magn Reson Med. 1998;39:980–987. doi: 10.1002/mrm.1910390616. [DOI] [PubMed] [Google Scholar]
- 19.Schneider JE, et al. “Rapid identification and 3D reconstruction of complex cardiac malformations in transgenic mouse embryos using fast gradient echo sequence magnetic resonance imaging,”. J Mol Cell Cardiol. 2003;35:217–222. doi: 10.1016/s0022-2828(02)00291-2. [DOI] [PubMed] [Google Scholar]
- 20.B. T. Chen, A. T. Yordanov, and G. A. Johnson, “Ventilation-synchronous MR microscopy of pulmonary structure and ventilation in mice,” Magn. Reson. Med. (in press 2004). [DOI] [PubMed]
- 21.Gewalt SL, et al. “MR miscroscopy of the rat lung using projection reconstruction,”. Magn Reson Med. 1993;29:99–106. doi: 10.1002/mrm.1910290117. [DOI] [PubMed] [Google Scholar]