Abstract
Low efficiency of transfection is often the limiting factor for acquiring conclusive data in reporter assays. It is especially difficult to efficiently transfect and characterize promoters in primary human cells. To overcome this problem we have developed a system in which reporter gene expression is quantified by flow cytometry. In this system, green fluorescent protein (GFP) reporter constructs are co-transfected with a reference plasmid that codes for the mouse cell surface antigen Thy-1.1 and serves to determine transfection efficiency. Comparison of mean GFP expression of the total transfected cell population with the activity of an analogous luciferase reporter showed that the sensitivity of the two reporter systems is similar. However, because GFP expression can be analyzed at the single-cell level and in the same cells the expression of the reference plasmid can be monitored by two-color fluorescence, the GFP reporter system is in fact more sensitive, particularly in cells which can only be transfected with a low efficiency.
INTRODUCTION
Understanding the mechanisms controlling transcription of a gene requires the identification and characterization of its cis-acting regulatory elements. In mammalian cells, transient transfection of plasmids in which a reporter gene is expressed under the control of a fragment of the gene to be analyzed is widely used for this purpose. Following transfer of the reporter construct into cells, the expression of the reporter gene is monitored by measuring the amount of reporter mRNA, of the reporter protein itself or its enzymatic activity. The commonly used reporters include chloramphenicol acetyltransferase, β-galactosidase, firefly or renilla luciferase, alkaline phosphatase or green fluorescent protein (GFP). GFP is unique in that the GFP fluorophore spontaneously forms intracellularly without added cofactors (1). Therefore, the emitted fluorescence intensity provides a direct readout of GFP expression (2) that can be measured at the single-cell level without any processing steps. Flow cytometry analysis of GFP was used for monitoring expression of inducible reporters (3) and for detecting time-dependent IκB degradation (4). Recently, the combination of enhanced intensity of GFP fluorescence (5) with destabilization of the GFP protein (6) improved the detection reliability of GFP fluorophore, principally in induction studies.
Most efforts to map cis-acting regulatory elements have made use of cell lines that can be transiently transfected with a sufficiently high efficiency to permit the use of the standard reporter systems. As cell lines are never completely normal, the results obtained are always subject to some reservations. The most important of these could be avoided if normal cells were used as recipients. But the transfection efficiency of most normal cell types is not sufficiently high, even when more recently developed transfection reagents are used. Here we describe a system that overcomes this problem by permitting the quantification of the expression of reporter constructs as well as that of a reference plasmid at the single-cell level. With this approach we can reliably measure the activity of weak promoters in primary human lung fibroblasts.
MATERIALS AND METHODS
Cells
Primary human embryonic lung fibroblasts (HLF, a generous gift of Urs Ziegler, University Hospital, Zürich), a fibrosarcoma-derived line (HT1080, kindly provided by Ian Kerr, ICRF, London) and Phoenix packaging cells derived from the 293 cell line (a gift of Garry Nolan, Stanford University, CA) were maintained in high glucose DMEM with 10% fetal calf serum.
Plasmids
pSV2Thy-1.1 expresses the mouse Thy-1.1 allele under the control of the SV40 enhancer and early promoter (7). The luciferase reporters pGL3 Basic (no eukaryotic promoter), pGL3 Promoter (SV40 promoter), pGL3 Promoter and Enhancer (SV40 promoter and enhancer) and the renilla reporter, pRL-SV40, were purchased from Promega. pRL-SV40 contains the renilla gene under the control of the SV40 early promoter and enhancer. To generate the GFP reporter vectors pd2G (basic vector), pSVd2G (promoter vector) and pSVEd2G (promoter/enhancer vector), we replaced the HindIII/XbaI fragment containing the luciferase gene of pGL3 by the HindIII/XbaI fragment of pEGFP-N1 (Clontech) containing the EGFP gene. The GFP gene was destabilized by adding the degradation domain of MODC as described by Clontech (6). The half-lives of the GFP and luciferase proteins are 2 and 3 h, respectively (6,8).
Transfections
Transient transfections with calcium-phosphate precipitates were performed according to Jordan et al. (9). In the standard protocol, cells were co-transfected with 1 µg pSV2Thy-1.1 as reference plasmid and 1–5 µg of GFP reporters. To compare the GFP with the luciferase system, cells were co-transfected with 0.3 µg of pRL-SV40 and 1–5 µg of pGL3 Promoter constructs. The total amount of plasmid DNA was kept constant (6 µg) by adding pUC19 plasmid DNA.
Determination of reporter expression
Reporter expression was determined 40 h after transfection. For GFP and Thy-1.1 assays, cells were harvested by trypsinization, incubated for 30 min with a saturating concentration of allophycocyanin (APC)-labeled anti-Thy-1.1 antibody III-5 (10), kindly prepared by Céline Maréchal, and washed once. We analyzed the cells on a FACScalibur microflow cytometer (Becton Dickinson, Franklin Lakes, NJ). Using forward and side scatter parameters we eliminated dead cells and debris from the analysis. GFP was excited by an argon laser and fluorescence was detected using a 530/30 nm bandpass filter in the FL1 channel. APC was excited by a red diode laser and fluorescence emission was detected using a 661/16 nm bandpass filter in the FL4 channel. For dual luciferase-renilla assays, cells were lysed in the Passive Lysis Buffer (Promega). The assay was performed on a Luminometer (Lumac, Biocounter M2500, MWG) as described by Promega.
RESULTS AND DISCUSSION
Flow cytometry analysis of the GFP reporter system
Our reporter system consists of two plasmids: a GFP reporter that is used to test the regulatory role of segments of the gene to be analyzed, and a plasmid (pSV2Thy-1.1) that encodes the murine Thy-1.1-cell surface marker. This antigen is resistant to the trypsin concentrations used to detach the cells (data not shown) and its expression can be quantified by labeling the cells with an APC-coupled anti-Thy-1.1 antibody.
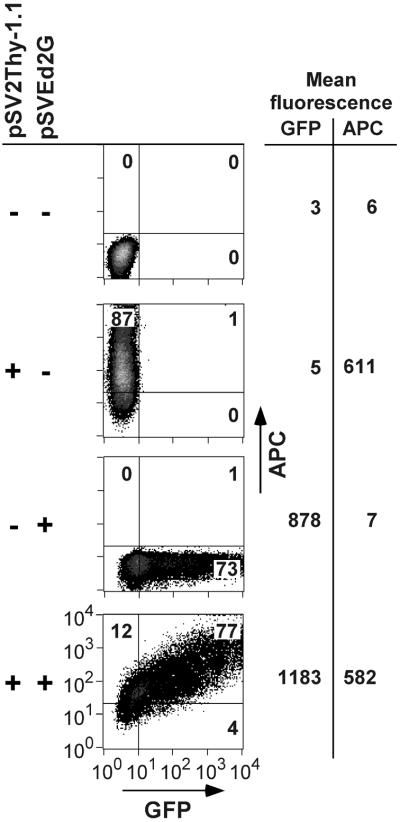
To determine whether GFP could be used as a reporter gene, we co-transfected GFP and pSV2Thy-1.1 reporters into Phoenix cells and analyzed the GFP and Thy-1.1 expression by two-color flow cytometry 40 h after transfection. Forward and side scatter signals were used to restrict the analysis to viable cells. GFP fluorescence intensity (FL1, x-axis) was plotted on a log scale against the fluorescence intensity (FL4, y-axis) due to APC-coupled anti-Thy-1 antibody (Fig. 1). Signal amplification was set so that background fluorescence of non-expressing cells was below 10 (3 for GFP and to 6 for Thy-1.1) (Fig. 1). Thus, for both reporter plasmids 1000-fold differences in expression levels over background could be measured. Figure 1 shows that the GFP and APC signals can be separated over the entire range of signal intensity. In preliminary experiments we used a phycoerythryn (PE)-labeled anti-Thy-1 antibody, but we found that it was impossible to compensate completely for the spill-over of the GFP fluorescence into the FL2 channel used to detect the PE signal. This problem could be avoided by switching to an APC–anti-Thy-1 conjugate.
Figure 1.
Two-color flow cytometry analysis of GFP reporter expression. Density plots of phoenix cells transfected with pUC19 alone, pSV2Thy-1.1 alone, pSVEd2G alone, or co-transfected with pSVEd2G and pSV2Thy-1.1. Reporter expression was analyzed 40 h after transfection. GFP fluorescence (x-axis) and Thy-1.1 surface expression, detected by an APC-labeled anti-Thy-1 antibody (y-axis), were analyzed by two-color flow cytometry. The numbers in the quadrants indicate the percentages of viable cells expressing pSV2Thy-1.1 alone, pSVEd2G alone, or pSVEd2G and Thy-1.1. The mean GFP and APC fluorescence intensities (arbitrary units) of the entire cell populations are indicated on the right.
When co-transfected with both plasmids, most cells emit GFP and APC fluorescence; they appear in the upper right quadrant (Fig. 1). With lower amounts of pSVEd2G, GFP positive cells were found preferentially among the population expressing high levels of Thy-1.1. These results are expected for transfection with calcium-phosphate precipitates, but the percentage of cells expressing both plasmids was similar when other, liposome-based methods [Fugene 6 (Roche), Lipofectamin 2000 (Gibco), Effectene (Qiagen)] were tested (data not shown). The distribution of APC fluorescence intensity was not influenced by co-transfection of the GFP reporter into the same cells, indicating that the pSV2Thy-1.1 promoter activity was not affected by pSVEd2G (Fig. 1, 3). Thus, there is no evidence for competition of transcription factors between the two SV40-based promoters.
Comparison of GFP and luciferase reporter systems
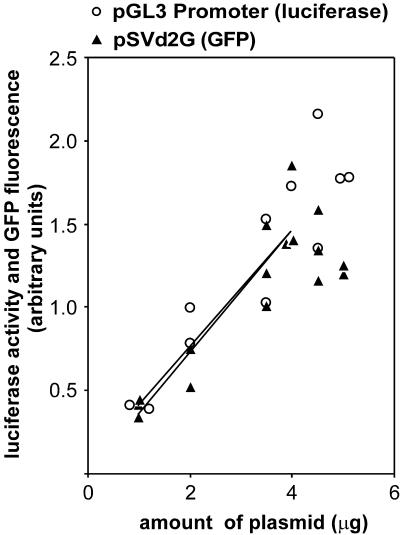
To directly compare the luciferase and GFP reporter systems expression vectors containing the same backbone but coding either for GFP (pSVd2G) or luciferase (pGL3 Promoter) were transfected into the fibrosarcoma cell line HT1080. Destabilized GFP and luciferase have similar half-lives of ∼2–3 h (6,8). For the luciferase reporter assay, HT1080 cells were co-transfected with the firefly luciferase reporter pGL3 Promoter and pRL-SV40 as reference for transfection efficiency. pRL-SV40 contains the renilla gene under the control of the early promoter and enhancer of SV40, and is thus comparable with pSV2Thy-1.1. Forty hours after transfection cells were lysed and enzymatic activity was measured using the dual luciferase assay (Promega). Background activity, measured in cells expressing only renilla luciferase, was subtracted from the firefly luciferase activity of each transfected sample. To normalize for transfection efficiency, this value was divided by the renilla luciferase value of the same sample. The values obtained from the flow cytometry analysis of cells co-transfected with pSVd2G and pSV2Thy-1.1 were subjected to analogous operations, i.e. we subtracted from the arithmetic mean of GFP expression the background obtained with cells transfected only with pSV2Thy-1.1. To normalize for transfection efficiency, this value was divided by the equivalent measure for Thy-1.1 expression in the same cells. Because 3.3 times less renilla plasmid was used, the GFP/APC ratio was multiplied by 3.3 in the plot shown in Figure 2. Reporter gene expression increased linearly and with the same rate when 1–4 µg of pSVd2G or pGL3 Promoter was transfected (Fig. 2). By comparing several experiments, we found that above 4 µg of plasmid, the increase in reporter expression was no longer linear in either system. These results indicate that in HT1080 cells the GFP system monitors promoter activity with similar sensitivity as the dual luciferase system, when between 1 and 4 µg of plasmids were transfected.
Figure 2.
Comparison of GFP-Thy-1.1 and luciferase-renilla reporter systems. HT1080 were transfected with 1–5 µg of pSVd2G (GFP) and 1 µg of pSV2Thy-1.1 or with 1–5 µg of pGL3 Promoter (luciferase) and 0.3 µg of pRL-SV40. The expression of pSVd2G and of pGL3 Promoter reporters (F), normalized to that of their respective control plasmids (pSV2Thy-1.1 and pRL-SV40) is plotted against the amount of plasmid (A) used for transfection. The following regression lines and correlation coefficients were obtained when between 1 and 4 µg pSVd2G or pGL3 Promoter were transfected: F = 0.037A + 0.0022 (R2 = 0.84) for pSVd2G and F = 0.036A + 0.0049 (R2 = 0.74) for pGL3 Promoter.
Measuring reporter expression in cells transfected with low efficiency
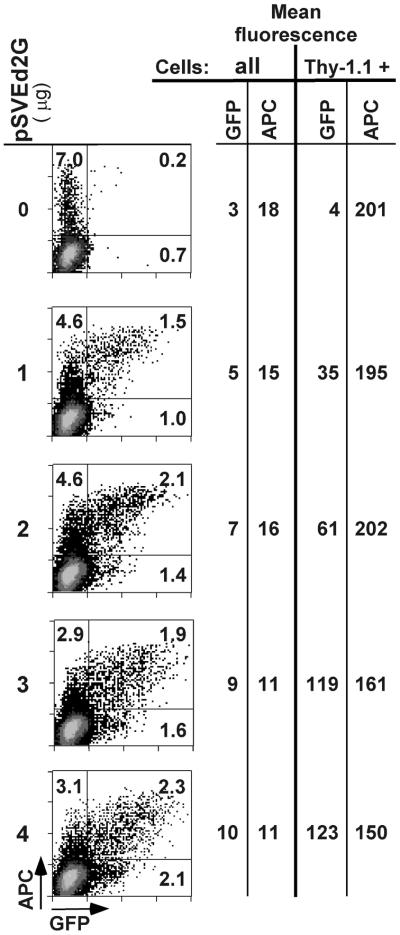
Flow cytometry allows quantification of reporter gene expression in every cell of the transfected population. When cells are co-transfected with a reference plasmid, such as pSV2Thy-1.1, analysis of reporter gene expression can be restricted to cells that express the reference plasmid and are therefore likely to have been successfully co-transfected with the reporter plasmid. This is particularly useful when transfection efficiency is low. Only 5–10% of HLF cells co-transfected with pSVEd2G and pSV2Thy-1.1 expressed the reference plasmid (Fig. 3), and the mean GFP fluorescence intensity of the entire population was close to background. When analysis of GFP expression was restricted to Thy-1.1 positive cells, mean GFP intensity was not only much higher but also directly proportional to the amount of transfected pSVEd2G plasmid. As shown in Figure 3, between 1 and 3 µg of pSVEd2G, the increase in GFP fluorescence intensity was linearly related to the amount of transfected plasmid. Thus, the GFP reporter system allows the analysis of reporters even in cells with a very low transfection efficiency, provided enough cells are analyzed to accumulate statistically significant data.
Figure 3.
Analysis of normal human lung fibroblasts that cannot be transfected with high efficiency. 50 000 to 100 000 cells of each sample were passed through the flow cytometer. The horizontal line separates the Thy-1.1-expressing cells from the negative cells. The numbers in the quadrants indicate the percentages of viable cells expressing Thy-1.1 alone (upper left quadrant), pSVEd2G alone (lower right quadrant) or pSVEd2G and Thy-1.1 (upper right quadrant). The mean GFP and APC fluorescence intensities of the entire populations (all) and of the Thy-1.1-expressing (Thy-1.1 +) cells are indicated on the right.
In summary, our results show that the GFP-based reporter system described here has a similar sensitivity as the luciferase system (Fig. 2), and the system can be used to measure reporter expression like an enzyme-based system. But because GFP expression can be quantified in single cells by flow cytometry, the system allows monitoring of transfection efficiency as well as of heterogeneity in reporter expression (Fig. 1). We show that by restricting analysis of reporter expression to cells that express a reference plasmid, reporter expression can be reliably quantified even in normal cells that cannot be transfected with high efficiency. As flow cytometry can be combined with cell sorting, the system has other interesting applications, e.g. in situations in which one wants to measure the effect of a transiently transfected plasmid on a resident cellular gene or on a co-transfected reporter.
Acknowledgments
ACKNOWLEDGEMENTS
We thank Colleen Kelleher (ISREC) for critically reading the manuscript, Urs Ziegler (University Hospital, Zürich) for HLF cells, Ian Kerr (ICRF, London) for HT1080, Garry Nolan (Stanford University, CA) for Phoenix cells, Martin Jordan (EPFL, Lausanne) for help with the calcium-phosphate transfection protocols, Céline Maréchal and Anne Wilson (Ludwig institute, Lausanne) for APC-labeled αThy-1 antibody and Pierre Zaech (Ludwig institute, Lausanne) for help with the flow cytometry instruments. This work was supported in part by Cancer Research Switzerland, the Fifth Framework Programme (Contract no. QLG1-1999-01341) of the European Union (via the Bundesamt für Bildung und Wissenschaft, Bern), the Swiss National Science Foundation and the Roche Research Foundation.
REFERENCES
- 1.Heim R., Prasher,D.C. and Tsien,R.Y. (1994) Wavelength mutations and postranslational autooxidation of green fluorescent protein. Proc. Natl Acad. Sci. USA, 91, 12501–12504. [DOI] [PMC free article] [PubMed] [Google Scholar]
- 2.Cheng L., Fu,J., Tsukamoto,A. and Hawley,R.G. (1996) Use of green fluorescent protein variants to monitor gene transfer and expression in mammalian cells. Nat. Biotechnol., 14, 606–609. [DOI] [PubMed] [Google Scholar]
- 3.Anderson M.T., Tjioe,I.M., Lorincz,M.C., Parks,D.R., Herzenberg,L.A. and Nolan,G.P. (1996) Simultaneous fluorescence-activated cell sorter analysis of two distinct transcriptional elements within a single cell using engineered green fluorescent proteins. Proc. Natl Acad. Sci. USA, 93, 8508–8511. [DOI] [PMC free article] [PubMed] [Google Scholar]
- 4.Li X., Fang,Y., Zhao,X., Jiang,X., Duong,T. and Kain,S.R. (1999) Characterization of NFkappaB activation by detection of green fluorescent protein-tagged IkappaB degradation in living cells. J. Biol. Chem., 274, 21244–21250. [DOI] [PubMed] [Google Scholar]
- 5.Yang T.T., Cheng,L. and Kain,S.R. (1996) Optimized codon usage and chromophore mutations provide enhanced sensitivity with the green fluorescent protein. Nucleic Acids Res., 24, 4592–4595. [DOI] [PMC free article] [PubMed] [Google Scholar]
- 6.Li X., Zhao,X., Fang,Y., Jiang,X., Duong,T., Fan,C., Huang,C.C. and Kain,S.R. (1998) Generation of destabilized green fluorescent protein as a transcription reporter. J. Biol. Chem., 273, 34970–34975. [DOI] [PubMed] [Google Scholar]
- 7.Wilson J.M., Fasel,N. and Kraehenbuhl,J.P. (1990) Polarity of endogenous and exogenous glycosyl-phosphatidylinositol-anchored membrane proteins in Madin–Darby canine kidney cells. J. Cell Sci., 96, 143–149. [DOI] [PubMed] [Google Scholar]
- 8.Thompson J.F., Hayes,L.S. and Lloyd,D.B. (1991) Modulation of firefly luciferase stability and impact on studies of gene regulation. Gene, 103, 171–177. [DOI] [PubMed] [Google Scholar]
- 9.Jordan M., Schallhorn,A. and Wurm,F.M. (1996) Transfecting mammalian cells: optimization of critical parameters affecting calcium-phosphate precipitate formation. Nucleic Acids Res., 24, 596–601. [DOI] [PMC free article] [PubMed] [Google Scholar]
- 10.MacDonald H.R., Bron,C., Rousseaux,M., Horvath,C. and Cerottini,J.C. (1985) Production and characterization of monoclonal anti-Thy-1 antibodies that stimulate lymphokine production by cytolytic T cell clones. Eur. J. Immunol., 15, 495–501. [DOI] [PubMed] [Google Scholar]


