Abstract
Monofunctional, p-isothiocyanatophenyl-derivatives of platinum (II)-coproporphyrin-I (PtCP-NCS) were evaluated as phosphorescent labelling reagents for synthetic oligonucleotides containing a 3′- or 5′-amino modification. Synthesis and purification conditions were optimised to generate high yields and purity of PtCP-labelled oligonucleotide probes. Phosphorescent properties of the PtCP label have been shown to be largely unaffected by conjugation to oligonucleotides of various length, GC composition and label attachment site. 5′-PtCP-labelled oligonucleotides were shown to work efficiently as primers in a standard PCR. A dedicated 532 nm laser-based time-resolved fluorescence plate reader enabled highly sensitive detection of PtCP-labelled oligonucleotides and PCR products, both in solution and in agarose gels, with limits of detection in the order of 0.3 pM. A model system employing two complementary oligonucleotides labelled with PtCP and QSY® 7 dye (dark quencher) showed strong (∼20-fold) and specific proximity quenching of PtCP label upon hybridisation in solution. The potential applications of PtCP-labelled probes in hybridisation assays were discussed.
INTRODUCTION
Fluorescent probes are now in widespread use in various formats of DNA/RNA assays, which exploit the high affinity and specificity of nucleic acid hybridisation and/or the possibility of target amplification (1,2). Fluorescently labelled probes are used in a variety of applications, including DNA sequencing, fluorescence in situ hybridisation (FISH), gene arrays, PCR, real-time PCR, etc. (3–14).
Although in many cases the probes provide satisfactory performance in such assays, sensitivity of conventional fluorescent labels, such as fluorescein, rhodamine and alike (15), is less than optimal when compared with radioisotope and enzyme labels (1,16). At the same time, long-lived luminescent labels and time-resolved fluorescence detection allow the suppression of background interferences (scatter ing and autofluorescence), thereby significantly enhancing signal-to-noise ratio and overall sensitivity (17). The principle applications of time-resolved fluorescence measurements have focused upon the lanthanide chelate labels, in particular Eu(III), Sm(III) and Tb(III). Exceptionally long fluorescence lifetimes (50–1000 µs) and large Stokes’ shifts provide these labels superior sensitivity compared to conventional fluorophores (18–20). Probes on the basis of lanthanide labels have been used in DNA/RNA assays, for example in PCR (5–8), western blots (20), FISH (21) and real-time PCR schemes (22). However, the disadvantages of lanthanide labels include the need of UV excitation, complex label chemistry and high assay costs.
Phosphorescent Pt(II)- and Pd(II)-coproporphyrins provide an alternative to lanthanide labels (23). Spectral properties of MeCP labels including long emission lifetimes (100–1000 µs), longwave excitation bands (360–400 nm, molar absorption >105 M–1 cm–1, and 520–550 nm, molar absorption ∼4 × 10⁴ M–1 cm–1, also compatible with 532 nm lasers) and red emission (620–700 nm) make them promising for various applications. Phosphorescent porphyrin labels have demonstrated high potential in applications such as solid-phase immunoassays (24–27), time-resolved microscopy (27,28) and FISH (29). However, previous methods of labelling of biomolecules with MeCP were cumbersome and have been reported to mediate the production of coproporphyrin aggregates with compromised reactivity and a mixture of chemically reactive species of unknown chemical composition (24,27).
The preparation of pure mono-functionalised labelling reagents, p-isothiocyanatophenyl derivatives of MeCP (MeCP-NCS), has recently been described (30). The availability of these labelling reagents has prompted the development of dedicated instrumentation and bioassays. A 532 nm laser-based plate reader, optimised for sensitive time-resolved phosphorescent detection of MeCP labels, has been described recently (26), which provides sensitivity for PtCP label comparable with europium chelates in DELFIA (31). Avidin, neutravidin and antibodies have been successfully labelled with PtCP-NCS and the resulting conjugates have been evaluated in time-resolved immunoassay detection systems (25). But, so far, applications of monofunctional MeCP derivatives have principally concentrated on protein labelling.
In this work, we report a simple method for the labelling of synthetic oligonucleotides with PtCP, purification procedure and spectroscopic characterisation of the resulting conjugates. Using simple model systems and time-resolved phosphorescent detection, the potential of these phosphorescent oligonucleotide probes was evaluated in several different formats of hybridisation assays, including PCR with labelled primers and homogenous hybridisation assays employing PtCP and quencher labelled complementary oligonucleotide probes.
MATERIALS AND METHODS
Materials
PtCP-NCS (97% purity by HPLC), synthesised according to the method of Soini et al. (30), was kindly provided by Arctic Diagnostics Oy (Turku, Finland). Synthetic oligonucleotides; 5′- or 3′-amino modified or 3′-C44H39Cl2N4O4S (QSY® 7) labelled (purity tested by MALDI) were from MWG-Biotech (Ebersberg, Germany). Triethylammonium acetate buffer solution (TEAA, 1 M) was from Alkem (Cork, Ireland). NAP™-5 columns (DNA grade Sephadex™ G-25) were from Amersham Pharmacia Biotech AB (Buckinghamshire, UK). Three millilitre acrylic cuvettes for fluorescent measurements were from Sarstedt (Wexford, Ireland). Glass vial inserts (0.2 ml), 0.45 µm PVDF disposable filter units with luer-lock fitting, agarose (electrophoresis grade), Tris-acetate EDTA (TAE) buffer, HPLC grade acetonitrile and dimethylsulfoxide, tris(hydroxymethyl)aminomethane, cetyltrimethylammoniumbromide (CTAB) were from Sigma-Aldrich (Dublin, Ireland). PCR reagents, dNTP mix, 10× hybridisation buffer, 25 mM MgCl2 solution, Taq polymerase, were obtained from Promega (Medical Supply Company, Dublin, Ireland). PCR supermix was purchased from Invitrogen (Paisley, UK). PCR purification kits and gel extraction kits were provided by QIAgen (Sussex, UK).
Labelling of oligonucleotides
Labelling of oligonucleotides was carried out under various conditions, as described in the Results and Discussion. In an optimised protocol, a stock of amino-modified oligonucleotide in Millipore™ grade water was diluted in 0.1 M borate buffer, pH 9.5 to a concentration of 0.18 mM. PtCP-NCS was dissolved in anhydrous DMSO (18 mM) and then aliquoted into a clean, dry, glass vial insert. The solution of oligonucleotide was then added to the vial to achieve a final concentration of 90 µM and a dye/oligonucleotide molar ratio of 14:1. The vial was then crimped to seal and incubated overnight at 37°C in an OV3 hybridisation oven (Biometra) under continuous shaking.
Purification
Chromatographic analysis and purification of reaction mixtures were carried out by reverse phase HPLC, using HP1100™ series system (Agilent) consisting of a quaternary pump, diode array photometric detector, autosampler, PC with Chemstation™ software. Analytical chromatography was performed on a Supelcosil LC-18 column, 250 × 2.1 mm, 5 µm (Supelco), using a linear 0–50% gradient of acetonitrile in 0.1 M TEAA pH 6.5 over 25 min at a flow rate of 0.4 ml/min. Samples were diluted 1:25 with starting buffer and injected in 5 µl volume. Preparative separation involved a Hypersil ODS column, 250 × 4.6 mm, 5 µm (Supelco), flow rate of 1 ml/min and injections of up to 30 µl of crude reaction mixture. The peaks containing labelled oligonucleotides were identified by spectral analysis, collected and subsequently dried by vacuum centrifugation. The conjugate was then re-dissolved in a minimal volume and further purified on a NAP™-5 gel filtration column using 0.1 M Tris buffer, pH 7.4 containing 0.3 M NaCl. The fractions with characteristic absorption of the conjugate were collected, aliquoted and stored frozen at –70°C.
DNA amplification
19mer primers were designed to flank a 305 bp region of genomic template DNA. Forward primer was 5′-labelled with PtCP and purified as described above. PCR was carried out on a T1 thermocycler (Biometra) with heated lid using either PCR supermix or individual reaction components (Promega), in a final volume of 50 µl. Concentrations of primers (labelled and unlabelled) were maintained at 0.4 µM and between 1 and 10 ng of template DNA was added to the reaction mixture. Amplification thermocycling was set up as follows: 94°C for 2 min initial melting time followed by 35–40 cycles of: 58°C for 1 min, 72°C for 1 min and 94°C for 0.5 min. A final 2–5 min step at 72°C completed amplification. Negative controls containing no template DNA were run simultaneously.
Samples of PCR mixtures were run on a 1.5% agarose gel (in TAE) (∼50 ml) stained with ethidium bromide (EtBr) [0.001% (v/v)] with 6× loading dye (Promega) and electrophoresed for ∼20 min at 64 V on a Fast Mini Horizontal Gel Unit (SciePlas). A 100 bp DNA ladder (Promega) was used as a molecular weight marker. DNA samples were initially visualised under UV illumination using a GelDoc™ system with accompanying GeneSnap™ software (Syngene). PCR product was purified from crude reaction mixture using a QIAgen™ PCR purification kit and was quantified by UV absorbance measurements at 260 nm. Gel bands, visualised by EtBr staining and UV irradiation, were excised and PCR product was extracted using a Gel Extraction kit (QIAgen).
Spectral measurements
Absorption spectra (range 240–600 nm) were measured on an 8453 UV-VIS diode array spectrophotometer (Hewlett-Packard). Phosphorescence spectral measurements were carried out on a LS 50B luminescence spectrometer (Perkin-Elmer). Excitation and emission wavelengths were usually 380 and 650 nm, respectively, 5 nm slits and a 515 nm cut-off emission filter were used. Phosphorescence lifetimes were measured on the same apparatus using FLDM short phosphorescence decay software option (Perkin-Elmer). Emission quantum yield measurements were conducted according to the method described by O’Riordan et al. (26).
Time-resolved phosphorescence measurements
Microtitre-plate-based detection was carried out on the time-resolved fluorescence plate reader ArcDia (Arctic Diagnostics Oy) described in detail elsewhere (26). This instrument, which was custom-designed on the basis of commercial plate reader Fluoroscan Ascent (Thermo Labsystems Oy, Finland) for measurement of phosphorescence of PtCP label, contained a dedicated optical unit, which incorporated a 532 nm pulsed laser (10 mW; BremLas Lasertechnik, Germany), D645/20 bandpass filter (Chroma Technology, USA), a channel photomultiplier tube C952-P (Perkin-Elmer Optoelectronics) and accompanying software. Measure ments were carried out under the following conditions: laser flash duration, 5 µs; gate time, 100 µs; delay time, 50 µs; number of flashes, 1000 (integration time 0.2 s). For measurement of the luminescence decay curve on this instrument, channel width was set at 0.5 µs and the number of points set at 300. Lifetimes were calculated using single-exponential fit.
Time-resolved phosphorescence detection of labelled oligonucleotides and amplified PCR products in solution was performed in 40 mM Tris-acetate buffer, 2.5 mM EDTA (TAE), pH 7.6 with or without 50 mM sodium sulfite (Na2SO3) as a chemical de-oxygenator. Serial dilutions of labelled oligonucleotide were made in 96-well plates in 200 µl volume followed by measurement on the ArcDia reader. Standard curves were then plotted and limits of detection were calculated as the concentration that produces a signal three times the standard deviation of the background signal. To determine the sensitivity of time-resolved phosphorescent detection of the labelled oligonucleotides in agarose gels, 3-fold serial dilutions were constructed in TAE-sulfite pH 7.6 in a heating block, an equal volume of 2% agarose in TAE-sulfite buffer was added to each sample. Dilutions in agarose were then transferred to a 96-well microtitre plate, allowed to set and measured as above. Similarly, labelled PCR product cleaned from crude reaction mixture or extracted from agarose gel bands was measured on the ArcDia plate reader. Limits of detection were calculated as the concentration of PtCP-labelled probe generating a signal three times the standard deviation above the blank.
Hybridisation experiments in solution
Hybridisation assays were conducted on the LS-50B luminescence spectrometer in HYB buffer (10 mM Tris–HCl, 1 M NaCl, 10 mM MgCl2) containing 100 mM Na2SO3, pH 7.6, using 3 ml acrylic cells. The phosphorescent signal of PtCP label was measured in time-resolved mode under the following settings: delay time, 20 µs; gate time, 80 µs; excitation, 380 nm with 5 nm slit width; emission, 648 nm with 15 nm slit width; and emission cut-off filter, 515 nm.
To a concentration of 5 nM 5′ PtCP labelled oligonucleotide (sequence no. 1; Table 2), stepwise additions of complementary oligonucleotide, either unlabelled or 3′-labelled with QSY® 7, (sequence no. 9; Table 2) were made up to a final concentration of 10 nM. Emission intensities of PtCP were normalised with respect to the initial signal.
Table 2. Photophysical properties of oligonucleotide conjugates of PtCP-NCS.
| Sequence no. | Label/oligonucleotide sequence (5′–3′) | Relative quantum yielda | Lifetime (µs) |
|---|---|---|---|
| PtCP (free dye) | 100.0 | 89.3 ± 0.8 | |
| 1 | (PtCP)–TCT ATT TAA CCC CAG ACG | 82.1 | 94.5 ± 0.7 |
| 2 | (PtCP)–ATT TAA CCC CAG ACG | 82.1 | 88.3 ± 0.5 |
| 3 | (PtCP)–TAA CCC CAG ACG | 71.4 | 89.3 ± 1.0 |
| 4 | (PtCP)–A CCC CAG ACG | 78.0 | 86.3 ± 0.5 |
| 5 | TCT ATT TAA CCC CAG ACG–(PtCP) | 85.7 | 92.0 ± 1.1 |
| 6 | TCT ATT TAA CCC CAG–(PtCP) | 100.0 | 93.3 ± 0.5 |
| 7 | TCT ATT TAA CCC–(PtCP) | 78.6 | 93.5 ± 0.9 |
| 8 | TCT ATT TAA C–(PtCP) | 89.3 | 92.6 ± 0.3 |
| 9 | (PtCP)–CGT CTG GGG TTA AAT AGA | 78.0 | 88.1 ± 0.9 |
| 10 | CGT CTG GGG TTA AAT AGA–(PtCP) | 104.0 | 92.1 ± 0.5 |
aMeasured in 1 M NaCl/10 mM Tris/10 mM MgCl2 (HYB buffer)/100 mM Na2SO3 pH 7.6 relative to PtCP1 having an absolute quantum yield of 0.17 in CTAB/100 mM Na2SO3 pH 7.6 (26).
RESULTS AND DISCUSSION
Labelling of oligonucleotides with PtCP-NCS
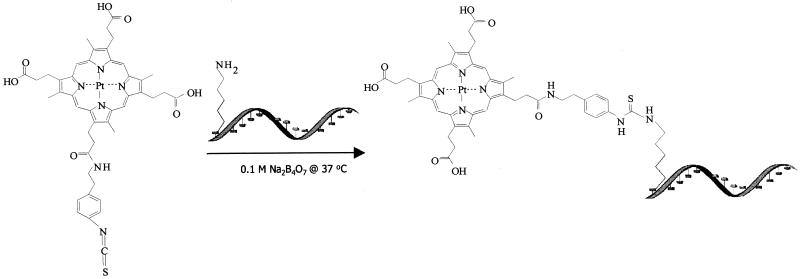
Phosphorescent labelling involves spontaneous formation of a stable thio-urea bond between the isothiocyanatophenyl moiety of PtCP-NCS and the free amino group linked via a 5–7 carbon spacer arm to the oligonucleotide (Fig. 1). Several protocols known to provide decent yields in labelling of oligonucleotides with other fluorescent dyes (1,15,27) were applied, but all were found to give low yields with PtCP-NCS. This was an unexpected result, as labelling of proteins with PtCP-NCS usually yields high conjugate return (25), although in the latter case label concentrations were much lower and reaction volumes larger.
Figure 1.
Structure of PtCP-NCS and general chemistry of conjugation with primary amine modified oligonucleotide.
In order to improve labelling yields, effects of the concentrations of reactants, buffer, pH, organic solvent content, temperature and other key factors were investigated. The use of borate buffer, high pH (9.5), low percentage of organic solvent and glass as opposed to plastic reaction vessels were found to be important factors in achieving high labelling yields. It appears that aggregation of PtCP-NCS caused low labelling yields with oligonucleotides. At high concentrations, dye was observed to precipitate on the sides of plastic reaction vessels thereby depleting the concentration of reactant in solution. Although the reaction volume is small (80–100 µl) and homogeneity of the solution is assumed, vigorous agitation of the reaction vessel during incubation has been shown to increase yields. An increase of organic solvent did not improve the yields, probably due to precipitation of oligonucleotide. The results are summarised in Table 1.
Table 1. Yields of oligonucleotide conjugate synthesised under different labelling conditions (overnight incubations).
| Method no. | [Oligo] (µM) | Molar ratio dye:oligo | % DMSO | Temperature (°C) | Buffer | pH | % Yield | Reference |
|---|---|---|---|---|---|---|---|---|
| 1 | 89.3 | 25:1 | 25 | 50 | Phosphate | 8 | <5 | de Haas et al. (27) |
| 2 | 589.0 | 25:1 | 66 | 37 | Phosphate | 9.5 | <5 | |
| 3 | 28.5 | 25:1 | 66 | 37 | HEPES | 10 | 7 | Kricka (1) |
| 4 | 89.3 | 25:1 | 6.6 | 37 | HEPES | 9 | <5 | |
| 5 | 28.5 | 25:1 | 66 | 37 | HEPES | 10 | 0 | |
| 6 | 178.6 | 15:1 | 14 | 25 | Borate | 8.8 | 7 | Haugland (15) |
| 7 | 178.6 | 15:1 | 14 | 37 | Borate | 9.5 | 70–90 | |
| 8 | 89.3 | 15:1 | 7 | 37 | Borate | 9.5 | 70–90 |
Phosphate, 50 mM Na-phosphate, 100 mM NaCl, 5 mM EDTA; HEPES, 125 mM HEPES/50% DMSO; Borate, 0.1 M Na-borate; reaction volume was usually 30–200 µl.
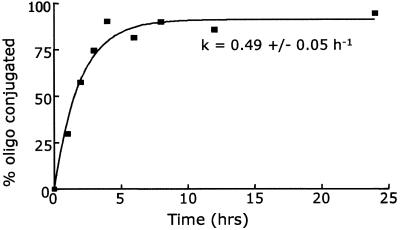
Following the optimisation of labelling conditions, the kinetics of the labelling reaction was investigated by HPLC analysis of reaction mixtures. Results shown in Figure 2 indicate that 4–5 h of incubation at 37°C is required to achieve labelling yields of 70–90%.
Figure 2.
Yield of PtCP-labelled 18mer oligonucleotide (sequence no. 1; Table 2) as a function of incubation time. Labelling conditions correspond to method 8 in Table 1. (Note: rate constant is extrapolated from a pseudo true first-order kinetics fit.)
Purification of PtCP-labelled oligonucleotide conjugates
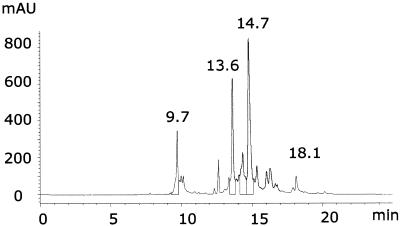
It is well established that coproporphyrins have an acid–base dissociation with pKa ∼5–6. Thus, below pH 5, dimer and aggregate formation occurs between protonated species, while above pH 6 coproporphyrins undergo sequential deprotonation of their side carboxylic groups (32). The presence of multiple protomeric forms can affect chromatographic behaviour and separation performance of PtCP-NCS and its conjugates. To minimise these effects on the reverse-phase column, the TEA buffer system was employed, which is known to provide an ion-pairing effect. This system, which is used for separation of oligonucleotides and their dye conjugates (15), was found to provide satisfactory performance for PtCP-NCS and its oligonucleotide conjugates. A typical chromatogram of the reaction mixture presented in Figure 3 shows sharp, reproducible and well resolved peaks. The conjugate peak (13.2 min) is well resolved from the peaks of free oligonucleotide and unreacted PtCP-NCS (9.7 and 18.1 min, respectively). Up to 30 µl of undiluted reaction mixture containing ∼15 µg of DNA can be separated on an analytical C18 column (250 × 4.6 mm, 5 µm) in one run.
Figure 3.
Typical preparative chromatogram of reaction mixture monitored at 260 nm. Peaks were identified as: unlabelled oligonucleotide at 9.7 min, PtCP-labelled oligonucleotide at 13.6 min, PtCP-NCS hydrolysis product at 14.7 min and unreacted PtCP-NCS dye at 18.1 min. Twenty-five microlitres of undiluted reaction mixture were injected.
At the same time, several peaks between 14 and 16 min, which are thought to be products of the hydrolysis of PtCP-NCS (have identical spectra), complicated preparative purification of the conjugate. Due to overlap of peaks, and the errors in collecting the conjugate fractions, the latter usually contained minor contamination of the free Pt-porphyrin (up to 10%, as shown by an analytical re-chromatogram). To eliminate any free porphyrin, fractions of the conjugate were further purified on a NAP™-5, gel filtration column using 0.1 M Tris–HCl buffer, pH 7.6 containing 0.3 M NaCl. In these conditions, the conjugate passed through the column in void volume, whereas the free porphyrin bound to the top of the column and was retained. Such a combined procedure (reverse phase HPLC and gel-filtration) yielded pure conjugate samples with no detectable free porphyrin impurities. These samples can be stored frozen in aliquots at –70°C for several months.
Spectral properties of conjugates
A range of oligonucleotides, which differ in their length, label attachment site (3′- or 5′-modification) and nucleotide base adjacent to the label (A, C, T or G) was labelled with PtCP-NCS using the optimised protocol (method 8 in Table 1), purified and then underwent spectroscopic investigation. Structures of labelled oligonucleotides and their phosphorescent properties are summarised in Table 2.
Absorption, excitation and emission spectra of all the conjugates were found to be practically identical to those of the free PtCP, with principal absorption maxima at 382 and 535 nm and emission maximum at 648 nm. Spectroscopic behaviour of the PtCP label conjugated to oligonucleotides was different from its behaviour in protein conjugates, for which significant changes in absorption spectra and a large decrease in emission yields have been observed (24,25). This suggests minimal interaction of the label with the oligonucleotide backbone, which can be explained by the significant negative charge on both moieties (repulsion) and long spacer between them. The effects of the oligonucleotide length, base content, attachment site and the nearest base are seen to be marginal. The values of emission yields and lifetimes also indicate that adjacent or high numbers of guanine residues [known to quench some conventional fluorophores (15)] do not significantly impact on the phosphorescent properties of the probes. Despite the long emission lifetime of PtCP, dynamic and static quenching by DNA was minor.
Time-resolved phosphorescence detection of the PtCP-oligonucleotide probes
High absolute spectral sensitivity of the PtCP-oligonucleotide conjugates (molar absorptivity multiplied by emission yield), optimal spectral characteristics (longwave excitation and emission, large Stokes’ shift) and long decay times enable one to achieve high sensitivity, particularly in complex biological samples and samples with high optical background such as gels, plastics and other solid substrates with high autofluorescence and scattering. High sensitivity can be attained using relatively simple and cost-effective means and equipment.
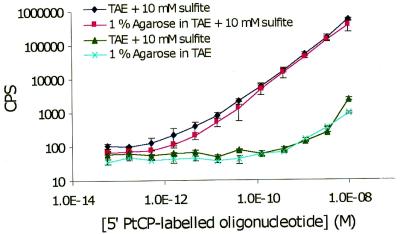
Using the dedicated 532 nm laser-based time-resolved phosphorescence plate reader, limits of detection for the labelled oligonucleotides were shown to be in the range of 0.3 pM, both in deoxygenated aqueous solution and agarose gels (Fig. 4 and Table 3). This is comparable with the sensitivity of free PtCP label in solution (26). To attain high sensitivity, molecular oxygen (dynamic quencher of phosphorescence) must be removed from gel and liquid samples during measurements, as otherwise up to three orders of sensitivity can be lost. This is easily overcome by the addition of 20–50 mM sodium sulfite (chemical deoxygenator) to the buffer or to the agarose gel. Furthermore, it was shown that the addition of sulfite to 1% agarose-TAE gel and TAE running buffer did not compromise electrophoretic separation of DNA (data not shown), so this system can be used for the analysis of PCR samples. These experiments demonstrated the suitability of PtCP-labelled probes for DNA quantification in gels.
Figure 4.
Standard curves of PtCP-labelled oligonucleotide probe (sequence no. 1; Table 2) in various media: (TAE) + 50 mM Na2SO3 pH 7.6, 1% agarose in TAE + 50 mM Na2SO3, TAE pH 7.6 and 1% agarose in TAE.
Table 3. Limits of detection of PtCP-labelled probe in various media.
| Conjugate | Buffer/media | Limit of detection (M) |
|---|---|---|
| 5′ 18mer-PtCP | TAE-sulfite, solution | 3.23 × 10⁻¹³ |
| 5′ 18mer-PtCP | 1% Agarose-TAE-sulfite | 9.06 × 10⁻¹³ |
| 5′ 18mer-PtCP | 1% Agarose-TAE, no sulfite | 2.47 × 10⁻¹⁰ |
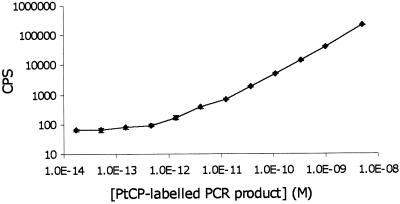
| 5′ 305 bp-PtCP PCR product | TAE-sulfite, solution | 2.80 × 10⁻¹³ |
The use of PtCP-labelled primers in PCR
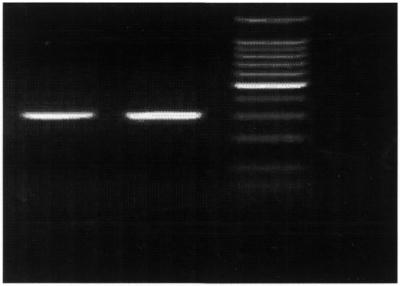
The PCR amplification reaction seems to be unaffected by the incorporation of a 5′-PtCP-labelled forward primer into the amplified strand. PCR amplification reactions run simultaneously with labelled and unlabelled primers both generate product with comparable intensity when visualised by EtBr staining (Fig. 5). Unfortunately, our current instrument does not allow for scanning of gel slices in order to directly detect the PtCP-labelled PCR product. Therefore, excision and extraction of the DNA bands from the agarose gel slice was undertaken, in order to measure the PtCP signal. We also found that the presence of EtBr in gels (DNA staining) does not interfere with the phosphorescent detection of labelled PCR product.
Figure 5.
UV visualisation of 305 bp amplified PCR product on agarose gel stained with EtBr. Lane l, 305 bp PCR product amplified with unmodified primers; lane 2, 305 bp PCR product amplified using 5′-PtCP-labelled forward primer and unmodified reverse primer; lane 3, 100 bp DNA ladder.
The sensitivity of detection of PtCP-labelled PCR product (quantified at 260 nm) was comparable with labelled oligonucleotide probes (Table 3 and Fig. 6). This sensitivity was attained with just one PtCP label per DNA strand. Increasing label incorporation, e.g. by labelling both primers, by multiple labelling of primers or by labelling modified mononucleotides for incorporation into the amplified product, may further enhance sensitivity.
Figure 6.
Standard curve of 5′-PtCP-labelled PCR product extracted and purified from agarose gel and resuspended in TAE + 50 mM Na2SO3.
Limits of detection for luminescent lanthanide chelates in dissociative enhancement systems have been reported to be in the range of 5.0 × 10⁻¹⁴ to 4.0 × 10⁻¹³ M (31) while detection limits for a bifunctional terpyridine (TMT) europium complex-labelled 20mer oligonucleotide were reported to be 1.50 × 10⁻¹² M (33). It is clear that detection limits for PtCP-labelled oligonucleotides and PCR product (3.0 × 10⁻¹³ M) compare well with these figures.
Model separation-free hybridisation assays with the phosphorescent oligonucleotide probes
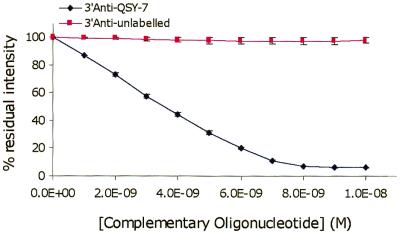
As a model homogenous assay, hybridisation of 5′-PtCP-labelled 18mer oligonucleotide and 3′-QSY® 7 labelled complement was monitored in buffer solution. Upon hybridisation, the two labels PtCP (reporter dye) and QSY® 7 [dark quencher (15)] were brought into close proximity, which resulted in almost complete (∼95%) quenching of the PtCP signal by QSY® 7. A control experiment performed with unlabelled complementary oligonucleotide showed only minor (<3%) quenching of PtCP. Results for this system (Fig. 7) are comparable with existing homogenous hybridisation and molecular beacon systems (12–14). The residual signal is half that of a europium chelate donor quenched by a Cy5 acceptor under similar conditions (34).
Figure 7.
Quenching of PtCP-labelled oligonucleotide (sequence no. 1, 5 nM; Table 2) upon hybridisation with QSY® 7-labelled and unlabelled complementary sequence (sequence no. 9; Table 2) in hybridisation buffer containing 100 mM Na2SO3, pH 7.6, 20°C.
At the same time, the results obtained with the model system cannot give a clear answer about the mechanism of quenching of PtCP label. Since in a probe duplex the 5′- and 3′-terminal labels are very close to each other (35), FRET, collisional and static quenching are principally possible (36). Further investigation of proximity quenching of PtCP label and development of separation-free hybridisation assays is ongoing and will be reported separately.
CONCLUSIONS
A chemical method for labelling amino-modified oligonucleotides has been presented. The specific monofunctional chemistry of both chemical species allows for site-specific attachment of the label to the oligonucleotide (3′- or 5′-termini, internal labelling is also possible). PtCP-NCS has been successfully used as a labelling reagent for a number of different oligonucleotides of varying lengths and GC composition. Phosphorescent properties (spectra, quantum yields and lifetimes) of the PtCP labels are highly conserved when attached to the oligonucleotide ligand. PtCP-labelled probes displayed high sensitivity on a dedicated laser-based time-resolved phosphorescence plate reader, with detection limits in the sub pico-molar range in both solution and agarose gel. They provide a realistic alternative to the existing DNA probes, including fluorescent lanthanide chelates. PtCP labels have been shown not to interfere with conventional DNA amplification (PCR with labelled primer) and allow sensitive detection of the labelled PCR product. With a simple model of two complementary oligonucleotides, labelled with PtCP and QSY® 7, the possibility of separation-free hybridisation assays based on proximity quenching was demonstrated. The applications involving PCR and real-time PCR hybridisation assays are currently under investigation in our laboratory.
Acknowledgments
ACKNOWLEDGEMENT
Financial support of this work by the Irish research founda tion ‘Enterprise Ireland’, grant IF/2001/008, is gratefully acknowledged.
REFERENCES
- 1.Kricka L.J. (1992) Non Isotopic DNA Probe Techniques. Academic Press Inc., San Diego, CA.
- 2.Nath J. and Johnson,K. (1997) Fluorescence in situ hybridisation (FISH): DNA probe production and hybridisation criteria. Biotech. Histochem., 73, 6–22. [DOI] [PubMed] [Google Scholar]
- 3.Smith L.M., Fung,S., Hunkapiller,M.W., Hunkapiller,J.J. and Hood,L.E. (1985) The synthesis of oligonucleotides containing an aliphatic amino group at the 5′ terminus: synthesis of fluorescent DNA primers for use in DNA sequence analysis. Nucleic Acids Res., 13, 2399–2412. [DOI] [PMC free article] [PubMed] [Google Scholar]
- 4.Guillermo T., Fausnaugh,J., Vierra,P. and Stein,S. (1988) Preparation and chromatographic use of 5′ fluorescent labelled DNA probes. J. Chromatogr., 444, 62–77. [DOI] [PubMed] [Google Scholar]
- 5.Dahlen P., Iitia,A., Mukkala,V.M., Hurskainen,P. and Kwiatkowski,M. (1991) The use of europium (Eu3+) labeled primers in PCR amplification of specific target DNA. Mol. Cell. Probes, 5, 143–149. [DOI] [PubMed] [Google Scholar]
- 6.Hurskainen P., Dahlen,P., Ylikoski,J., Kwiatkowski,M., Siitari,H. and Lovgren,T. (1991) Preparation of europium labelled probes and their properties. Nucleic Acids Res., 19, 1057–1061. [DOI] [PMC free article] [PubMed] [Google Scholar]
- 7.Chan A., Diamandis,E.P. and Krajder,M. (1993) Quantification of polymerase chain reaction products in agarose gels with a fluorescent europium chelate as a label in time resolved fluorescence spectroscopy. Anal. Chem., 65, 158–163. [DOI] [PubMed] [Google Scholar]
- 8.Hukkanen V., Rehn,T., Kajander,R., Sjoroos,M. and Waris,M. (2000) Time resolved fluoremetry PCR assay for rapid detection of Herpes Simplex virus in cerebrospinal fluid. J. Clin. Microbiol., 38, 3214–3218. [DOI] [PMC free article] [PubMed] [Google Scholar]
- 9.Markiewicz W.T., Groger,G., Rosch,R., Zebrowska,A., Markiewicz,M., Klotz,M., Hinz,M., Godzina,P. and Selger,H. (1997) A new method of synthesis of fluorescently labelled oligonucleotides and their applications in DNA sequencing. Nucleic Acids Res., 25, 3672–3680. [DOI] [PMC free article] [PubMed] [Google Scholar]
- 10.Kurata S., Kanagawa,T., Yamada,K., Torimura,M., Yokomaku,T., Kamagata,Y. and Kurane,R. (2001) Fluorescent quenching based quantitative detection of specific DNA/RNA using a BODIPY™ FL-labeled probe or primer. Nucleic Acids Res., 29, e34. [DOI] [PMC free article] [PubMed] [Google Scholar]
- 11.van Hal N., Vorst,O., van Houwelingen,A., Kok,E., Peijnenburg,A., Aharoni,A., van Tunen,A. and Keijer,J. (2000) The application of DNA microarrays in gene expression analysis. J. Biotechnol., 78, 271–280. [DOI] [PubMed] [Google Scholar]
- 12.Tyagi S. and Kramer,F. (1995) Molecular beacons: probes that fluoresce upon hybridisation. Nat. Biotechnol., 14, 303–308. [DOI] [PubMed] [Google Scholar]
- 13.Masuko M., Ohuchi,S., Sode,K., Ohtani,H. and Shimadzu,A. (2000) Fluorescence resonance energy transfer from pyrene to perylene labels for nucleic acid hybridisation assays under homogenous solution conditions. Nucleic Acids Res., 28, e34. [DOI] [PMC free article] [PubMed] [Google Scholar]
- 14.Livak K., Flood,S., Marmaro,J., Giusti,W. and Deetz,K. (1995) Oligonucleotides with fluorescent dyes at opposite ends provide a quenched probe system useful for detecting PCR product and nucleic acid hybridisation. PCR Methods Appl., 4, 357–362. [DOI] [PubMed] [Google Scholar]
- 15.Haugland R.P. (1996) Handbook of Fluorescent Probes and Research Chemicals, 6th Edn. Molecular Probes Inc., Eugene, OR.
- 16.Hermanson G.T. (1996) Bioconjugate Techniques. Academic Press, San Diego, CA.
- 17.Soini E. and Hemilla,I. (1979) Fluoroimmunoassay: present status and key problems. Clin. Chem., 25, 353–361. [PubMed] [Google Scholar]
- 18.Soini E., Hemmila,I. and Dahlen,P. (1990) Time resolved fluorescence in biospecific assays. Ann. Biol. Clin. (Paris), 48, 567–571. [PubMed] [Google Scholar]
- 19.Diamandis E.P. and Christopoulos,T.K. (1990) Europium chelate labels in time resolved fluorescence immunoassays and DNA hybridisation assays. Anal. Chem., 62, 1149–1157. [DOI] [PubMed] [Google Scholar]
- 20.Diamandis E.P. (1993) Time resolved fluorometry in nucleic acid hybridisation and Western blotting techniques. Electrophoresis, 14, 866–875. [DOI] [PubMed] [Google Scholar]
- 21.Seveus L., Vaisala,M., Syrjanen,S., Sandberg,M., Kuusisto,A., Harju,R., Salo,J., Hemmila,I., Kojola,H. and Soini,E. (1992) Time resolved fluorescence imaging of europium chelate label in immunohydrochemistry and in situ hybridisation. Cytometry, 13, 329–388. [DOI] [PubMed] [Google Scholar]
- 22.Nurmi J., Ylikoski,A., Soukka,T., Karp,M. and Lovgren,T. (2000) A new label technology for the detection of specific polymerase chain reaction products in a closed tube. Nucleic Acids Res., 28, e28. [DOI] [PMC free article] [PubMed] [Google Scholar]
- 23.Savitskii A.P., Papkovskii,D.B., Ponomarev,G.V. and Berezin,I.V. (1989) Phosphorescent immunoassay. Are metalloporphyrins alternative to rare earth fluorescent label. Dokl. Akad. Nauk. SSSR, 304, 1005–1008. [PubMed] [Google Scholar]
- 24.Martsev S.P., Preygerzon,V.A., Mel’nikova,Y.I., Kravchuk,Z.I., Ponomarev,G.V., Lunev,V.E. and Savitsky,A.P. (1995) Preparation of monoclonal and polyclonal IgG with palladium (II) coproporphyrin 1: stimulatory and inhibitory functional effects induced by two different methods. J. Immunol. Methods, 186, 293–304. [DOI] [PubMed] [Google Scholar]
- 25.O’Riordan T.C., Soini,A.E. and Papkovsky,D.B. (2001) Monofunctional derivatives of coproporphyrins for phosphorescent labelling of proteins and binding assays. Anal. Biochem., 290, 366–375. [DOI] [PubMed] [Google Scholar]
- 26.O’Riordan T.C., Soini,A.E., Soini,J.T. and Papkovsky,D.B. (2002) Performance evaluation of the phosphorescent porphyrin label: solid-phase immunoassay of α-fetoprotein. Anal. Chem., in press. [DOI] [PubMed] [Google Scholar]
- 27.de Haas R.R., van Gijlswijk,R.P., van der Tol,E.B., Veuskens,J., van Gijssel,H.E., Tijdens,R.B., Bonnet,J., Verwoerd,N.P. and Tanke,H.J. (1999) Phosphorescent platinum/palladium coproporphyrins for time resolved luminescence microscopy. J. Histochem. Cytochem., 47, 183–196. [DOI] [PubMed] [Google Scholar]
- 28.Soini A.E., Seveus,L., Meltola,N.J., Papkovsky,D.B. and Soini,E. (2002) Phosphorescent metalloporphyrins as labels in time-resolved fluorescence microscopy: effect of mounting on emission intensity. Microsc. Res. Tech., 58, 125–131. [DOI] [PubMed] [Google Scholar]
- 29.Tanke H.J., de Haas,R.R., Sanger,G., Ganser,M. and van Gijlswijjk,R.P. (1998) Use of platinum coproporphyrin and delayed luminescence imaging to extend the number of targets FISH karyotyping. Cytometry, 33, 453–459. [DOI] [PubMed] [Google Scholar]
- 30.Soini A.E., Vashunsky,D.V., Meltola,D.V., Ponomarev,N.J. and Gelli,V. (2001) Preparation of monofunctional and phosphorescent palladium (II) and platinum (II) coproporphyrin labelling reagents. J. Porphyrins Phthalocyanines, 5, 735–741. [Google Scholar]
- 31.Hemilla I. (1995) Luminescent lanthanide chelates—a way to more sensitive diagnostic methods. J. Alloys Compounds, 225, 480–485. [Google Scholar]
- 32.Brown S.B. and Shillock,M. (1976) Equilibrium and kinetic studies of the aggregation of porphyrins in aqueous solution. Biochem. J., 153, 279–285. [DOI] [PMC free article] [PubMed] [Google Scholar]
- 33.Saha A., Kross,K., Kloszewski,E., Upson,D., Toner,J., Snow,R., Black,C. and Desai,V. (1993) Time resolved fluorescence of a new europium chelate complex: demonstration of highly sensitive detection of protein and DNA samples. J. Am. Chem. Soc., 115, 11032–11033. [Google Scholar]
- 34.Selvin P., Rana,T. and Hearst,J. (1994) Luminescence resonance energy transfer. J. Am. Chem. Soc., 116, 6029–6030. [Google Scholar]
- 35.Lilley D. and Wilson,T. (2000) Fluorescence resonance energy transfer as a structural tool for nucleic acids. Curr. Opin. Mol. Biol., 4, 507–517. [DOI] [PubMed] [Google Scholar]
- 36.Morrison L., Halder,T. and Stols,L. (1989) Solution phase detection of polynucleotides using interactive fluorescent labels and competitive hybridisation. Anal. Biochem., 183, 231–244. [DOI] [PubMed] [Google Scholar]


