Abstract
Impairment of hippocampal function precedes frontal and parietal cortex impairment in human Alzheimer's disease (AD). Neurotrophins are critical for behavioral performance and neuronal survival in AD. We used complex and radial mazes to assess spatial orientation and learning in wild-type and B6-Tg(ThylAPP)23Sdz (APP23) animals, a transgenic mouse model of AD. We also assessed brain content of nerve growth factor (NGF), brain-derived neurotrophic factor (BDNF), and neurotrophin-3 (NT-3). Performance was alike in wild-type and APP23 animals in the radial maze. In contrast, performance in the complex maze was better in wild-type than APP23 animals. Contrary to the wild-type, hippocampal BDNF levels decreased on training in APP23 animals. Hippocampal and frontal cortex NGF levels in APP23 animals correlated with the time to solve the complex maze, but correlated inversely with escape time in wild-type animals. NT-3 levels were alike in wild-type and APP23 animals and were unchanged even after training. Both types of mazes depend on hippocampal integrity to some extent. However, according to the cognitive mapping theory of spatial learning, the complex maze because of the increased complexity of the environment most likely depends more strongly on preserved hippocampal function than the radial maze in the working memory configuration applied here. Greater impairment in complex maze performance than in radial maze performance thus resembles the predominant affliction of the loss of hippocampal function in human AD. NGF and BDNF levels on maze learning are different in wild-type and transgenic animals, indicating that biological markers of AD may be altered on challenge even though equilibrium levels are alike.
Maze learning has been used to assess learning in experimental animals since the turn of the last century (Lashley and Franz 1912). Several neuronal structures are involved in visuospatial cognition and tasks like the escape from an unknown maze. Results from early animal research were integrated into the cognitive mapping hypothesis (Tolman 1948; O'Keefe and Nadel 1978). Animal research as well as study of patients with brain lesions and normal subjects have demonstrated the crucial role of the hippocampus and the hippocampal formation for the representation of space and navigation therein (Milner 1965; Pigott and Milner 1993; Nunn et al. 1999; Wood et al. 1999; Gron et al. 2000). In addition, the parietal lobes and prefrontal areas have been shown to partake in complex navigation (Goldman-Rakic 1995; Salmon et al. 1996; Gron et al. 2000). Radial mazes may serve as a test for reference memory or working memory, depending on the experimental procedure.
Spatial learning performance decreases with age (Fischer et al. 1992) and in animal models with Aβ overexpression and/or Aβ plaques (Berger-Sweeney et al. 1999; Dodart et al. 1999; Chen et al. 2000; Arendash et al. 2001; Koistinaho et al. 2001; Lalonde et al. 2002; Kelly et al. 2003). A recent study pointed out that addressing the relation between Aβ plaques and memory performance requires careful adjustment for age (Westerman et al. 2002). In studies assessing B6-Tg(ThylAPP)23Sdz (APP23) animals, impairment was assessed in the Morris water maze (Kelly et al. 2003), which poses an additional stress on animals, thus possibly not only assessing navigation but also differences in anxiety. This may explain the hyperactivity observed in young APP23 animals (Van Dam et al. 2003), which makes it impossible to discern impairment in spatial learning per se from differences of activity levels. On the other hand, food deprivation may also be a stressor. However, this has not been systematically assessed in APP23 animals yet. Other than in the study by Van Dam et al. (2003), impairment in spatial learning has been linked to amyloid-associated degeneration in hippocampus and frontal cortex in other studies (Berger-Sweeney et al. 1999; Gordon et al. 2001).
Post mortem studies on Alzheimer's Disease (AD) brains have found increases in nerve growth factor (NGF) (Crutcher et al. 1993; Fahnestock et al. 1996; Hellweg et al. 1998a; Hock et al. 2000; Peng et al. 2004) and decreases in brain-derived neurotrophic factor (BDNF) in surviving neurons of hippocampus and neocortical regions (Hock et al. 2000; Siegel and Chauhan 2000). Reduced levels of neurotrophins have been claimed to be involved in triggering early memory impairment (Hellweg et al. 1998a; Siegel and Chauhan 2000; Schaub et al. 2002; Michalski and Fahnestock 2003; Lang et al. 2004). Chronic deprivation of NGF leads to the formation and deposition of Aβ in mice, suggesting a link between NGF signaling and abnormal processing of amyloid precursor protein (Capsoni et al. 2002). Exogenous application of NGF or BDNF improves spatial memory in aged rats (Fischer et al. 1991; Frick et al. 1997; Almli et al. 2000). Moreover, regional selective application of NGF to the forebrain seemed to bring about a delay of cognitive decline in patients with AD (Tuszynski et al. 2005). Vice versa, endogenous BDNF expression may be linked to learning (Linnarsson et al. 1997; Scaccianoce et al. 2003) and increases on learning in controls (Gomez-Pinilla et al. 2001). The impact of learning on BDNF mRNA expression is confined to the brain areas involved in the processing of spatial information (Kesslak et al. 1998). Similarly, increased NGF expression may result from housing the animals in an enriched environment (Mohammed et al. 1990). Post mortem levels of neurotrophin-3 (NT-3) were found decreased in the cortex of AD brains (Narisawa-Saito and Nawa 1996) but unchanged in another study (Hock et al. 2000). A negative correlation between NT-3 levels and age has been observed in post mortem hippocampus and putamen of control subjects, and for BDNF in post mortem frontal cortex (Durany et al. 2000).
It was the goal of the current study to investigate the spatial learning in young-adult APP23 animals in a newly designed complex maze avoiding interference with stress posed on the animals by swimming. A further goal was to assess the dynamic regulation of neurotrophin levels on spatial learning in these animals.
Results
Basal nonstimulated levels of neurotrophins and their regulation on learning
At baseline, NGF levels in hippocampus and striatum but not in frontal cortex were higher in wild-type controls than in APP23 animals (Table 1). On training, NGF levels decreased in hippocampus in wild-type controls and APP23 animals but remained at control levels in striatum and frontal cortex.
Table 1.
Levels of NGF, BDNF, and NT-3 in the hippocampus, the frontal cortex, and the striatum in wild-type control animals and animals after learning of the maze
| Hippocampus
|
||||||
|---|---|---|---|---|---|---|
| Rest
|
Trained
|
|||||
| Mean | SD | Mean | SD | |||
| NGF | ||||||
| Wild-type | 5.32 | 0.82 | 2.98 | 1.69 | ||
| In group | ** | |||||
| Cross group | ** | |||||
| APP | 3.44 | 1.16 | 1.87 | 0.88 | ||
| * | ||||||
| BDNF | ||||||
| Wild-type | 43.40 | 13.66 | 32.97 | 13.04 | ||
| In group | n.s. | |||||
| Cross group | n.s. | |||||
| APP | 46.35 | 21.51 | 21.53 | 8.47 | ||
| ** | ||||||
| NT-3 | ||||||
| Wild-type | 7.13 | 5.42 | 3.29 | 2.24 | ||
| In group | n.s. | |||||
| Cross group | n.s. | |||||
| APP | 4.70 | 2.51 | 3.31 | 3.31 | ||
| n.s. | ||||||
| Striatum
| ||||||
|---|---|---|---|---|---|---|
| Rest
|
Trained
|
|||||
| Mean | SD | Mean | SD | |||
| NGF | ||||||
| Wild-type | 1.42 | 0.58 | 1.17 | 0.38 | ||
| In group | n.s. | |||||
| Cross group | * | |||||
| APP23 | 0.80 | 0.21 | 1.07 | 0.36 | ||
| n.s. | ||||||
| BDNF | ||||||
| Wild-type | 41.02 | 13.16 | 29.13 | 7.25 | ||
| In group | n.s. | |||||
| Cross group | n.s. | |||||
| APP23 | 34.90 | 7.75 | 30.55 | 7.68 | ||
| n.s. | ||||||
| NT-3 | ||||||
| Wild-type | 2.17 | 0.79 | 2.07 | 1.01 | ||
| In group | n.s. | |||||
| Cross group | n.s. | |||||
| APP23 | 3.43 | 2.23 | 2.39 | 0.73 | ||
| n.s. | ||||||
|
Cortex
|
||||||
|---|---|---|---|---|---|---|
|
Rest
|
Trained
|
|||||
| Mean | SD | Mean | SD | |||
| NGF | ||||||
| Wild-type | 3.24 | 1.12 | 2.97 | 0.90 | ||
| In group | n.s. | |||||
| Cross group | n.s. | |||||
| APP | 2.87 | 0.76 | 3.16 | 0.65 | ||
| n.s. | ||||||
| BDNF | ||||||
| Wild-type | 34.70 | 14.63 | 43.15 | 9.55 | ||
| In group | n.s. | |||||
| Cross group | ** | |||||
| APP | 60.71 | 12.96 | 54.58 | 19.25 | ||
| n.s. | ||||||
| NT-3 | ||||||
| Wild-type | 2.21 | 1.63 | 2.26 | 0.88 | ||
| In group | n.s. | |||||
| Cross group | n.s. | |||||
| APP | 1.75 | 0.76 | 2.84 | 1.17 | ||
| * | ||||||
*P < 0.05; **P < 0.01.
In contrast, BDNF levels were significantly higher in frontal cortex in transgenic animals than in controls but alike in hippocampus and striatum in controls and transgenic animals (Table 1). On training, BDNF levels decreased in hippocampus in APP23 animals but remained alike in all other groups.
No differences between NT-3 levels in wild-type animals and APP23 animals were found in any of the investigated brain regions.
Maze learning in an eight-arm radial maze and a complex maze
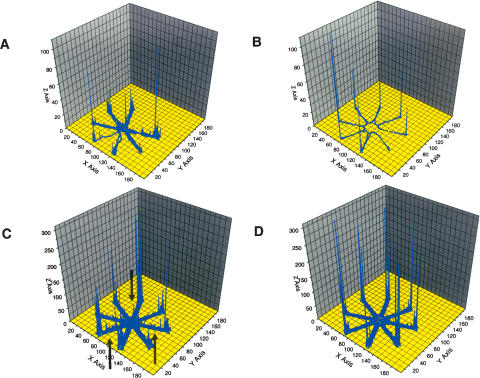
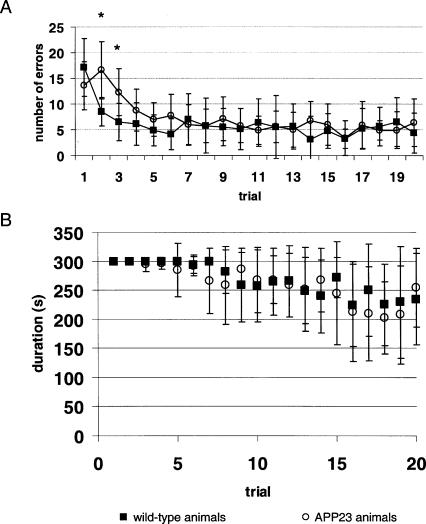
In the eight-arm radial maze (Fig. 1), the number of errors decreased from 17.1 ± 5.6 (mean ± standard deviation) in wild-type controls and 13.6 ± 4.7 in APP23 animals (P not significant) to 4.4 ± 3.9 in controls (P < 0.01 to onset) and 6.4 ± 4.7 in APP23 animals (P < 0.01 to onset; group difference not significant) (Fig. 2). Similarly, the time to solve the task on the last trial was alike in wild-type controls, 235.0 ± 79.0, and APP23 animals, 254.2 ± 68.2 (P not significant) (Fig. 2). Analysis of errors made on individual trials with two-sided t-tests revealed significant differences at trial 2 (8.5 ± 2.8 in wild-type controls vs. 16.6 ± 5.6 in APP23 animals; P < 0.01) and trial 3 (6.5 ± 3.6 in wild-type controls vs. 12.3 ± 4.6 in APP23 animals; P < 0.05). Even with this liberal analysis no difference was observed concerning the duration of the trial. Thus, at 10 mo of age, only minor differences were observed in learning of the radial maze in wild-type controls and APP23 animals.
Figure 1.
(A) Trace for a single animal on first exposure to the radial maze. Note that not all arms of the maze are visited and that the animal rested in some arms or revisited the arms (x-axis and y-axis refer to the location of the animal, z-axis to the number of observations). (B) Trace for a single animal after training in the radial maze for 20 d. Note that the end of each arm of the maze is visited without resting or revisiting any arm. (C) Overlay of the individual traces for n = 10 wild-type animals on first exposure to the maze (arrows indicate resting or turning of animals prior to or after reaching the food pellet at the end of the arm). (D) Overlay of the individual traces for n = 10 wild-type animals after training in the radial maze for 20 d.
Figure 2.
(A) Number of errors (mean ± standard deviation) in solving the radial maze in wild-type animals (squares) and APP23 animals (circles). Unpaired t-test significant differences are found on day 2 and day 3 (*). However, group difference is not significant (compare Results). (B) Time to complete the radial maze (mean ± standard deviation) in control animals (squares) and APP23 animals (circles).
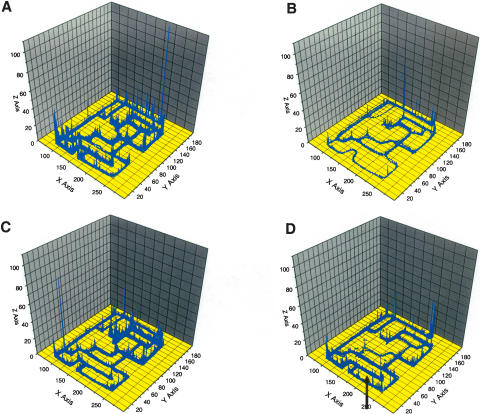
In order to further assess spatial learning, a complex maze was designed. In the complex maze, wild-type controls and APP23 animals at 10 mo of age explored the maze on first exposure to the maze in a similar fashion (Fig. 3). At the end of the experiment there were still some APP23 animals that did not avoid the dead end marked by arrow in Figure 3D. However, each and every animal of the control group avoided this dead end.
Figure 3.
Overlay of the individual traces of n = 10 animals to solve the complex maze (x-axis and y-axis refer to the location of the animal, z-axis to the number of observations). (A) Wild-type animals on first placement in the complex maze; (B) wild-type animals after training in the complex maze for 20 d. (C) Overlay of the individual traces of n = 10 APP23 animals to solve the complex maze on first placement in the complex maze. (D) APP23 animals after training in the complex maze for 20 d. Note that a blind alley avoided by all control animals after training is still visited by APP23 animals (indicated by arrow).
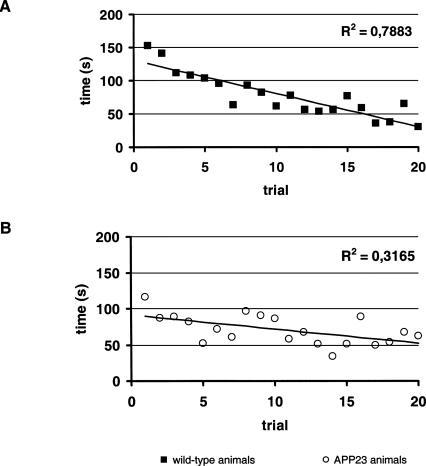
Upon maze learning, the time to escape the complex maze (Fig. 4) decreases in wild-type controls and APP23 animals (Fig. 4). At the first exposure to the maze, the time to escape from the maze was 152.3 ± 87.7 sec (mean ± standard deviation) in wild-type controls and 116.1 ± 83.3 sec in APP23 animals (P not significant). On the last trial, the average time to escape was 30.1 ± 19.2 sec in wild-type controls (P < 0.001 to onset) and 62.4 ± 40.0 sec (n.s. to onset) in APP23 animals (P < 0.05 to control). Thus, performance in the complex maze did not significantly improve for the APP23 animals, while a clear-cut improvement of spatial navigation is observed regarding the time to solve the maze as well as the avoidance of certain dead ends for each and every animal of the wild-type group investigated.
Figure 4.
Learning curve for the time to escape from the complex maze. Values represent means for a group (n = 10) of (A) wild-type animals and (B) APP23 animals.
Correlational analysis of maze learning and neurotrophins
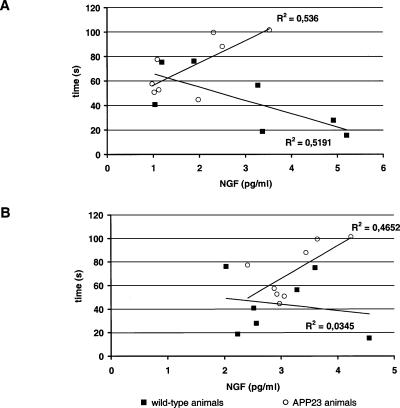
Performance in the complex maze correlated with NGF levels in hippocampus in trained wild-type control animals, but correlated inversely with NGF levels in transgenic APP23 animals (Fig. 5). Similarly, a trend toward an inverse correlation between NGF levels and behavioral performance was observed in frontal cortex in transgenic animals, but no correlation was observed in wild-type controls.
Figure 5.
Correlational analysis of NGF levels in (A) hippocampus and (B) frontal cortex in control animals (squares) and APP23 animals (circles) with time to escape from the complex maze.
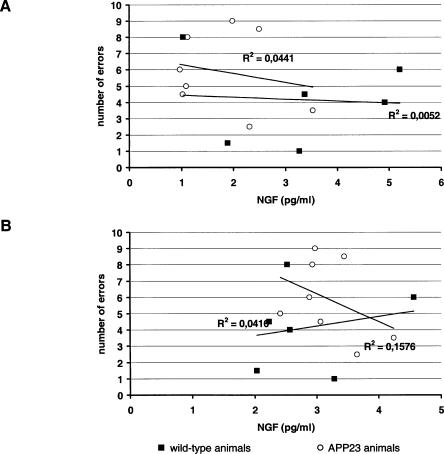
No other significant correlations were observed in other brain regions investigated or with BDNF or NT-3 levels (data not shown). Similarly, no correlations were observed between any behavioral measure in the radial maze and any of the neurotrophins at 10 mo of age (Figs. 6 and 7).
Figure 6.
Correlational analysis of NGF levels in (A) hippocampus and (B) frontal cortex in control animals (squares) and APP23 animals (circles) with number of errors in the radial maze.
Figure 7.
Correlational analysis of NGF levels in (A) hippocampus and (B) frontal cortex in control animals (squares) and APP23 animals (circles) with time to escape from the radial maze.
Discussion
Maze studies are an established means to investigate learning in experimental animals (Tolman 1948). Initially, complex mazes were used, but over the years mostly radial mazes or water mazes have been used. NGF levels were found to be inversely correlated with performance in the Morris water maze (Sugaya et al. 1998). Similarly, BDNF levels in frontal cortex are negatively associated with working memory performance (Mizuno et al. 2000; Alonso et al. 2002; Bimonte-Nelson et al. 2003) but may be positively correlated with performance in a hippocampal task (Schaaf et al. 2001). However, swimming as in water mazes imposes an additional stress on experimental animals that may interfere with the study of cognition per se. This is of particular importance when considering neurotrophin levels since neurotrophin levels in hippocampus have been shown to decrease upon stress (Ueyama et al. 1997; Scaccianoce et al. 2003; von Richthofen et al. 2003; Adlard and Cotman 2004). On the other hand, food deprivation may also be a stressor. However, this has not yet been systematically assessed in APP23 animals.
In the present study, the radial maze was used as a working memory task. Food pellets were placed in all eight arms in every trial, and animals only needed to keep in memory the arms already visited in that specific trial. Performance was alike in wild-type controls and transgenic APP23 animals regarding both errors and the duration to solve the maze. In contrast, a clear-cut difference in performance in the complex maze was observed between controls and APP23 animals. For this maze to be solved, animals needed to build an internal map of the maze to improve performance. While the time to find the way out of the maze decreased in both control and APP23 animals, the rate of decline was greater in control than in APP23 animals. In addition, in the control group some dead-end alleys were avoided by each and every animal, which was not the case for the transgenic animals.
BDNF and NGF levels remained alike in frontal cortex in female rats on training in a working memory task (Bimonte et al. 2003), which is similar to the present results obtained in animals trained in the radial and complex mazes. Complex mazes are known to crucially depend on hippocampal function (Tolman 1948). In contrast to frontal cortex and striatum, we found a decrease in hippocampal NGF levels in female controls and a decrease in both NGF and BDNF levels in APP23 animals. Extending the findings to a correlational analysis between neurotrophin levels in controls and APP23 animals, the data demonstrate a qualitatively different response in control and APP23 animals. The time to navigate to the exit of the complex maze is positively correlated with NGF levels in both hippocampus and frontal cortex in APP23 animals but inversely correlated with hippocampal NGF levels in controls. Notwithstanding this differential regulation, hippocampal and frontal cortex NGF levels are alike in control and APP23 animals. It has been speculated that lack of adequate environmental stimulation might be of importance in age-related behavioral and neurochemical deficits, because novel environments caused significant changes in hippocampal NGF levels (Mohammed et al. 1990; Pham et al. 1999). In contrast, the present work may indicate that after onset of the disease, training may have detrimental effects, as has also been observed in young normal subjects (Markowska et al. 1994). Moreover, supraphysiological neurotrophin concentrations may be part of a pathophysiological cascade and, for example, induce aberrant sprouting (Hellweg et al. 1998b; Burbach et al. 2004).
It needs to be considered that endogenous neurotrophin levels in wild-type controls and transgenic APP23 animals are subject to age effects in a distinct fashion. On aging, the increase of BDNF in hemizygous APP23 animals exceeds the increase in wild-type animals (Burbach et al. 2004). Unfortunately, this age effect has not yet been investigated for NGF. Age- and/or amyloid-related neurotrophin increase in the brain of APP23 transgenic mice might be due to impaired retrograde transport from the target region of the cholinergic basal forebrain (Crutcher et al. 1993; Scott et al. 1995; Hock et al. 2000; Siegel and Chauhan 2000; Mufson et al. 2003; Peng et al. 2004). There is at least experimental evidence that increased NGF levels are disease- or trauma-related rather than physiological (Lang et al. 2004). With respect to BDNF, we have recently shown in APP23 animals that de novo synthesis of this neurotrophin is stimulated in both astrocytes and microglial cells surrounding amyloid plaques in a disease-related manner in advanced stages of the disease (Burbach et al. 2004). Considering that the endogenous neurotrophin increase in APP23 animals exceeds the increase in wild-type animals, therapeutic trials with exogenous application of neurotrophins seem less promising than anticipated. In fact, preliminary trials with intracerebroventricular application of NGF to patients with severe AD have failed thus far (Eriksdotter et al. 1998). Thus, it can be concluded from the present study that neurotrophin treatment at the earliest possible time point is warranted to assess a potential benefit of exogenous application of neurotrophins. This view is supported by a recent report of NGF-related improvement of symptoms and progression observed in early AD (Tuszynski et al. 2005).
Overall we conclude that neurotrophin regulation is ambiguous in health and disease. While hippocampal NGF levels on training correlate positively with performance in healthy controls, they correlate inversely with performance in a transgenic model of AD.
Materials and Methods
Animals
Littermate wild-type and B6-Tg(ThylAPP)23Sdz (APP23) mice were born and raised at Novartis Pharmaceutical Research (Basel, Switzerland) as previously described (Sturchler-Pierrat et al. 1997). These mice express the human APP751 cDNA with the Swedish double mutation under control of the neuron-specific mouse Thy-1 promoter fragment. APP23 mice were established on a B6D2 background and have been continuously back-crossed to C57BL/6J. Upon arrival several weeks prior to experimentation, animals were housed with four animals of the same age in one cage. Animals had exposure to food and water ad libitum, and were maintained on a 12-h light/12-h dark cycle. The animals were fasted to attain 85%-90% of initial weight prior to and during experimentation in the mazes. Animals were killed by cervical dislocation. The tissue of different brain regions (frontal cortex, hippocampus, striatum) was dissected and immediately frozen in liquid nitrogen and stored at -80°C until further analysis.
Maze paradigm
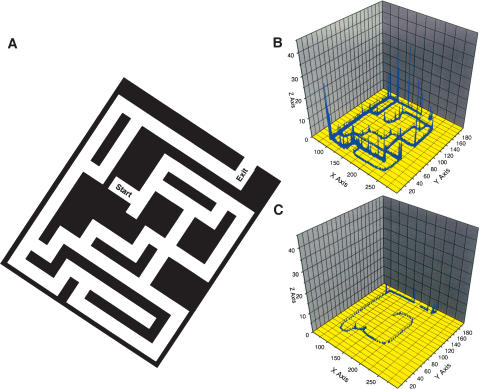
A complex maze was designed constructed of gray rigid PVC. The aerial view is seen in Figure 8. Animals were trained once a day. Animals were released from the start area facing the center and had 300 sec to find the exit. A food pellet was placed at the exit of the maze to reward the animals.
In addition, animals were trained in a standard eight-arm radial maze. At the end of each arm, a food pellet was offered in a bowl. Mice remained in the maze for a maximum time of 300 sec or until they had visited all arms.
Figure 8.
(A) Aerial view of the complex maze. Animals were placed in the start zone. A video camera allowed assessment of the position of animals at a frequency of 1 Hz. (B) Trace for a single animal on first placement in the complex maze. Note that all alleys of the maze are explored. (x-axis and y-axis refer to the location of the animal, z-axis to the number of observations). (C) Trace for a single animal after training in the complex maze for 20 d showing that the animal reaches the exit without errors.
Both mazes were surrounded by a curtain with no optical cues and only a red twilight hang above in the middle of the mazes. After each trial, the maze was cleaned to rule out odor cues from previous animals. On each day, all animals were exposed to the complex maze prior to exposure to the radial maze. The time interval between testing in the radial maze and the complex maze was 5 h. Experiments were performed between 10 a.m. and 6 p.m. daily for 20 d.
Neurotrophin levels
Each frozen brain region was homogenized by ultrasonication in 10-20 vol of lysing buffer containing 0.1 M Tris-HCl (pH 7.0), 0.4 M NaCl, 0.1% NaN3, and a variety of protease inhibitors (Hellweg et al. 1989) and was stored at -80°C until analysis. Each brain region was consecutively processed for quantification of each neurotrophin, for example, NGF, BDNF, and NT-3. Determinations of recovery and specific and unspecific neurotrophin binding (the latter against mouse IgG1 obtained from MOPC 21) involved quadruplicate fluorescence determinations for each tissue sample in each neurotrophin assay. The neurotrophin levels were expressed as picograms per milligram of tissue (wet weight). In order to minimize the influence of unavoidable variances between experiments (Hellweg et al. 1989, 1998a), neurotrophin levels from corresponding controls and transgenic animals were always measured in the same assay.
Endogenous NGF levels in the rethawed homogenates were determined by a fluorometric two-site enzyme immunoassay (ELISA) that has been described in detail elsewhere (Hellweg et al. 1989, 1998a). NGF content was expressed as equivalents of mouse 2.5 S NGF. The detection limit of the assay was 0.25 pg/mL.
Endogenous levels of BDNF were measured in the rethawed homogenates using commercial ELISA kits in principle according to the manufacturer's instructions (Promega Inc., USA) but improved and adapted to the fluorometric technique used also for NGF determination as described in detail previously (Hellweg et al. 2003).
Endogenous levels of NT-3 were measured in the rethawed homogenates using commercial ELISA kits in principle according to the manufacturer's instructions (Promega Inc., USA) but were improved and adapted to the fluorometric technique used also for NGF determination. Briefly, microtiter plates (Dynatech microfluor black 96-well, flat-bottom microtiter plates) were coated with 50 μL/well of primary anti-NT-3 chicken IgY polyclonal antibody diluted [1:1000] in carbonate buffer (pH 9.6). For testing of unspecific binding, parallel wells were coated with unspecific chicken IgG [1:80000] in carbonate buffer (pH 9.6). After overnight incubation at 4°C, the plates were washed four times with washing buffer as described for the NGF assay (Hellweg et al. 1989, 1998a). Homogenates were centrifuged, and supernatants were diluted with the equal amount of 0.1% NP-40 as described elsewhere (Hellweg et al. 1989, 1998a). Each 50 μL of sample was applied in quaduplicate wells along with the standard, then incubated for 4 h in the dark at room temperature. After washing four times, a secondary anti-NT-3 monoclonal antibody diluted [1:6000] in standard/conjugate buffer (Hellweg et al. 1989, 1998a) was added to the appropriate wells (50 μL each) and then incubated overnight at 4°C. After washing out four times, antimouse IgG β-galactosidase conjugate Biozol diluted [1:10000] in standard/conjugate buffer (Hellweg et al. 1989, 1998a) was added to the appropriate wells (50 μL each). Incubation was done again at room temperature overnight in the dark at 4°C followed by washing four times with washing buffer (Hellweg et al. 1989, 1998a) and two times with substrate buffer (0.1 M sodium phosphate at pH 8.7, 1 mM MgCl2). Enzyme reaction was started and stopped as described for NGF determination in detail (Hellweg et al. 1989, 1998a). The accumulation of the fluorescent emitter (excitation wavelength 355 nm, emission wavelength 460 nm) was followed in a microplate fluorometer (Labsystems Fluoroskan II). Matched background values were subtracted from each reading, and the results were expressed as enzyme activity by comparison to an external standard of β-galactosidase in antibody-coated microwells. The ELISA values for brain samples were determined from the regression line for the NT-3 standard (recombinant human NT-3) incubated under similar conditions. NT-3 content was expressed as equivalents of recombinant human NT-3. The detection limit of the assay was 1 pg/mL.
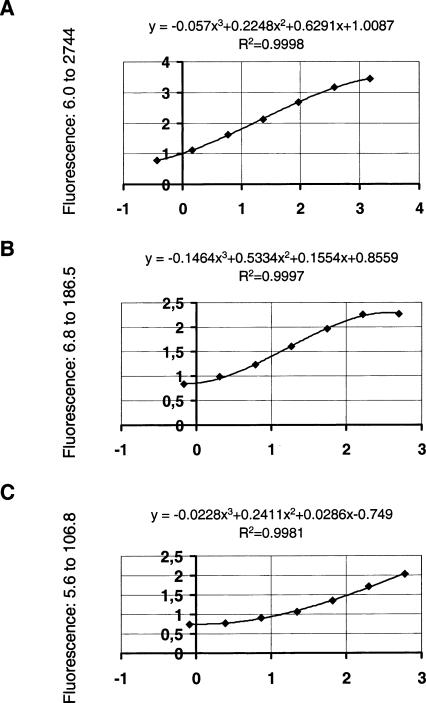
Differing from commercial neurotrophin ELISAs, the mean recovery of exogenous neurotrophin (NGF, BDNF, NT-3; 125 pg/mL each) added to the total homogenate ranged from 60% to 90% in each assay. Using these improved fluorometric ELISAs, it is feasible to quantify the endogenous neurotrophins NGF, BDNF, and NT-3 in the same brain tissue with a minimal wet weight of ∼5 pg. Typical standard curves are shown in Figure 9.
Figure 9.
Typical standard curves for (A) NGF, (B) BDNF, and (C) NT-3 ELISAs. Fluorescence intensity is expressed in arbitrary units measured for each neurotrophin concentration tested: (A) 0.366 to 1500 pg/mL NGF (diluted 1:4 each), (B) 0.686 to 500 pg/mL BDNF (diluted 1:3 each), and (C) 0.823 to 600 pg/mL NT-3 (diluted 1:3 each). Fluorescence of blank values obtained for unspecific and specific binding was always below the lowest neurotrophin concentration tested.
Reagents
General lab chemicals of analytical grade were purchased from Merck. Specialty reagents were obtained from Sigma Chemie GmbH, if not stated otherwise. Anti-β NGF monoclonal antibodies (clone 27/21), partly conjugated with β-D-galactosidase, were purchased from Boehringer Mannheim. Anti-BDNF and NT-3 antibodies as well as anti-chicken-IgY-alkaline phosphatase conjugate were purchased from Promega Inc., USA. AttoPhos, namely, the free fluorogenic substrate for the BDNF-ELISA, was purchased from Boehringer Mannheim.
Statistics
Each neurotrophin experiment was conducted with eight tissue blocks from hippocampus, frontal cortex, and striatum from eight animals. Statistical testing was performed by the Mann-Whitney U-test and for multiple comparisons with the Newman-Kuels Analog Test. Statistical significance was accepted at P < 0.05.
Acknowledgments
This work was supported by grants from an intramural grant of the Charité University, Berlin (to R.H.), and a grant from the Deutsche Forschungsgemeinschaft (to M.W.R.). We thank H. Danker-Hopfe for statistical assistance.
Article published online ahead of print. Article and publication date are at http://www.learnmem.org/cgi/doi/10.1101/lm.2606.
References
- Adlard, P.A. and Cotman, C.W. 2004. Voluntary exercise protects against stress-induced decreases in brain-derived neurotrophic factor protein expression. Neuroscience 124: 985-992. [DOI] [PubMed] [Google Scholar]
- Almli, C.R., Levy, T.J., Han, B.H., Shah, A.R., Gidday, J.M., and Holtzman, D.M. 2000. BDNF protects against spatial memory deficits following neonatal hypoxia-ischemia. Exp. Neurol. 166: 99-114. [DOI] [PubMed] [Google Scholar]
- Alonso, M., Vianna, M.R., Depino, A.M., Mello e Souza, T., Pereira, P., Szapiro, G., Viola, H., Pitossi, F., Izquierdo, I., and Medina, J.H. 2002. BDNF-triggered events in the rat hippocampus are required for both short- and long-term memory formation. Hippocampus 12: 551-560. [DOI] [PubMed] [Google Scholar]
- Arendash, G.W., King, D.L., Gordon, M.N., Morgan, D., Hatcher, J.M., Hope, C.E., and Diamond, D.M. 2001. Progressive, age-related behavioral impairments in transgenic mice carrying both mutant amyloid precursor protein and presenilin-1 transgenes. Brain Res. 891: 42-53. [DOI] [PubMed] [Google Scholar]
- Berger-Sweeney, J., McPhie, D.L., Arters, J.A., Greenan, J., Oster-Granite, M.L., and Neve, R.L. 1999. Impairments in learning and memory accompanied by neurodegeneration in mice transgenic for the carboxyl-terminus of the amyloid precursor protein. Brain Res. Mol. Brain Res. 66: 150-162. [DOI] [PubMed] [Google Scholar]
- Bimonte, H.A., Nelson, M.E., and Granholm, A.C. 2003. Age-related deficits as working memory load increases: Relationships with growth factors. Neurobiol. Aging 24: 37-48. [DOI] [PubMed] [Google Scholar]
- Bimonte-Nelson, H.A., Hunter, C.L., Nelson, M.E., and Granholm, A.C. 2003. Frontal cortex BDNF levels correlate with working memory in an animal model of Down syndrome. Behav. Brain Res. 139: 47-57. [DOI] [PubMed] [Google Scholar]
- Burbach, G.J., Hellweg, R., Haas, C.A., Del Turco, D., Deicke, U., Abramowski, D., Jucker, M., Staufenbiel, M., and Deller, T. 2004. Induction of brain-derived neurotrophic factor in plaque-associated glial cells of aged APP23 transgenic mice. J. Neurosci. 24: 2421-2430. [DOI] [PMC free article] [PubMed] [Google Scholar]
- Capsoni, S., Giannotta, S., and Cattaneo, A. 2002. β-Amyloid plaques in a model for sporadic Alzheimer's disease based on transgenic anti-nerve growth factor antibodies. Mol. Cell Neurosci. 21: 15. [DOI] [PubMed] [Google Scholar]
- Chen, G., Chen, K.S., Knox, J., Inglis, J., Bernard, A., Martin, S.J., Justice, A., McConlogue, L., Games, D., Freedman, S.B., et al. 2000. A learning deficit related to age and β-amyloid plaques in a mouse model of Alzheimer's disease. Nature 408: 975-979. [DOI] [PubMed] [Google Scholar]
- Crutcher, K.A., Scott, S.A., Liang, S., Everson, W.V., and Weingartner, J. 1993. Detection of NGF-like activity in human brain tissue: Increased levels in Alzheimer's disease. J. Neurosci. 13: 2540-2550. [DOI] [PMC free article] [PubMed] [Google Scholar]
- Dodart, J.C., Meziane, H., Mathis, C., Bales, K.R., Paul, S.M., and Ungerer, A. 1999. Behavioral disturbances in transgenic mice overexpressing the V717F β-amyloid precursor protein. Behav. Neurosci. 113: 982-990. [DOI] [PubMed] [Google Scholar]
- Durany, N., Michel, T., Kurt, J., Cruz-Sanchez, F.F., Cervas-Navarro, J., and Riederer, P. 2000. Brain-derived neurotrophic factor and neurotrophin-3 levels in Alzheimer's disease brains. Int. J. Dev. Neurosci. 18: 807-813. [PubMed] [Google Scholar]
- Eriksdotter, J.M., Nordberg, A., Amberla, K., Backman, L., Ebendal, T., Meyerson, B., Olson, L., Seiger, A., Shigeta, M., Theodorsson, E., et al. 1998. Intracerebroventricular infusion of nerve growth factor in three patients with Alzheimer's disease. Dement. Geriatr. Cogn. Disord. 9: 246-257. [DOI] [PubMed] [Google Scholar]
- Fahnestock, M., Scott, S.A., Jette, N., Weingartner, J.A., and Crutcher, K.A. 1996. Nerve growth factor mRNA and protein levels measured in the same tissue from normal and Alzheimer's disease parietal cortex. Brain Res. Mol. Brain Res. 42: 175-178. [DOI] [PubMed] [Google Scholar]
- Fischer, W., Bjorklund, A., Chen, K., and Gage, F.H. 1991. NGF improves spatial memory in aged rodents as a function of age. J. Neurosci. 11: 1889-1906. [DOI] [PMC free article] [PubMed] [Google Scholar]
- Fischer, W., Chen, K.S., Gage, F.H., and Bjorklund, A. 1992. Progressive decline in spatial learning and integrity of forebrain cholinergic neurons in rats during aging. Neurobiol. Aging 13: 9-23. [DOI] [PubMed] [Google Scholar]
- Frick, K.M., Price, D.L., Koliatsos, V.E., and Markowska, A.L. 1997. The effects of nerve growth factor on spatial recent memory in aged rats persist after discontinuation of treatment. J. Neurosci. 17: 2543-2550. [DOI] [PMC free article] [PubMed] [Google Scholar]
- Goldman-Rakic, P.S. 1995. Cellular basis of working memory. Neuron 14: 477-485. [DOI] [PubMed] [Google Scholar]
- Gomez-Pinilla, F., So, V., and Kesslak, J.P. 2001. Spatial learning induces neurotrophin receptor and synapsin I in the hippocampus. Brain Res. 904: 13-19. [DOI] [PubMed] [Google Scholar]
- Gordon, M.N., King, D.L., Diamond, D.M., Jantzen, P.T., Boyett, K.V., Hope, C.E., Hatcher, J.M., DiCarlo, G., Gottschall, W.P., Morgan, D., et al. 2001. Correlation between cognitive deficits and Aβ deposits in transgenic APP+PS1 mice. Neurobiol. Aging 22: 377-385. [DOI] [PubMed] [Google Scholar]
- Gron, G., Wunderlich, A.P., Spitzer, M., Tomczak, R., and Riepe, M.W. 2000. Brain activation during human navigation: Gender-different neural networks as substrate of performance. Nat. Neurosci. 3: 404-408. [DOI] [PubMed] [Google Scholar]
- Hellweg, R., Hock, C., and Hartung, H.D. 1989. An improved and rapid highly sensitive enzyme immunoassay for nerve growth factor. J. Methods Cell Mol. Biol. 1: 43-48. [Google Scholar]
- Hellweg, R., Gericke, C.A., Jendroska, K., Hartung, H.D., and Cervos-Navarro, J. 1998a. NGF content in the cerebral cortex of non-demented patients with amyloid-plaques and in symptomatic Alzheimer's disease. Int. J. Dev. Neurosci. 16: 787-794. [DOI] [PubMed] [Google Scholar]
- Hellweg, R., von Richthofen, S., Anders, D., Baethge, C., Ropke, S., Hartung, H.D., and Gericke, C.A. 1998b. The time course of nerve growth factor content in different neuropsychiatric diseases—A unifying hypothesis. J. Neural Transm. 105: 871-903. [DOI] [PubMed] [Google Scholar]
- Hellweg, R., von Arnim, C.A.F., Büchner, M., Huber, R., and Riepe, M.W. 2003. Neuroprotection and neuronal dysfunction upon repetitive inhibition of oxidative phosphorylation. Exp. Neurol. 183: 346-354. [DOI] [PubMed] [Google Scholar]
- Hock, C., Heese, K., Hulette, C., Rosenberg, C., and Otten, U. 2000. Region-specific neurotrophin imbalances in Alzheimer disease: Decreased levels of brain-derived neurotrophic factor and increased levels of nerve growth factor in hippocampus and cortical areas. Arch. Neurol. 57: 846-851. [DOI] [PubMed] [Google Scholar]
- Kelly, P.H., Bondolfi, L., Hunziker, D., Schlecht, H.P., Carver, K., Maguire, E., Abramowski, D., Wiederhold, K.H., Sturchler-Pierrat, C., Jucker, M., et al. 2003. Progressive age-related impairment of cognitive behavior in APP23 transgenic mice. Neurobiol. Aging 24: 365-378. [DOI] [PubMed] [Google Scholar]
- Kesslak, J.P., So, V., Choi, J., Cotman, C.W., and Gomez-Pinilla, F. 1998. Learning upregulates brain-derived neurotrophic factor messenger ribonucleic acid: A mechanism to facilitate encoding and circuit maintenance? Behav. Neurosci. 112: 1012-1019. [DOI] [PubMed] [Google Scholar]
- Koistinaho, M., Ort, M., Cimadevilla, J.M., Vondrous, R., Cordell, B., Koistinaho, J., Bures, J., and Higgins, L.S. 2001. Specific spatial learning deficits become severe with age in β-amyloid precursor protein transgenic mice that harbor diffuse β-amyloid deposits but do not form plaques. Proc. Natl. Acad. Sci. 98: 14675-14680. [DOI] [PMC free article] [PubMed] [Google Scholar]
- Lalonde, R., Dumont, M., Staufenbiel, M., Sturchler-Pierrat, C., and Strazielle, C. 2002. Spatial learning, exploration, anxiety, and motor coordination in female APP23 transgenic mice with the Swedish mutation. Brain Res. 956: 36-44. [DOI] [PubMed] [Google Scholar]
- Lang, U.E., Jockers-Scherubl, M.C., and Hellweg, R. 2004. State of the art of the neurotrophin hypothesis in psychiatric disorders: Implications and limitations. J. Neural Transm. 111: 387-411. [DOI] [PubMed] [Google Scholar]
- Lashley, K.S. and Franz, S.I. 1912. The effects of cerebral destruction upon habit-formation and retention in the albino rat. Psychobiology 1: 71-139. [Google Scholar]
- Linnarsson, S., Bjorklund, A., and Ernfors, P. 1997. Learning deficit in BDNF mutant mice. Eur. J. Neurosci. 9: 2581-2587. [DOI] [PubMed] [Google Scholar]
- Markowska, A.L., Koliatsos, V.E., Breckler, S.J., Price, D.L., and Olton, D.S. 1994. Human nerve growth factor improves spatial memory in aged but not in young rats. J. Neurosci. 14: 4815-4824. [DOI] [PMC free article] [PubMed] [Google Scholar]
- Michalski, B. and Fahnestock, M. 2003. Pro-brain-derived neurotrophic factor is decreased in parietal cortex in Alzheimer's disease. Brain Res. Mol. Brain Res. 111: 148-154. [DOI] [PubMed] [Google Scholar]
- Milner, B. 1965. Visually-guided maze learning in man: Effects of bilateral hippocampal, bilateral frontal, and unilateral cerebral lesions. Neuropsychologia 3: 317-338. [Google Scholar]
- Mizuno, M., Yamada, K., Olariu, A., Nawa, H., and Nabeshima, T. 2000. Involvement of brain-derived neurotrophic factor in spatial memory formation and maintenance in a radial arm maze test in rats. J. Neurosci. 20: 7116-7121. [DOI] [PMC free article] [PubMed] [Google Scholar]
- Mohammed, A.K., Winblad, B., Ebendal, T., and Larkfors, L. 1990. Environmental influence on behaviour and nerve growth factor in the brain. Brain Res. 528: 62-72. [DOI] [PubMed] [Google Scholar]
- Mufson, E.J., Ginsberg, S.D., Ikonomovic, M.D., and DeKosky, S.T. 2003. Human cholinergic basal forebrain: Chemoanatomy and neurologic dysfunction. J. Chem. Neuroanat. 26: 233-242. [DOI] [PubMed] [Google Scholar]
- Narisawa-Saito, M. and Nawa, H. 1996. Differential regulation of hippocampal neurotrophins during aging in rats. J. Neurochem. 67: 1124-1131. [DOI] [PubMed] [Google Scholar]
- Nunn, J.A., Graydon, F.J., Polkey, C.E., and Morris, R.G. 1999. Differential spatial memory impairment after right temporal lobectomy demonstrated using temporal titration. Brain 122: 47-59. [DOI] [PubMed] [Google Scholar]
- O'Keefe, J. and Nadel, L. 1978. The hippocampus as a cognitive map. Clarendon Press, Oxford, UK.
- Peng, S., Wuu, J., Mufson, E.J., and Fahnestock, M. 2004. Increased proNGF levels in subjects with mild cognitive impairment and mild Alzheimer disease. J. Neuropathol. Exp. Neurol. 63: 641-649. [DOI] [PubMed] [Google Scholar]
- Pham, T.M., Soderstrom, S., Winblad, B., and Mohammed, A.H. 1999. Effects of environmental enrichment on cognitive function and hippocampal NGF in the non-handled rats. Behav. Brain Res. 103: 63-70. [DOI] [PubMed] [Google Scholar]
- Pigott, S. and Milner, B. 1993. Memory for different aspects of complex visual scenes after unilateral temporal- or frontal-lobe resection. Neuropsychologia 31: 1-15. [DOI] [PubMed] [Google Scholar]
- Salmon, E., Van der Linden, M., Collette, F., Delfiore, G., Maquet, P., Degueldre, C., Luxen, A., and Franck, G. 1996. Regional brain activity during working memory tasks. Brain 119: 1617-1625. [DOI] [PubMed] [Google Scholar]
- Scaccianoce, S., Del Bianco, P., Caricasole, A., Nicoletti, F., and Catalani, A. 2003. Relationship between learning, stress and hippocampal brain-derived neurotrophic factor. Neuroscience 121: 825-828. [DOI] [PubMed] [Google Scholar]
- Schaaf, M.J., Workel, J.O., Lesscher, H.M., Vreugdenhil, E., Oitzl, M.S., and de Kloet, E.R. 2001. Correlation between hippocampal BDNF mRNA expression and memory performance in senescent rats. Brain Res. 915: 227-233. [DOI] [PubMed] [Google Scholar]
- Schaub, R.T., Anders, D., Golz, G., Gohringer, K., and Hellweg, R. 2002. Serum nerve growth factor concentration and its role in the preclinical stage of dementia. Am. J. Psychiatry 159: 1227-1229. [DOI] [PubMed] [Google Scholar]
- Scott, S.A., Mufson, E.J., Weingartner, J.A., Skau, K.A., and Crutcher, K.A. 1995. Nerve growth factor in Alzheimer's disease: Increased levels throughout the brain coupled with declines in nucleus basalis. J. Neurosci. 15: 6213-6221. [DOI] [PMC free article] [PubMed] [Google Scholar]
- Siegel, G.J. and Chauhan, N.B. 2000. Neurotrophic factors in Alzheimer's and Parkinson's disease brain. Brain Res. Brain Res. Rev. 33: 199-227. [DOI] [PubMed] [Google Scholar]
- Sturchler-Pierrat, C., Abramowski, D., Duke, M., Wiederhold, K.H., Mistl, C., Rothacher, S., Ledermann, B., Burki, K., Frey, P., Paganetti, P.A., et al. 1997. Two amyloid precursor protein transgenic mouse models with Alzheimer disease-like pathology. Proc. Natl. Acad. Sci. 94: 13287-13292. [DOI] [PMC free article] [PubMed] [Google Scholar]
- Sugaya, K., Greene, R., Personett, D., Robbins, M., Kent, C., Bryan, D., Skiba, E., Gallagher, M., and McKinney, M. 1998. Septo-hippocampal cholinergic and neurotrophin markers in age-induced cognitive decline. Neurobiol. Aging 19: 351-361. [DOI] [PubMed] [Google Scholar]
- Tolman, E.C. 1948. Cognitive maps in rats and men. Psychol. Rev. 55: 189-208. [DOI] [PubMed] [Google Scholar]
- Tuszynski, M.H., Thal, L., Pay, M., Salmon, D.P., U., H.S., Bakay, R., Patel, P., Blesch, A., Vahlsing, H.L., Ho, G., et al. 2005. A phase 1 clinical trial of nerve growth factor gene therapy for Alzheimer disease. Nat. Med. 11: 551-555. [DOI] [PubMed] [Google Scholar]
- Ueyama, T., Kawai, Y., Nemoto, K., Sekimoto, M., Tone, S., and Senba, E. 1997. Immobilization stress reduced the expression of neurotrophins and their receptors in the rat brain. Neurosci. Res. 28: 103-110. [DOI] [PubMed] [Google Scholar]
- Van Dam, D., D'Hooge, R., Staufenbiel, M., Van Ginneken, C., Van Meir, F., and De Deyn, P.P. 2003. Age-dependent cognitive decline in the APP23 model precedes amyloid deposition. Eur. J. Neurosci. 17: 388-396. [DOI] [PubMed] [Google Scholar]
- von Richthofen, S., Lang, U.E., and Hellweg, R. 2003. Effects of different kinds of acute stress on nerve growth factor content in rat brain. Brain Res. 987: 207-213. [DOI] [PubMed] [Google Scholar]
- Westerman, M.A., Cooper-Blacketer, D., Mariash, A., Kotilinek, L., Kawarabayashi, T., Younkin, L.H., Carlson, G.A., Younkin, S.G., and Ashe, K.H. 2002. The relationship between Aβ and memory in the Tg2576 mouse model of Alzheimer's disease. J. Neurosci. 22: 1858-1867. [DOI] [PMC free article] [PubMed] [Google Scholar]
- Wood, E.R., Dudchenko, P.A., and Eichenbaum, H. 1999. The global record of memory in hippocampal neuronal activity. Nature 397: 613-616. [DOI] [PubMed] [Google Scholar]


