

Abstract
OBJECTIVE
To describe the distribution of hemoglobin and prevalence of anemia in Nepali children living in the Terai region by potential risk factors for deficiency.
DESIGN
This was a cross-sectional, community-based study of baseline characteristics of children enrolled in a randomized, placebo-controlled clinical trial between January and March 2002. Participants were weighed and measured and had their blood drawn. Their mothers contributed demographic, morbidity, and feeding data.
SUBJECTS
There were 569 4- to 17-month old children. Statistical models were based on 490 children.
RESULTS
Anemia was prevalent: 58% of the children had a hemoglobin < 105 g/L. Iron deficiency anemia (anemia with erythrocyte protoporphyrin (EP) > 90 μmol/mol heme) was present in 43% of the children. Severe anemia was rare: less than 2.0% of the children had a hemoglobin < 70 g/L. The mean 35 (SD) hemoglobin concentration was 101 (12.5) g/L. Stunting and wasting were prevalent: 30.8% were stunted (length-for-age Z-score < −2) and 18.1% were wasted (weight-for-length Z-score < −2). Bivariate analyses revealed age, caste, socio-economic status (SES), dietary diversity, stunting, and underweight were associated with hemoglobin concentration and/or anemia. In multivariate models with and without EP, age and caste were found to be strong predictors of both hemoglobin concentration and anemia.
CONCLUSIONS
Anemia and iron deficiency increased strongly with age and low caste status among the study children. The data reveal the importance of targeting interventions to children in the first year of life before they become anemic and iron deficient.
Descriptors: anemia, iron deficiency, infancy, Nepal, malnutrition, hemoglobin
INTRODUCTION
Anemia is a worldwide public health problem. Prevalence estimates indicate anemia is present in 43% of children less than four years of age (Ezzati et al., 2002). It is caused by nutritional deficiencies (i.e., iron, folic acid, vitamin B12, and vitamin A), infection (i.e., helminth), and blood disorders (i.e., haemoglobinopathies). Among the different types of anemia, iron-deficiency anemia is the most common. The World Health Organization (WHO) estimates that 50% of anemia can be attributed to iron deficiency (DeMaeyer and Adiels-Tegman, 1985; Stoltzfus et al., 2005). This is an estimated global average with wide variability in different locations.
For the first few months of life, exclusively breastfed normal–weight children consume enough iron from their mothers’ breast milk to meet their needs. However, beginning around 6 months infants require an additional source of iron to prevent deficiency (WHO/UNICEF, 1998). Poverty (James et al., 1997), poor appetite from malnutrition or illness (Brown et al., 1995), and maternal feeding beliefs and practices that may result in withholding food items from their children, such as delayed weaning (Underwood, 1985), contribute to young children not receiving sufficient quantities of the iron-rich foods that they need (WHO/UNICEF, 1998).
Iron-deficiency anemia is of concern because it is associated with behavioral abnormalities, and impaired cognitive development and function (Lozoff et al, 1988; Beard, 2001). Young children are at high risk for developing iron-deficiency anemia because of the poor bio-availability of and increased demand for iron in their diet. The timing of this deficiency during the most active period of brain development and the potential for irreversible brain damage adds to the concern in young children (Beard, 2001).
The epidemiology of anemia varies substantially between different ecological and socio-cultural settings and has not been previously described for children living in the lowland Terai region of south central Nepal. Therefore our goal was to describe the prevalence and severity of anemia in young children. The purpose of the analysis is to guide the development and targeting of appropriate interventions to combat anemia in a setting that is representative of southern Nepal and northern India.
SUBJECTS AND METHODS
Study population
The study was conducted in the lowland Terai region of south central Nepal in Sarlahi District, which borders Northern India. Subsistence farming is the primary occupation in this region. Crops include rice, maize, sugarcane, tobacco, and an assortment of vegetables and legumes. The staple meal includes rice, lentils, and a curried vegetable. Goats, water buffalos, chickens, ducks, and fish are raised and sold for meat; however, consumption is low and depends on caste and socio-economic status.
Our study was a cross-sectional, community-based investigation of baseline characteristics of children enrolled in a sub-study of a randomized, placebo-controlled clinical trial of zinc and/or iron-folic acid supplementation on childhood mortality, morbidity, growth, and development (trial registered at www.clinicaltrials.gov NCT0109551) between January and March 2002. Eligible children 4- to 17-months of age were identified in one village development committee (VDC) from census data that were collected by study personnel between December 2000 and March 2001.
Anthropometric, socio-economic, developmental, and nutritional status data were collected on 569 children at a special study in the clinic and in participants’ homes at baseline. Fieldworkers obtained verbal consent from a parent or guardian in the child’s family. The study was approved by both the Johns Hopkins University Committee on Human Research and the Nepal Health Research Council.
Blood was primarily collected using a heel prick method to extract three drops of blood from each child. The first was wiped away, the second and third were used immediately for testing hemoglobin and zinc protoporphyrin respectively with a Hemoglobin Photometer (HemoCue AB; Andelholm, Sweden) and a Hematoflurometer (AVIV Biomedical Inc.; New Jersey). A sample of children received a venous blood draw (n = 70). The intention was to measure serum ferritin; however the venous blood draw was found to be too invasive by the study participants’ parents to continue. Fieldworkers performed daily quality control assessments with a standardized microcuvette and cover glass to test the reliability of the HemoCue and AVIV machines.
Anthropometric measures included weight, recumbent length, mid-upper arm circumference (MUAC), and head circumference. Trained fieldworkers measured weight to the nearest 100 grams using a SECA floor scale (Seca Corporation; Hanover, Maryland). Recumbent length, MUAC, and head circumference were measured to 0.1 cm using a Shorr Board for length (Shorr Productions; Olney, Maryland), a MUAC cloth tape, and a Ross Head Circumference Tape (Holtain Ltd.; United Kingdom).
Morbidity during the previous 24-hours and past 5 days was assessed via questionnaire when the child came to the clinic to receive the blood draw and anthropometric measurements. Fieldworkers asked the primary caretaker whether the child had experienced fever (defined as “hot to touch”), cough, difficult/rapid breathing (breathing faster than normal), or diarrhea (4 or more loose watery stools per day).
Questions about infant feeding were asked of the child’s mother by fieldworkers in the child’s home. The fieldworkers read a list of 14 foods and asked whether the mother had fed her child the foods in the previous 7 days. The food list comprised the most common foods and food categories fed to young children. It was developed from formative research where mothers were asked to free list all foods they fed to infants in this age range.
Fieldworkers recorded the presence of material assets, house construction, and water source in the child’s home prior to the start of data collection. These variables were later quantified and used to reflect the socio-economic status of each family. Basic demographic information including the child’s sex, caste, and birth date were also recorded. When caregivers were unable to remember the exact month and day of the child’s birth, local calendars with the lunar cycle and a list of local festivals were used to assist in recall.
Data analysis
Data were entered at the data center in Kathmandu using SQL Server 7.0 and analyzed using SPSS 11.0. Z-scores were calculated for three of the anthropometric measures using EpiInfo (1978 reference; Centers for Disease Control; Atlanta, GA). Stunting, wasting, and underweight were defined respectively as length-for-age, weight-for-length, and weight-for-age < −2 Z-scores. A diarrheal episode was defined as 4 or more watery stools per day (Katz et al., 1998).
The definition of anemia used in this analysis was a hemoglobin value < 105 g/L. While this number is lower than 110 g/L, the cut-off proposed by the World Health Organization (WHO) and the Centers for Disease Control (CDC) for children 6 months to 5 years, it reflects the only reference value derived from iron supplementation data that were collected from breast-fed infants (Domellof, Dewey, et al., 2002). Iron-deficiency anemia was defined as anemia with an erythrocyte protoporphyrin (EP) value > 90 μmol/mole heme (Domellof, Dewey, et al., 2002).
Two scales were created as a means of summarizing dietary diversity and socio-economic status (SES). Principal components analysis was used to extract the factors for the scales. The most comprehensive factor with the largest eigenvalue >1 was selected for a reliability analysis. Chronbach’s alpha (Chronbach, 1951) was used to assess the internal consistency of the selected items.
We chose to look at dietary diversity because studies indicate it is related to nutritional adequacy in 6 to 24 month children (Ruel, 2003). Children who were exclusively breastfed or were breastfed and given only water as a supplement were placed in independent categories. The remainder of the children were categorized by the number of complementary foods they received. Nine of the 14 infant feeding foods were incorporated into a dietary diversity scale. These foods included: non-human milk, rice, flat bread, biscuits, greens and vegetables, lentils, fruit, egg, and meat. Infants do not consume large quantities of the other three foods that were omitted: watery rice gruel, corn mush, and pickled fruit or vegetable. A higher scale score reflected greater dietary diversity. Chronbach’s alpha for the dietary diversity scale was 0.86.
In creating the SES scale, 12 of the 17 related questions were retained. These included the presence of the following: having a household latrine, servant, cattle, bicycle, radio, farmable land, home garden plot, second floor on the house, roof, TV, electricity in the house, and bullock cart. Data were missing for 12 of the families. These families were excluded from the final analysis. A higher score on the SES scale reflected a greater number of possessions. Chronbach’s alpha for the SES scale was 0.78.
An exploratory analysis was performed on descriptive characteristics of the study sample at baseline. Bivariate relationships between hemoglobin, erythrocyte protoporphyrin, and potential risk factors for anemia and iron-deficiency anemia were examined. Means of continuous variables and proportions of categorical variables were analyzed using t- and Chi-Square tests. Odds ratios were calculated. The p-values (p<0.05) associated with these were used to determine which values were retained in the multivariate linear and logistic regression models. Multivariate models were created with hemoglobin alone and then with EP to delineate the individual contribution of iron deficiency.
RESULTS
Baseline characteristics
Six hundred and thirteen children were age eligible for participation, of whom, 44 were excluded during the enrollment period when after repeated attempts the family was not able to be located at home. Data were missing from a total of 79 children, 54 of whose families were unwilling to allow study personnel to draw blood from their young children. A comparison of study infants whose parents gave consent for the blood collection versus those who did not revealed no significant differences between the groups.
Among the study infants there were an equal number of girls and boys (Table 1). The age groups were relatively evenly distributed with slightly fewer infants in the 4 to 5 month category (16%) and more in the 12 to 14 month category (25%). Sixty-one percent belonged to the Vaiysha caste, ethnic Hindus who were traditionally classified as being merchants but who predominantly work as subsistence farmers and laborers today. Only 8% of study families had a household latrine. Twenty-nine percent reported that the child had diarrhea during the five days prior to the clinic visit. Thirty-one percent were stunted, 18% were wasted, and 51% were underweight. Mean hemoglobin was 101 g/L (SD = 12.5). The geometric mean of serum ferritin for the 70 children with this data available was 18.38 μg/L.
Table 1.
Characteristics of study sample
| N | n | (%) | ||
|---|---|---|---|---|
| Sex | 569 | |||
| Males | 285 | 50.1 | ||
| Female | 284 | 49.9 | ||
| Age Group | 569 | |||
| 4–5 months | 90 | 15.8 | ||
| 6–8 months | 109 | 19.2 | ||
| 9–11 months | 116 | 20.0 | ||
| 12–14 months | 140 | 24.6 | ||
| 15–17 months | 114 | 20.0 | ||
| Caste | 569 | |||
| Brahmin & Chhetri | 51 | 9.0 | ||
| Vaiysha | 344 | 60.5 | ||
| Shudra | 77 | 13.5 | ||
| Muslim | 97 | 17.0 | ||
| SES Scale1 | 557 | |||
| 0–1 possessions | 120 | 21.5 | ||
| 2–5 possessions | 287 | 51.5 | ||
| 6–12 possessions | 150 | 26.9 | ||
| Feeding Groups2 | 561 | |||
| Breast milk only | 93 | 16.6 | ||
| Breast milk & Water only | 59 | 10.5 | ||
| 1–3 complementary foods | 79 | 14.1 | ||
| 4 – 6 complementary foods | 227 | 40.4 | ||
| 7–9 complementary foods | 103 | 18.4 | ||
| Diarrhea3 | 503 | 148 | 29.4 | |
| Stunted4 | 477 | 147 | 30.8 | |
| Wasted5 | 486 | 88 | 18.1 | |
| Underweight6 | 487 | 247 | 50.7 |
12-point material asset scale, missing data from 12 children;
missing infant feeding data on 8 subjects;
4 or more watery stools/day within past 5 days, missing data from 66 subjects;
length-for-age Z-score < −2, missing data from 92 subjects;
weight-for-length Z-score < −2, missing data from 83 subjects;
weight-for-age Z-score, missing data from 82 subjects
Anemia was highly prevalent but not very severe (Table 2). Iron deficiency anemia was prevalent (43.1%).
Table 2.
Anemia prevalence and severity and its relation to iron deficiency (N=490)
| Hemoglobin values | n | Anemia prevalence (%) | n | Iron deficiency anemia prevalence (%) |
|---|---|---|---|---|
| 90–105 g/L | 213 | 43.5 | 147 | 30.0 |
| 70–89 g/L | 60 | 12.2 | 55 | 11.2 |
| < 70 g/L | 10 | 2.0 | 9 | 1.8 |
Iron deficiency anemia: Erythrocyte protoporphyrin > 90 μmol/mol heme; Domellof, Dewey, et. al., 2002
Ninety-five percent of the infants had been breast fed in the seven days prior to their mothers being questioned about infant feeding (Figure 1). Of these, 17.2% were exclusively breastfed. The oldest child reported to be exclusively breastfed was 10.0 months. The mean number of complementary foods that the study children consumed was 5. Animal foods were consumed infrequently (Figure 1) with only 30.8 % of 6 to 9 month children eating animal foods (egg, fish, chicken, or meat) in the previous 7 days. A Chi-square test revealed significant differences (p<0.01) between the exclusive breastfeeding and other feeding groups by age (Figure 1). With increasing age, Nepali children exclusively breastfed less and ate more complementary foods.
Figure 1.
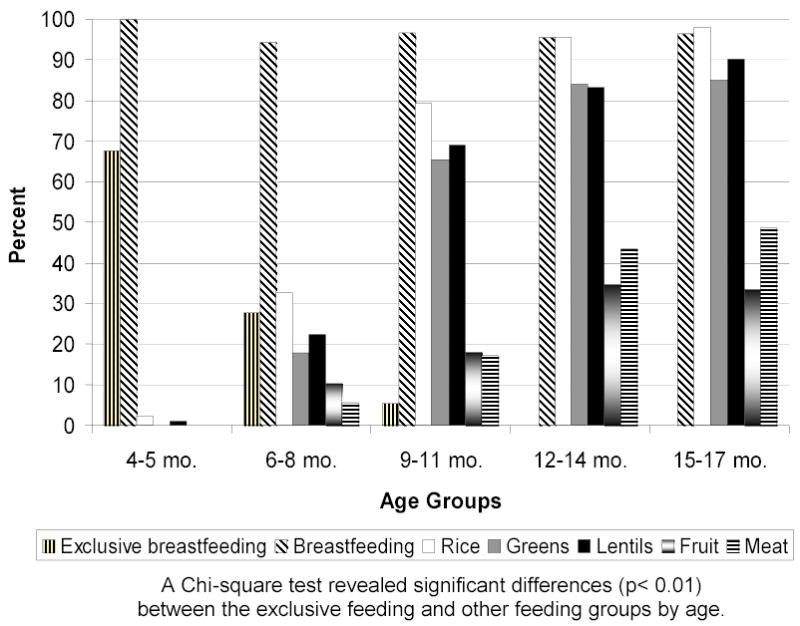
Reported consumption of selected foods in the past 7 days, by age
Risk factors for anemia and iron-deficiency
In bivariate analyses, the hemoglobin values decreased as age increased and caste status decreased (Table 3). Muslims had a lower prevalence of anemia than Shudras, the lowest Hindu caste. Hemoglobin values tended to increase with the number of possessions and decreased with the introduction of complementary foods. There were significant associations in the prevalence of anemia between the age, caste, SES, feeding and stunting groups (p<0.05). Associations observed between hemoglobin and the baseline characteristics were similar for EP. Iron deficiency anemia was associated with age, caste, SES and feeding groups (p<0.05).
Table 3.
Iron-status indicators by baseline characteristics1
| N | Hemoglobin mean g/L (SD) | Anemia2 % | Protoporphyrin mean μmol/mole heme (SD) | Iron-deficiency anemia3 % | |
|---|---|---|---|---|---|
| Sex | 490 | ||||
| Males | 247 | 101.2 (12.2) | 59.9 | 135.71 (94.7) | 47.0 |
| Females | 243 | 101.4 (12.7) | 55.6 | 123.7 (84.0) | 39.1 |
| Age (months) | 490 | ||||
| 4–5 | 80 | 106.7 (11.1) | 40.0 | 96.9 (61.7) | 26.3 |
| 6–8 | 93 | 101.7 (13.1) | 50.5 | 121.6 (99.7) | 30.1 |
| 9–11 | 105 | 101.5 (11.2) | 59.0 | 122.3 (70.1) | 46.7 |
| 12–14 | 118 | 99.2 (12.0) | 65.3 | 156.4 (99.0) | 56.8 |
| 15–17 | 94 | 98.7 (13.4) | 69.1 | 140.8 (96.6) | 48.9 |
| Caste | 490 | ||||
| Brahmin & Chhetri | 47 | 108.4 (10.2) | 25.5 | 110.4 (96.8) | 19.1 |
| Vaiysha | 301 | 101.1 (12.3) | 61.1 | 126.1 (78.0) | 44.2 |
| Shudra | 65 | 96.3 (12.9) | 72.3 | 152.6 (93.8) | 63.1 |
| Muslim | 77 | 101.8 (12.0) | 51.9 | 136.6 (112.0) | 36.4 |
| SES Scale (possessions) | 484 | ||||
| 0–1 | 105 | 97.5 (11.9) | 66.7 | 144.7 (95.8) | 54.3 |
| 2–5 | 246 | 100.7 (13.3) | 61.0 | 131.9 (89.0) | 44.7 |
| 6–12 | 133 | 105.4 (10.1) | 45.1 | 114.2 (84.8) | 31.6 |
| Feeding Groups | 485 | ||||
| Breast milk only | 81 | 105.8 (11.2) | 44.4 | 101.7 (65.3) | 28.4 |
| Breast milk/water | 49 | 101.8 (11.1) | 51.0 | 113.4 (85.6) | 34.7 |
| 1–3 foods | 71 | 99.8 (13.4) | 60.6 | 136.8 (103.9) | 45.1 |
| 4–6 foods | 191 | 100.4 (12.3) | 61.3 | 132.5 (85.1) | 47.1 |
| 7–9 foods | 93 | 99.6 (12.9) | 65.6 | 152.4 (102.5) | 51.6 |
| Diarrhea4 | 490 | ||||
| Yes | 145 | 102.0 (13.9) | 54.5 | 127.0 (87.0) | 40.7 |
| No | 345 | 101.0 (11.8) | 59.0 | 131.0 (90.9) | 44.1 |
| Stunted5 | 465 | ||||
| Yes | 139 | 98.5 (12.4) | 69.1 | 136.8 (96.0) | 49.6 |
| No | 326 | 102.8 (12.3) | 52.1 | 124.4 (82.7) | 39.0 |
| Wasted6 | 473 | ||||
| Yes | 85 | 100.5 (13.4) | 60.0 | 141.6 (115.3) | 45.9 |
| No | 388 | 101.7 (12.2) | 56.4 | 127.1 (83.9) | 41.5 |
Bold numbers indicate significant associations (p< 0.05) between characteristic and indicator using Chi-square tests for dichotomous variables and ANOVA for continuous variables. The associations were significant (p < 0.01) with the exception of SES and erythrocyte protoporphyrin (EP), stunting and EP, wasting and EP, and feeding and IDA (p < 0.05);
Hemoglobin ≤ 105 g/L;
Anemia with EP > 90 μmol/mol heme;
12-point material asset scale, missing 6;
missing data from 5 subjects;
4 or > watery stools/day in past 5 days;
height-for-age Z-score < −2, missing data from 25 children;
weight-for-height Z-score < −2, missing data from 17 children.
In multivariate regression models, age and caste were the only significant predictors of hemoglobin and anemia (Table 4). Anemia and iron deficiency increased strongly with age. The oldest infants were 3 times more likely to be anemic than the youngest ones. Differences between caste groups among Hindus and between Hindus and Muslims were observed. Compared with the high caste Brahmins and Chhetris, both the lower caste Hindu groups and Muslims were at greater risk of developing anemia and iron deficiency. The risk was greatest for the lowest caste group, the Shudras.
Table 4.
Predictors of hemoglobin concentration and anemia from multivariate models, with and without adjustment for iron deficiency
| Variables1 | Odds ratio (95% CI) for anemia risk2 | Adjusted mean hemoglobin3 | ||
|---|---|---|---|---|
| Model 1 | Model 2 | Model 1 | Model 2 | |
| Age (months) | ||||
| 4–5 | 1.0 | 1.0 | 106.9 (104.3 – 109.5) | 104.7 (102.3 – 107.1) |
| 6–8 | 1.8 (1.0– 3.5) | 1.6 (0.8 – 3.1) | 100.9 (98.5 – 103.4) | 100.0 (97.9 – 102.2) |
| 9–11 | 2.3 (1.3 – 4.2) | 1.7 (0.9 – 3.3) | 101.5 (99.3 – 103.8) | 101.7 (99.6 – 103.7) |
| 12–14 | 2.9 (1.6 – 5.3) | 1.7 (0.9 – 3.3) | 99.6 (97.4 – 101.8) | 101.4 (99.4 – 103.4) |
| 15–17 | 3.6 (1.9 – 6.9) | 2.7 (1.4 – 5.4) | 98.7 (92.3 – 101.1) | 99.1 (97.0 – 101.3) |
| Caste | ||||
| Brahmins & Chhetris | 1.0 | 1.0 | 108.2 (104.8 – 111.7) | 107.1 (104.0 – 110.2) |
| Vaiysha | 4.5 (2.2 – 9.1) | 4.5 (2.1 – 9.4) | 101.2 (99.9 – 102.5) | 101.1 (99.9 – 102.3) |
| Shudra | 7.9 (3.3 – 19.0) | 6.2 (2.5 – 15.6) | 96.0 (93.1 – 98.9) | 98.1 (95.4 – 100.7) |
| Muslim | 3.0 (1.3 – 6.8) | 3.3 (1.4 – 7.7) | 101.9 (99.2 – 104.5) | 101.1 (98.7 – 103.5) |
| EP4 (umol/mol heme) | ||||
| < 70 | 1.0 | 108.2 (106.1 – 110.3) | ||
| 70–89 | 1.8 (1.0 – 3.3) | 105.2 (102.9 – 107.4) | ||
| 90–119 | 2.8 (1.6 – 5.2) | 103.1 (101.0 – 105.2) | ||
| ≥ 120 | 7.5 (4.3 – 13.1) | 94.9 (93.4 – 96.4) | ||
Bold numbers indicate significant associations (p < 0.05) between the reference and other group variables;
Hemoglobin ≤ 105 g/L, anemia risk is from a logistic regression model;
Adjusted mean hemoglobin values were determined from linear regression models where variables were centered by their frequencies.
Erythrocyte proporphyrin (μmol/mol heme).
When EP was entered into the model, only the oldest age group was significantly associated with anemia. Even after controlling for EP the 15- to 17-month olds were twice as likely to develop anemia than the children in the youngest age category. The relation of age, but not caste to hemoglobin is largely explained by iron deficiency.
DISCUSSION
Prevalence of anemia and iron-deficiency anemia
Anemia affected 58% of our sample of young children in the first two years of life living in the Terai region of Nepal. Age and caste membership were risk factors for anemia and iron-deficiency anemia in this sample. Older, low-caste children are at greatest risk for acquiring anemia with a prevalence of 11% among 15–17 month children in the lowest caste group. The prevalence of growth retardation was also high. Caregivers fed the study infants a limited selection of complementary foods. Staple foods such as rice and lentils were fed more frequently than mineral-rich animal foods and vegetables. There was a high prevalence of diarrhea. Previous research illustrates that different types of nutrient deficiencies have been associated with anemia in infants. This study further clarifies that iron deficiency accounts for a large percentage (about 75%) of the anemia observed in South Asian infants less than three years of age, but it is not the sole risk factor.
Our findings corroborate past research that illustrates the high prevalence of anemia and iron-deficiency in South Asian pre-school children. Our 77% prevalence for anemia (110 g/L) is about the same as or higher than previous reports from similar populations of Nepali and Indian children less than three years of age (Mason et al., 2001; UNICEF, 1997; Kapoor et al., 2002; Gomber et al., 1998). Of interest was the low prevalence of severe anemia (2%) in this population. It was lower than the prevalence reported for an Indian sample between 9- and 36-months of age (8%) (Kapoor et al., 2002). Iron deficiency anemia was more prevalent in our sample (43%) than it was in an Indian sample of 9- to 36-month children (41%) (Gomber et al., 1998). In sum, our study children had a similar or slightly higher prevalence of anemia and a higher prevalence of iron deficiency than children observed in other studies conducted in the region, but the severity of their anemia was lower.
Risk factors for anemia and iron-deficiency anemia
Age and caste membership were found to be risk factors for anemia and iron-deficiency anemia in our sample of Nepali children under two years of age. The child feeding literature highlights the risk of iron-deficiency anemia in infants who continue exclusive breastfeeding beyond six months of age (Dewey, 2001; WHO, 1998). Because of the poor bio-availability of iron present in weaning foods and both cultural and socio-economic factors that make it difficult for families to afford animal products rich in iron, young children often do not consume the nutrients they need (WHO/UNICEF, 1998). While this may account for some of the anemia in the older age groups, it does not explain the high prevalence of anemia in the 4- to 5-month age group. There is evidence that both body weight and birthweight are associated with low iron stores in infants 4- to 18-months of age (Wharf et al., 1997). Half our sample was underweight. Between 1998 and 2001 43% of babies born to mothers living in Sarlahi weighed less than 2500 grams (Christian et al., 2003). It is very likely that low iron stores contributed to anemia in the young children we studied.
We found the risk of having anemia and iron-deficiency anemia was dependent on caste status. Caste is a Hindu construct that determines, among other factors, vocation, economic viability, and social hierarchy (Cordeaux et al., 2004). There is a code of behavior to which each caste group subscribes. In our study, we observed differences in the prevalence of anemia and iron deficiency anemia between high and low-caste Hindu groups, and the two Hindu groups compared with the Muslims.
Cultural differences between Nepali Hindus and Muslims clearly exist. In a study conducted among pregnant women in India, investigators found Muslim religion to be protective for anemia among adult women (Bentley and Griffiths, 2003). In our study, Muslim religion was not protective for anemia. Muslim children were at a slightly lower risk of having anemia and iron-deficiency anemia than the lower-caste Viaysha and Shudra infants; however, their risk was significantly higher than that of the high-caste Brahmin and Chhetri children.
We did not observe differences to be associated within hemoglobin levels or risk of having anemia or iron-deficiency anemia by gender. This is in contrast to sex differences observed in 4- to 9-month Swedish and Honduran infants (Domellof, Lonnerdal, et al., 2002). In their study, boys scored worse on four iron-status indicators compared with girls and were 10 times more likely than girls to have iron-deficiency anemia. The authors attribute these differences to both genetic determinants and an increased incidence in true iron deficiency in boys (Domellof, Lonnerdal, et al., 2002). Sex differences in feeding practices were not found to be present in a prior study conducted in our research area that examined the association between feeding practices and risk of xerophthalmia on Nepali children (Gittelsohn et al., 1997).
Bivariate analyses revealed associations between stunting and anemia, wasting and EP, and underweight and EP, anemia, and iron-deficiency anemia. However, these associations were no longer significant once they were adjusted for age and caste status in our regression models. Our findings contradict other research that has found strong associations between growth and iron-deficiency anemia (Dewey 2001; Lartey et al., 2000; WHO/UNICEF, 1998). Despite the lack of association in our sample, growth faltering was clearly present.
In our sample, the association between dietary diversity and anemia was confounded by age. Mothers were breastfeeding (95%) more often than they were feeding their children complementary foods (73%). Rice and lentils, the two foods most commonly consumed by the majority of Nepalis living in the Terai, respectively were fed only to 66% and 57% of the children in the previous 7 days. Iron-rich foods – green leafy vegetables, and meat– were given infrequently. The data indicate that at baseline the young children enrolled in our study were supplementing their breast milk diet with limited complementary foods, few of which could be considered iron-rich. Research investigating the relation of feeding practices to risk of xerophthalmia in Nepali children 1 to 6 years of age living in a neighboring VDC in Sarlahi District was consistent with our findings (Gittelsohn et. al., 1997). In that xerophthalmia study, breast milk was the primary infant feeding food. Complementary foods were introduced after 6 months of age; however, they were fed infrequently until the child turned two and began to consume more complementary foods than breast milk (Gittelsohn et al., 1997).
Dietary diversity was not a predictor of anemia in our cohort of Nepali children; however, the question remains whether it would have been had our sample been older. Late weaning has been found to be a significant risk factor for iron-deficiency anemia in infants 1 to 2 years of age (Sultan and Zuberi, 2003). The introduction of complementary feeding programs might be one way of addressing the problem.
A recent study emphasizes the importance of quality rather than quantity when selecting complementary foods for children during the latter half of the first and second years of life (Lutter and Rivera, 2003). Our data indicate differences between the meat consumption of different caste groups; however, the groups that are eating more meat, the lower caste Hindus and Muslims, are the same groups that are at greatest risk for acquiring iron-deficiency anemia.. Traditionally, high caste Hindus were lacto-vegetarians, consuming milk products but no eggs. These data make more sense when viewed in light of the statistic that only a fourth of the sample reported eating any meat in the 7 days prior to data collection.
In addition to the risk factors measured in this study, there are other plausible ones that have been outlined in the literature. These include deficiencies in Vitamin A, B12, and folic acid and parasitic infections. Since 1993 a countrywide Vitamin A supplementation program has been in effect in Nepal. Local village health workers give 6 to 60 month children high-dose Vitamin A supplements twice a year. The Vitamin A program has served as a preventative agent against Vitamin A deficiency in our study children. Because Vitamin B12 is found in animal products and the children in our sample have been observed to consume few animal products, it is possible that Vitamin B12 deficiency contributed to the high prevalence of anemia we observed. Folic acid does not appear to be a factor in this area. A randomized, clinical controlled trial found no effect of folic acid alone on maternal anemia or iron status after it was administered to pregnant women (Christian et al., 2003). Plasmodium vivax malaria and hookworm are two parasites that are present in the South central Terai region of Nepal. There is evidence that malaria is associated with anemia in the study area. It was found to be a contributor to pregnancy anemia in a sample of Nepali women living in Sarlahi District (Dreyfuss et al., 2000); however, hookworm is unlikely to cause anemia in children as young as our sample. Further research on these factors that contribute to anemia is warranted, especially research with Vitamin B12.
In sum, these data highlight iron deficiency anemia as being a public health problem in young children living in south central Nepal. Because iron deficiency anemia rises steeply in infancy, it is important to target interventions to children in the first year of life before they become anemia and iron deficient. Additionally, there is need to design culture-specific interventions to target the most marginalized sub-populations, which in Nepal, are families of low caste.
Acknowledgments
The authors wish to acknowledge the Nepal Nutrition Intervention Project – Sarlahi (NNIPS) staff members for their effort, dedication, and enthusiasm in implementing the study, especially Shishir Var Shrestha, Sharada Ram Shrestha, Tirtha Raj Shakya, Gokarna Subedi, Bikram Tamang, Jaybar Shrestha, Kalawati Giri, Chandeswor Nepali, Rajeswori Kafle, and Parvati Malli.
This study was conducted by the Center for Human Nutrition and the Sight and Life Institute in the Department of International Health, Bloomberg School of Public Health, Johns Hopkins University (JHU) Baltimore, Maryland, USA, under grants from the National Institutes of Health, Bethesda, Maryland (HD 38753), the Bill and Melinda Gates Foundation, Seattle, Washington (810-2054), and a Cooperative Agreement between JHU and the Office of Health and Nutrition, US Agency for International Development, Washington DC (HRN-A-00-97-00015-00).
Footnotes
This study was funded by the National Institutes of Health, Bethesda, Maryland (HD 38753), the Bill and Melinda Gates Foundation, Seattle, Washington (810-2054), and a Cooperative Agreement between JHU and the Office of Health and Nutrition, US Agency for International Development, Washington DC (HRN-A_00-97-00015-00).
References
- Beard J. Iron biology in immune function, muscle metabolism and neuronal functioning. J Nutr. 2001;131:568S–580S. doi: 10.1093/jn/131.2.568S. [DOI] [PubMed] [Google Scholar]
- Bentley ME, Griffiths PL. The burden of anemia among women in India. Eur J Clin Nutr. 2003;57(1):52–60. doi: 10.1038/sj.ejcn.1601504. [DOI] [PubMed] [Google Scholar]
- Brown KH, Peerson JM, Lopez de Romana G, de Kanashiro HC, Black RE. Validity and epidemiology of reported poor appetite among Peruvian infants from a low-income, periurban community. Am J Clin Nutr. 1995;61(1):26–32. doi: 10.1093/ajcn/61.1.26. [DOI] [PubMed] [Google Scholar]
- Christian P, Khatry SK, Katz J, Pradhan EK, LeClerq SC, Shrestha SR, Adhikari RK, Sommer A, West KP., Jr Supplementation with micronutrients in addition to iron and folic acid does not further improve the hematologic status of pregnant women in rural Nepal. J Nutr. 2003;133(11):3492–8. doi: 10.1093/jn/133.11.3492. [DOI] [PubMed] [Google Scholar]
- Chronbach LJ. Coefficient alpha and the internal structure of tests. Psychometrika. 1951;16:297–334. [Google Scholar]
- Cordaux R, Aunger R, Bentley G, Nasidze I, Sirajuddin SM, Stoneking M. Independent origins of Indian caste and tribal paternal lineages. Curr Biol. 2004;14(3):231–235. doi: 10.1016/j.cub.2004.01.024. [DOI] [PubMed] [Google Scholar]
- DeMaeyer E, Adiels-Tegman M. The prevalence of anemia in the world. World Health Stat Q. 1985;38(3):302–316. [PubMed] [Google Scholar]
- Dewey KG. Nutrition, growth, and complementary feeding of the breastfed infant. Pediatr Clin North Am. 2001;48(1):87–104. doi: 10.1016/s0031-3955(05)70287-x. [DOI] [PubMed] [Google Scholar]
- Domellof M, Dewey KG, Lonnerdal B, Cohen RJ, Hernell O. The diagnostic criteria for iron deficiency in infants should be reevaluated. J Nutr. 2002;132(12):3680–3686. doi: 10.1093/jn/132.12.3680. [DOI] [PubMed] [Google Scholar]
- Domellof M, Lonnerdal B, Dewey KG, Cohen RJ, Rivera LL, Hernell O. Sex differences in iron status during infancy. Pediatrics. 2002;110 (3):545–552. doi: 10.1542/peds.110.3.545. [DOI] [PubMed] [Google Scholar]
- Dreyfuss ML, Stoltzfus RJ, Shrestha JB, Pradhan EK, LeClerq SC, Khatry SK, Shrestha SR, Katz J, Albonico M, West KP. Hookworms, Malaria and Vitamin A Deficiency Contribute to Anemia and Iron Deficiency among Pregnant Women in the Plains of Nepal. J Nutr. 2000;130:2527–2536. doi: 10.1093/jn/130.10.2527. [DOI] [PubMed] [Google Scholar]
- Ezzati M, Lopez AD, Rodgers A, Vander Hoorn S, Murray CJ the Comparative Risk Assessment Collaborating Group. Selected major risk factors and global and regional burden of disease. Lancet. 2002;360(9343):1347–60. doi: 10.1016/S0140-6736(02)11403-6. [DOI] [PubMed] [Google Scholar]
- Gittelsohn J, Shankar AV, West KP, Jr, Ram R, Dhungel C, Dahal B. Infant feeding practices reflect antecedent risk of xerophthalmia in Nepali children. Eur J Clin Nutr. 1997;51(7):484–490. doi: 10.1038/sj.ejcn.1600435. [DOI] [PubMed] [Google Scholar]
- Gomber S, Kumar S, Rusia U, Gupta P, Agarwal KN, Sharma S. Prevalence and etiology of nutritional anaemias in early childhood in an urban slum. Indian J Med Res. 1998;107:269–273. [PubMed] [Google Scholar]
- James WP, Nelson M, Ralph A, Leather S. Socioeconomic determinants of health. The contribution of nutrition to inequalities in health. BMJ. 1997;314(7093):1545–1549. doi: 10.1136/bmj.314.7093.1545. [DOI] [PMC free article] [PubMed] [Google Scholar]
- Kapoor D, Agarwal KN, Sharma S, Kelo K, Kaur I. Iron status of children aged 9 –36 months in an urban slum Integrated Child Development Services project in Delhi. Indian Pediatr. 2002;39(2):136–144. [PubMed] [Google Scholar]
- Katz J, West KP, Jr, LeClerq SC, Thapa MD, Khatry SK, Shresta SR, Pradhan EK. Agreement between clinical examination and parental morbidity histories for children in Nepal. J Trop Pediatr. 1998;44:225–229. doi: 10.1093/tropej/44.4.225. [DOI] [PubMed] [Google Scholar]
- Lartey A, Manu A, Brown KH, Dewey KG. Predictors of micronutrient status among six- to twelve-month old breast-fed Ghanaian infants. J Nutr. 2000;130(2):199–207. doi: 10.1093/jn/130.2.199. [DOI] [PubMed] [Google Scholar]
- Lozoff B, Brittenham GM, Wolf AW, Mclish DK, Kuhnert PM, Jimenez E, Jimenez R, Mora LA, Gomez I, Krauskoph D. Iron deficiency anemia and iron therapy effects on infant development test performance. Pediatrics. 1988;79:981–985. [Published erratum appears in Pediatrics 1988 81:683. [PubMed] [Google Scholar]
- Lutter CK, Rivera JA. Nutritional status of infants and young children and characteristics of their diets. J Nutr. 2003;133(9):2941S– 2949S. doi: 10.1093/jn/133.9.2941S. [DOI] [PubMed] [Google Scholar]
- Mason JB, Lotfi M, Dalmiya N, Sethuraman K, and Deitchler M, with Geibel S, Gillenwater K, Gilman A, Mason K, and Mock, N (2001): The Micronutrient Report Current Progress and Trends in the Control of Vitamin A, Iron, and Iodine Deficiencies. Micronutrient Initiative: 240.
- Ruel MT. Operationalizing dietary diversity: a review of measurement issues and research priorities. J Nutr. 2003;133 (11 Suppl 2):3911S–3926S. doi: 10.1093/jn/133.11.3911S. [DOI] [PubMed] [Google Scholar]
- Stoltzfus R, Mullany L, Black RE (2005): Iron deficiency anaemia. In : Comparative Quantification of Health Risks: The Global and Regional Burden of Disease due to 25 Selected Major Risk Factors. World Health Organization/Harvard University Press, Cambridge.
- Sultan AN, Zuberi RW. Late weaning: the most significant risk factor in the development of iron deficiency anemia at 1–2 years of age. J Ayub Med Coll Abbottabad. 2003;15(2):3–7. [PubMed] [Google Scholar]
- Underwood BA. Weaning practices in deprived environments: the weaning dilemma. Pediatrics. 1985;75(1 Pt 2):194–8. [PubMed] [Google Scholar]
- UNICEF (1997): Malnutrition in South Asia: A regional profile. UNICEF Regional Office for South Asia.
- Wharf SG, Fox TE, Fairweather-Tait ST, Cook JD. Factors affecting iron stores in infants 4–18 months of age. Eur J Clin Nutr. 1997;51:504–509. doi: 10.1038/sj.ejcn.1600428. [DOI] [PubMed] [Google Scholar]
- WHO/UNICEF (1998): Complementary feeding of young children in developing countries: a review of current scientific knowledge. Geneva: World Health Organization.