

Abstract
In a sample of 100 patients with recurrent major depression, we collected depression severity data early and late in acute-phase cognitive therapy, plus a wide range of psychosocial variables that have been studied extensively in depression research, including measures of interpersonal, cognitive, and social functioning, and personality traits using an inventory that is linked with the Big-Three tradition in personality assessment theory. By assessing this broad range of variables in a single study, we could examine the extent to which relations of these variables with depression were due to (a) a common factor shared across this diverse set of constructs, (b) factors shared among each type of construct (personality vs. psychosocial measures), or (c) specific aspects of the individual measures. Only the most general factor shared across the personality and psychosocial variables predicted later depression.
A wide variety of personality (Clark, Watson, & Mineka, 1994), social (Hirschfeld et al., 2000), interpersonal (Vittengl, Clark, & Jarrett, 2003), and cognitive (Alloy et al., 1999) variables have been shown to be correlates of depression severity. In some (e.g., Bell-Dolan, Reaven, & Peterson, 1993; Lewinsohn, Rohde, Seeley, Klein, & Gotlib, 2000), but not all (Boyce & Parker, 1985; Sato et al., 1999) studies, these variables have been shown to predict future depression severity. In studies that have examined the intercorrelations of these measures, they typically are found to be intercorrelated (e.g., Schwartz, Kaslow, Seeley, & Lewinsohn, 2000). Therefore, it is important to determine which aspects of these variables are related to depression severity. Is it primarily the portion that they share that relates to depression severity, or are there some variables or their components that relate uniquely to depression?
Lara and Klein (1999) reviewed three major theoretical perspectives on the maintenance and persistence of depression—cognitive, interpersonal, and early adversity—and found some degree of empirical support for all three perspectives. They consider ways that cognitive and interpersonal factors and early adversity may interact to maintain and/or prolong depressive episodes, but more basic questions also deserve consideration. Specifically, are these factors independent of one another or overlapping in some respect? Are there one or more underlying causal factors that these variables share that contribute to their empirically observed correlation and are responsible for their relations with depression? If so, what is the nature of these underlying factors? Are there additional factors beyond the shared factors that are related to depression? If so, what is the nature of these nonshared factors?
Similarly, Schwartz et al. (2000) examined the role of attributional style in the psychological functioning of a large sample of adolescents and found that change in attributional style was associated with change in both depressive symptomatology and other psychosocial variables (e.g., social competence, coping skills). An unanswered question, however, is whether the observed changes are independent, or at least quasi-independent, or whether the associated change is due simply to change in common underlying factors. In other words, is the change in attributional style, depressive symptomatology, social competence, coping skills, and so forth in essence a broad change in one or more common factors or are there differentiable changes in specific factors?
Thus, the question that we sought to answer with this study is whether—and if so, the extent to which—conceptually distinctive variables, such as dysfunctional cognitions, interpersonal problems, and negative affectivity, share common underlying factors. Moreover, if they are found to have common factors, we wanted to investigate whether the relations of these variables to depression were attributable solely or primarily to these underlying shared factors or whether there also were aspects of these variables that had an independent relation to depressive symptoms. The answers to these questions have the potential to illuminate etiologic theories of depression. For example, if it is only the commonality among these variables that predicts depression severity, then theories that focus on particular cognitive or interpersonal processes are valid only insofar as the proposed processes themselves overlap. Alternatively, if there are specific aspects of these variables that predict depression severity above and beyond their common components, then depression theorists should focus on explaining how these particular aspects lead to depressive symptoms.
We collected data on a wide range of psychosocial variables that have been studied extensively in research on depression, including measures of interpersonal, cognitive, and social functioning. We also assessed 15 personality traits using a single omnibus personality inventory with well-known psychometric properties (i.e., internal consistency, temporal stability, and factor structure), which also is linked both theoretically and empirically with the Big-Three tradition (negative and positive temperament, plus disinhibition vs. constraint) in personality theory and assessment (Clark, 1993; Clark & Watson, 1999). By assessing in a single study this broad range of variables, all (or in the case of the personality traits, many) of which have been linked theoretically with depression, we are able to examine the extent to which the relations of these variables with depression are due to common factors that are shared across the diverse set of constructs these measures are purported to assess, or to specific factors of the various constructs assessed.
We propose to do this by (1) using factor analytic and regression techniques to partition the variance in each measure into shared and unshared components and then (2) examining the relations of these components with measures of depression severity early and late in a course of cognitive therapy for acute depression. Because the measures could be grouped broadly into two types—psychosocial measures (cognitive, social, and interpersonal) and personality measures—we subdivided the shared component of each measure into a broad general component common across the two types of measures, and a more delimited common component that each measure shares with other measures of the same type, either psychosocial or personality.
METHOD
PARTICIPANTS
Patients were recruited at the University of Texas Southwestern Medical Center, Psychosocial Research and Depression Clinic. All 156 study patients provided written informed consent to enter acute-phase cognitive therapy (A-CT; Beck, Rush, Shaw, & Emery, 1979). Eligibility criteria included: (a) DSM-IV nonpsychotic, unipolar, recurrent major depressive disorder (MDD) with clear interepisode recovery (two or more episodes of MDD, each separated by at least 2 months of a return to more-or-less normal functioning) and (b) 17-item Hamilton Rating Scale for Depression (HRSD-17; Hamilton, 1960) score ≥ 16 pre-treatment. The sample reported on in this article (N = 100) is virtually the same as that in Clark, Vittengl, and Jarrett (2003) except that, in all current analyses, eight patients who did not have complete data on all measures were dropped. See Clark et al. (2003) and also Jarrett et al. (2001) for additional details about patient recruitment, inclusion and exclusion criteria, as well as sample characteristics.
PROCEDURE
Cognitive Therapy. Acute-phase cognitive therapy (A-CT) was conducted by five experienced therapists within a 12-14 week protocol, including 20 individual sessions (50-60 minutes) held twice weekly for the first 8 weeks and once weekly for the last 4 weeks. No pharmacotherapy was provided. Additional detail about the therapy procedure is provided in Jarrett et al. (2001).
Assessment. In addition to the interview-based measure (an amplified SCID; Spitzer, Williams, Gibbon, & First, 1989) used to establish study eligibility, patients were evaluated with a broad range of depressive symptom and psychosocial measures at multiple time points, including: the same session as the eligibility determination (Pre1), a follow-up assessment before beginning A-CT (Pre2), various points during the 20 therapy sessions (T1-T20), and the conclusion of A-CT (Post). This multi-trait, multi-method, multi-occasion design permitted application of data reduction techniques to yield more reliable assessment. Two of the six psychosocial measures were assessed at only the first therapy session and at the conclusion of A-CT; four other measures were assessed also at Pre1 and T17. Personality was assessed at two time points, T2 and Post, using an omnibus instrument. Also collected, but not reported on here, were measures of therapeutic alliance and expressed emotion.
MEASURES
Schedule for Nonadaptive and Adaptive Personality (SNAP). Personality was assessed with the SNAP (Clark, 1993), a 375-item, factor analytically derived self-report inventory that uses a true-false format to assess 15 dimensions of personality functioning relevant to personality disorder (e.g., mistrust, impulsivity). The SNAP scales have demonstrated good internal consistency (median as = .80 -.85 in student, adult, and patient samples), test-retest reliability (e.g., in normal adults, 1 week to 4 months M r = .87), and discriminant validity (M interscale r = approximately |.20|) (Clark, Simms, Wu, & Casillas, in press). The three higher order temperament dimensions (positive temperament, negative temperament, and disinhibition) reflect the factor structure of the instrument, and the scales' validity has been supported in several studies (e.g., Harlan & Clark, 1999; Ready & Clark, 2002; Ready, Watson, & Clark, 2002; Reynolds & Clark, 2001; Vittengl, Clark, Owen-Salters, & Gatchel, 1999). Psychometric properties of the instrument in the current sample are reported in Clark et al. (2003).
As in Clark et al. (2003), we again focus on the six SNAP scales that were related to depression in this sample: Negative Temperament, Mistrust, Self-harm, Dependency, Positive Temperament, and Detachment. The first four of these scales all load on a broad Negative Affectivity/Neuroticism factor, whereas the latter two load on a Positive Affectivity/Extraversion factor. Scales that form the third, Disinhibition, factor of the SNAP were unrelated to depression. All 15 SNAP scales were used in the factor analyses described subsequently, but only the 6 SNAP scales that were related to depression were examined further.
ASSESSMENT OF DEPRESSION SEVERITY
Depression severity was measured with four rating scales—two self-reported (Beck Depression Inventory; Beck, Ward, Mendelson, Mock, & Erbaugh, 1961; and Inventory for Depressive Symptomatology-Self-report; Rush, Gullion, Basco, Jarrett, & Trivedi, 1996) and two clinician reported (HRSD and Inventory for Depressive Symptomatology-Clinician-report; Rush et al., 1996). We aggregated the multiple assessments with these four measures into two sets of scores (see Clark et al., 2003 for details regarding both the individual depression severity measures and the method of aggregation), which we termed simply “early” and “late” assessments. Using the full sample, internal consistency (Cronbach's α) in the current study at the early and late assessments was high (.87 and .98 respectively).
For the psychosocial measures, we used the assessment time points identified for the depression-severity measures to create composite early (first evaluation and first therapy sessions) and late (17th therapy session and post-A-CT) assessments whenever possible.
Attributional Style. The Attributional Style Questionnaire (ASQ; Peterson et al., 1982) presents 12 hypothetical situations (6 negative, 6 positive). Subjects generate a cause for each and rate the extent to which the cause reflects internal, global, and stable factors. The internal, global, and stable ratings for each negative situation (18 total items) and positive situation (18 total items) may be averaged to form a composite index of failure (ASQ-F) and success (ASQ-S) attributions relevant to depression (e.g., Peterson & Seligman, 1984). The ASQ-F's and -S's α internal consistencies have been adequate in past research (.72 and .75, respectively), as have their 5-week retest reliabilities (.64 and .70, respectively; Peterson et al., 1982). Validity of the ASQ-F and -S has been supported by moderate correlations with self-report measures of depressive symptoms and self-concept (Tennen, Herzberger, & Nelson, 1987). Using the full sample, a internal consistency in the current study for the early and late assessments was good for both the ASQ-F (.85 and .87, respectively) and ASQ-S (.81 at both times).
Social Adjustment Scale-Self Report (SAS-SR). The SAS-SR (Weissman & Bothwell, 1976) is a 56-item self-report measure of functioning in several important social domains. Participants complete only those sections of the questionnaire reflecting their social roles (e.g., not all participants complete marital or parenting sections), and higher scores reflect poorer adjustment. In past research, internal consistency for the overall adjustment score was moderate (α = .74) and temporal stability was good (r = .80) across 2-week intervals (Edwards, Yarvis, Mueller, Zingale, & Wagman, 1978). Validity evidence includes appropriate patterns of mean differences, significant correlations with clinical ratings, and sensitivity to change in psychopathology (Weissman & Bothwell, 1976; Weissmann, Prusoff, Thompson, Harding, & Myers, 1978). In the current study, a internal consistency of the total score computed on the full sample was good: .80 and .87 at the early and late assessments, respectively.
Dysfunctional Attitudes Scale (DAS). The DAS (Form A; Weissman, 1979) is a 40-item self-report measure of attitudes hypothesized to cause depression. Internal consistency has been good in past research (average α of .89), and validity has been supported through moderate correlations with the BDI (average of .33) and other measures of depressive cognition (average of .40; Dobson & Breiter, 1983), as well as higher scores in clinically depressed persons versus normal controls (Eaves & Rush, 1984). In the current study, a internal consistency computed on the full sample was high: .94 and .96 at the early and late assessments, respectively.
Self-Efficacy. The Self-Efficacy Scale (SEF; Sherer et al., 1982) measures expectations for persistence and success in a variety of domains with 23 items (plus 7 filler items) rated on a 5-point scale of agreement. Although items have been divided into general and social subscales in past research, we elected to use a total self-efficacy score because the general and social subscales have shown similar validity coefficients (Sherer et al., 1982; Woodruff & Cashman, 1993) and factor analysis did not support this division of items in the current sample (e.g., a large first factor on which all items loaded significantly emerged both early and late). Internal consistency estimates have typically been above .70 for the subscales, and validity of the SEF has been supported by moderate correlations with other self-report measures of self-esteem, internal locus of control, interpersonal competency, and task-specific efficacy (Sherer et al. 1982; Woodruff & Cashman, 1993). In the current study, a internal consistency for the total self-efficacy score was high: .89 and .92 at the early (first therapy session only) and late (post-A-CT only) assessments, respectively.
Inventory of Interpersonal Problems (IIP). The IIP (Horowitz, Rosenberg, Baer, Ureño, & Villaseñor, 1988) is a 127-item self report scale of the extent to which a number of behaviors, thoughts, and feelings have been problematic in one's significant relationships. Horowitz et al. (1988) provided evidence of the measure's reliability and validity, including a 10-week retest correlation of .98, moderate correlations with measures of psychiatric symptoms, and mean score decreases with psychotherapy. In the current study, a internal consistency for the total score computed on the full sample was very high: .97 and .98 at the early (first therapy session only) and late (post-A-CT only) assessments, respectively.
ANALYSES
In our previous article using this sample (Clark et al., 2003), we separated trait from state variance in depression-related personality measures using a combination of factor-analytic and regression techniques, and showed that only trait variance predicted later depression symptom severity. In this article, we again use a combination of factor-analytic and regression techniques to partition the variance of a broader set of psychosocial and personality variables in order to examine which portion of the variance of these constructs relates to depression. Specifically, we considered the personality measures and the psychosocial measures to be two different types of measures. We then sought to partition the variance of each measure into three components: a component that was shared between it and the other type of measure, which we callgeneral variance; a component that was not shared with the other type of measure but that was shared with the other measures of the same type, which we call within-type variance; and a unique component that was not shared with either the other type of measure or the other measures of the same type, which we call the scale-specific variance. Note that the scale-specific component includes both systematic and error variance of each scale.
Partitioning the Personality Scales. We first conducted a principal-axis factor analysis using the 12 psychosocial variables (6 variables assessed at 2 time points), which yielded a 2-factor solution (see Appendix A for the factor-loading matrix) similar to that obtained in factor analyzing the depression measures; that is, a large “late” factor accounting for 60% of the common variance, on which all the late assessments loaded higher than .35, and a smaller but distinct “early” factor accounting for 20% of the common variance, on which all the early assessments loaded greater than .50 except for ASQ-S, which had a loading of −.22.1 Thus, together, these two factors represent the bulk of the common variance among the six psychosocial variables assessed.
APPENDIX A.
Two-Factor Loading Matrix from a Principal-Axis Factor Analysis with Varimax Rotation of the Early and Late Assessments of Six Psychosocial Measures
| Variable | Late | Early |
|---|---|---|
| Late IIP | .85 | .28 |
| Late SAS-SR | .74 | .25 |
| Late DAS | .69 | .37 |
| Late ASQ-F | .52 | .32 |
| Late ASQ-S | −.38 | .17 |
| Late SEF | −.80 | −.19 |
| Early ASQ-F | .02 | .77 |
| Early DAS | .16 | .74 |
| Early IIP | .23 | .71 |
| Early SAS-SR | .08 | .63 |
| Early ASQ-S | −.08 | −.22 |
| Early SEF | −.30 | −.55 |
Note. N = 100. ASQ-F = Attributional Style Questionnaire-Failure; ASQ-S = Attributional Style Questionnaire -Success; SAS-SR= Social Adjustment Scale-Self-Report; DAS = Dysfunctional Attitudes Scale; SEF = Self-efficacy; IIP = Inventory of Interpersonal Problems. Loadings > .35 are in bold.
We then computed factor scores for these two factors, entered them as predictors in regression analyses for each of the six SNAP scales at both the early and late assessments, and derived a predicted score and a residual. Each regression analysis thus partitioned each SNAP scale into two components: general variance—the part of each personality scale's variance that overlapped with the early and late psychosocial factors (the predicted score)—and that which did not overlap (the residual). We then ran a second series of regression analyses for each SNAP scale, now using the personality scales' residuals, that is, the variance not shared with the psychosocial factors as the dependent variable, entering the nonoverlapping (i.e., the personality scales' residuals, which did not overlap with the psychosocial factors) components of the other five SNAP scales as predictors, again deriving for each SNAP scale a predicted score and a residual. This further partitioned the variance of each SNAP scale that did not overlap with the psychosocial factors into a within-type portion—the variance for each personality scale that did not overlap with the psychosocial factors but that did overlap with the other personality scales (the predicted score)—and a scale-specific portion (the residual, which includes error variance). These analyses thus resulted in each SNAP scale being partitioned into three components: (1) a general component, which it shared with the psychosocial measures, (2) a within-type component, which it shared with the other personality measures but not with the psychosocial measures, and (3) a scale-unique, specific component.
Partitioning the Psychosocial Scales. We then ran parallel analyses starting with a principal-axis factor analysis of the early and late assessments of the 15 SNAP scales. This analysis yielded a clear, three-factor solution, as is usual with the SNAP (see Appendix B for the factor-loading matrix). The first factor, accounting for 28% of the common variance, was identifiable as a Disinhibition factor, with both early and late Disinhibition, Impulsivity, and Manipulativeness having the strongest loadings (above .60). Early and late Workaholism marked the opposite end of the factor with loadings greater than −.50. In addition, late Dependency and Self-harm, and both early and late Exhibitionism had loadings greater than .40 on this factor, although the latter three all were secondary loadings.
APPENDIX B.
Three-Factor Loading Matrix from a Principal-Axis Factor Analysis with Varimax Rotation of the Early and Late Assessments of Fifteen Personality Measures
| Variable | Disinhibition | Negative Temperament | Positive Temperament |
|---|---|---|---|
| Early Disinhibition | .78 | .15 | −.01 |
| Late Disinhibition | .78 | .20 | .17 |
| Late Impulsivity | .76 | .02 | .15 |
| Early Impulsivity | .67 | .11 | .24 |
| Early Manipulativeness | .69 | .16 | .01 |
| Late Manipulativeness | .66 | .16 | .00 |
| Late Dependency | .45 | .38 | −.09 |
| Early Self-harm | .35 | .30 | −.19 |
| Early Workaholism | −.57 | .30 | .37 |
| Late Negative Temperament | .15 | .83 | −.05 |
| Early Negative Temperament | .06 | .61 | −.05 |
| Late Mistrust | .16 | .69 | −.16 |
| Early Mistrust | .18 | .54 | −.21 |
| Late Aggression | .16 | .69 | −.08 |
| Early Aggression | .19 | .61 | −.08 |
| Late Self-harm | .41 | .56 | −.00 |
| Late Workaholism | −.50 | .54 | .40 |
| Late Propriety | −.20 | .53 | .03 |
| Early Propriety | −.24 | .35 | −.13 |
| Early Eccentric Perceptions | .12 | .29 | .13 |
| Early Dependency | .28 | .28 | −.05 |
| Early Positive Temperament | −.35 | .04 | .66 |
| Late Positive Temperament | −.34 | −.25 | .59 |
| Early Exhibitionism | .48 | −.01 | .63 |
| Late Exhibitionism | .48 | −.12 | .54 |
| Early Entitlement | .12 | −.04 | .52 |
| Late Entitlement | −.02 | −.03 | .51 |
| Late Eccentric Perceptions | .08 | .29 | .30 |
| Early Detachment | −.14 | .25 | −.42 |
| Late Detachment | −.12 | .45 | −.50 |
Note. N = 100. Loadings ≥ .35 are in bold.
The second factor, accounting for 19% of the common variance was a Negative Affectivity/Neuroticism factor with both early and late Negative Temperament, Mistrust, and Aggression having the strongest loadings (above .50); late Self-harm, Propriety, and Workaholism also loaded greater than .50 on this factor. The third factor, accounting for 13% of the common variance, was a Positive Affectivity/Extraversion factor; both early and late Positive Temperament, Exhibitionism, and Entitlement loaded above .50 on this factor, and Detachment loaded greater than −.40 on the opposite end. Together, these three factors accounted for almost 60% of the common variance.2
As before, we computed factor scores for these three factors and entered them as predictors in regression analyses for each of the six psychosocial measures at both the early and late assessments and derived a predicted score and residual for each. Each regression analysis thus partitioned the respective psychosocial variable into two components: the general variance that overlapped with the personality scales (the predicted score) and that which did not overlap (the residual). We then ran a second series of regression analyses for each psychosocial variable, now using the nonoverlapping (residual) portion of each scale as the dependent variable and entering the non-overlapping components of the other five psychosocial scales as predictors, again deriving a predicted score and a residual for each. This further partitioned the portion of each psychosocial variable that did not overlap with the personality measures into a within-type psychosocial portion—the variance for each psychosocial measure that did not overlap with the personality measures but that did overlap with the other psychosocial variables (the predicted score)—and a scale-specific portion (the residual, which includes error variance). Thus, these analyses also resulted in each psychosocial variable being partitioned into three components: (1) a general component, which it shared with the personality measures, (2) a within-type component, which it shared with the other psychosocial measures but not with the personality measures, and (3) a scale-unique, specific component.
Notes on the Factor Analyses. Is it noteworthy that the SNAP is shown to be much more trait-like in these factor analyses than either the depression or the psychosocial measures. That is, the depression and psychosocial measures had lower test-retest stability and thus aggregated by time, yielding early and late factors, whereas the SNAP scales were more stable across time, and thus aggregated by content, yielding the familiar “Big Three” factors first identified by Eysenck (1978). Moreover, the common variance for the personality variables was larger than for the psychosocial measures (74% vs. 61% of the total variance, respectively). Conversely, the extracted factors (early and late for the psychosocial measures, the Big Three for the personality measures) accounted for more of the common variance in the psychosocial than the personality measures (79% vs. 59%, respectively), indicating that the psychosocial measures were more overlapping with each other at each time point than were the personality scales. It is important to note that the end result was comparable across the two types of measures: The psychosocial factors accounted for 49% of the total variance of the psychosocial scales and the personality factors accounted for 44% of the total variance of the personality measures. Thus, the subsequent analyses are not biased by the factors accounting for diverse amounts of the measures' variance.
We then correlated the three components (general, within-type, and scale-specific) for each personality and psychosocial scale with depression severity both early and late. We first report on the concurrent correlations (e.g., early [late] personality/psychosocial components with early [late] depression severity, respectively), and then examine the power of the early general, within-type (personality and psychosocial), and scale-specific components of all variables to predict late depression severity. Our hypothesis was that the general components, those shared across the personality and psychosocial measures, would outpredict the scale-specific components, but we made no prediction regarding the predictive power of the within-type components, that is, the variance shared only among the personality variables or only among the psychosocial variables (i.e., after the variance common to both had been partialled out).
DESCRIPTIVE STATISTICS
Descriptive statistics (means and standard deviations) for early and late depression symptom severity, the six psychosocial variables, and the 15 personality traits are listed in Appendix C. These are not the focus of the current article but are provided for archival purposes as required by American Psychological Association standards (American Psychological Association, 2001). As can be seen (and as has been reported previously in other articles using this same sample (Clark et al., 2003; Vittengl et al., 2003), there was significant change in all scores in the direction of increased psychological health and psychosocial functioning from pre- to post-A-CT.
APPENDIX C.
Descriptive Statistics for the Early and Late Assessments of Six Psychosocial Measures
| Early |
Late |
|||
|---|---|---|---|---|
| Variable | M | SD | M | SD |
| Depression Severity and Psychosocial Measures | ||||
| Depression Severity | 97.44 | 8.00 | 61.24 | 12.64 |
| SAS-SR | 2.53 | 0.37 | 1.85 | 0.36 |
| ASQ-F | 4.90 | 0.81 | 4.00 | 0.84 |
| ASQ-S | 4.55 | 0.70 | 4.80 | 0.72 |
| DAS | 155.40 | 33.89 | 111.73 | 34.66 |
| IIP | 1.61 | 0.50 | 1.00 | 0.54 |
| SEF | 66.75 | 14.50 | 81.07 | 15.67 |
| Personality Measures | ||||
| Negative Temperament | 20.45 | 5.1 | 13.85 | 7.7 |
| Mistrust | 8.68 | 4.8 | 5.34 | 4.6 |
| Manipulativeness | 4.21 | 3.0 | 3.46 | 2.9 |
| Aggression | 5.17 | 4.1 | 3.97 | 3.5 |
| Self-harm | 7.29 | 3.1 | 4.25 | 3.3 |
| Eccentric Perceptions | 2.98 | 2.4 | 2.00 | 2.0 |
| Dependency | 6.92 | 4.2 | 4.75 | 4.0 |
| Positive Temperament | 10.79 | 5.6 | 15.92 | 6.2 |
| Exhibitionism | 5.18 | 3.4 | 5.92 | 3.6 |
| Entitlement | 5.86 | 3.2 | 7.46 | 3.3 |
| Detachment | 9.19 | 4.4 | 6.65 | 4.1 |
| Disinhibition | 8.80 | 5.2 | 7.70 | 4.9 |
| Impulsivity | 6.42 | 3.9 | 5.64 | 3.8 |
| Propriety | 13.28 | 3.7 | 11.82 | 4.4 |
| Workaholism | 8.85 | 4.7 | 7.61 | 4.3 |
Note. N = 100. ASQ-F = Attributional Style Questionnaire-Failure; ASQ-S = Attributional Style Questionnaire-Success; SAS-SR= Social Adjustment Scale-Self-Report; DAS = Dysfunctional Attitudes Scale; SEF = Self-efficacy; IIP = Inventory of Interpersonal Problems. All early-late comparisons are significant, p < .01.
RESULTS
COMPONENT SIZE
Before examining relations with depression, it is illuminating to consider the relative size of the three components of each variable. That is, of the total variance of each scale score, how much is attributable to the general component, the component it shares with other same-type variables (i.e., other psychosocial or other personality scales; the within-type component), and the scale-specific component? It seemed reasonable that variables would differ in the percentage of variance accounted for by these three components, with some variables having a larger general component, others having a larger within-type component, and others a larger scale-specific component. We also thought that these percentages might vary with time of assessment and amount and effect of treatment. Specifically, because the variables are more highly intercorrelated at the late assessment (see Clark et al., 2003), we hypothesized that there would be larger shared components at the late assessment, although we did not predict whether this would be due to a larger general shared component or a larger shared within-type component.
The results are shown in Table 1 for both the psychosocial and personality variables, and an illustration is shown for two variables—Positive Temperament and the IIP—in Figure 1. There are a number of interesting aspects to these data. First, the measures vary widely in the allocation of their variance across the three components. For example, the ASQ-S has the largest specific component at both the early (87.8%) and late (76.8%) assessments, whereas Mistrust and Self-efficacy consistently have larger general components.
TABLE 1.
Percent of Raw Score Variance Attributed to Three Components of Psychosocial and Personality Variables
| Early |
Late |
|||||
|---|---|---|---|---|---|---|
| Variable | General | Within-type | Specific | General | Within-type | Specific |
| Psychosocial Variables | ||||||
| ASQ-F | 15.0 | 29.2 | 55.8 | 27.4 | 23.4 | 49.3 |
| ASQ-S | 7.6 | 4.6 | 87.8 | 4.8 | 18.4 | 76.8 |
| SAS-SR | 13.7 | 21.5 | 64.8 | 37.2 | 20.6 | 42.1 |
| DAS | 20.9 | 28.5 | 50.6 | 37.4 | 20.3 | 42.3 |
| SEF | 36.3 | 18.1 | 45.6 | 56.6 | 13.6 | 29.7 |
| IIP | 29.3 | 23.6 | 47.1 | 57.8 | 18.4 | 23.7 |
| Mean | 20.5 | 21.0 | 58.6 | 36.9 | 19.1 | 44.0 |
| Personality Variables | ||||||
| Negative Temperament | 15.2 | 11.2 | 73.7 | 52.0 | 9.6 | 38.5 |
| Mistrust | 36.8 | 4.2 | 59.0 | 42.8 | 8.0 | 49.2 |
| Self-harm | 17.1 | 11.1 | 71.8 | 42.7 | 5.5 | 51.8 |
| Dependency | 20.8 | 12.7 | 66.5 | 43.7 | 15.4 | 40.9 |
| Positive Temperament | 9.5 | 14.1 | 76.4 | 40.4 | 2.1 | 57.5 |
| Detachment | 10.7 | 13.1 | 76.2 | 19.3 | 25.0 | 55.7 |
| Mean | 18.4 | 11.1 | 70.6 | 40.2 | 10.9 | 48.9 |
Notes. N = 100. ASQ-F = Attributional StyleQuestionnaire-Failure; ASQ-S = Attributional Style Questionnaire-Success; SAS-SR = Social Adjustment Scale-Self-Report;DAS = Dysfunctional Attitudes Scale; SEF = Self-efficacy; IIP = Inventory of Interpersonal Problems.
FIGURE 1.
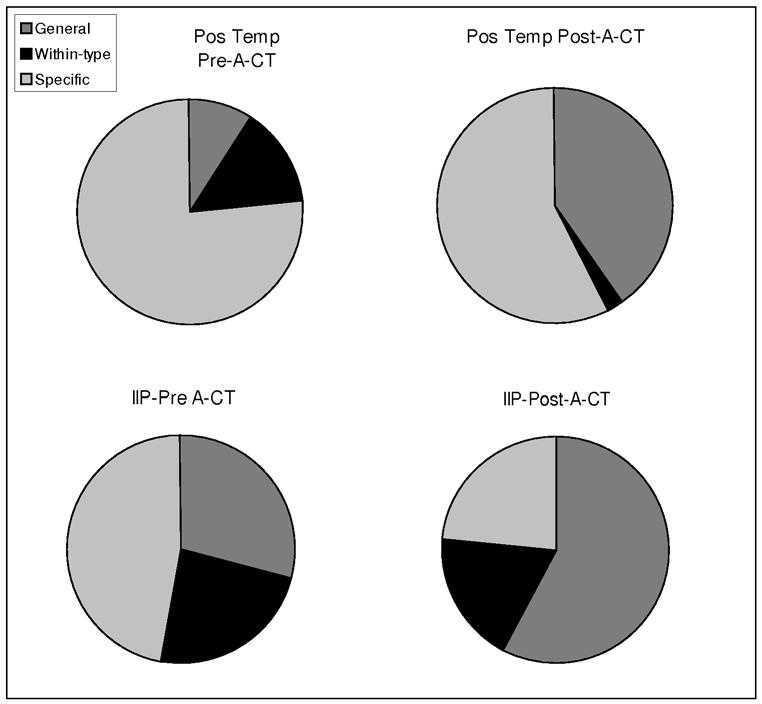
Percent of raw score variance of Positive Temperament and the Inventory for Interpersonal Problems attributed to the general, within-type, and measure-specific components pre- and post-acute cognitive therapy.
It is important to remember that the size of these components is not inherent in the scales, but rather is dependent upon the particular set of measures used in these analyses. That is, ASQ-S has little in common with the other measures used and so has the largest scale-specific component, but if a variable set that correlated highly with the ASQ-S had been used instead, the ASQ-S's general and within-type components necessarily would have been larger. This does not mean, however, that these data are, therefore, meaningless. Rather, because these variables are ones that are widely used in depression research and have been shown to correlate with depression symptom severity, there is inherent interest in the degree to which they overlap and the degree to which it is their general, versus specific, variance that correlates with depression symptom severity.
Second, it can be seen readily that the general component is, on average, about twice the percentage in the late, versus the early, assessment for both the psychosocial and personality variables (18-20% in the early assessment and 36-40% in the late assessment). On the other hand, the within-type variance is a relatively constant percentage, on average, from early to late assessment, although with this particular set of variables, the within-type component was approximately twice as large in the psychosocial variables (20%) as in the personality variables (11%).
We can draw two conclusions from these findings. First, the higher correlations among these variables at the late assessment are due to one or more factors they all have in common, not just factors that are common within one of the two sets (types) of variables. We will examine the nature of these factors later. Second, as noted earlier, the psychosocial variables have more in common among each other than do the personality variables. This is not surprising given that this particular set of personality measures was developed to be maximally distinctive within a broad, three-factor structure. Nevertheless, it is important to remember that, in general, the personality scales provide more distinct information than do the psychosocial measures. That is, the scale-specific components are larger for the personality than the psychosocial measures (in the abstract, this could, of course, reflect a larger error component, but this possibility may be ruled out by the good internal consistencies of all the measures and the strong retest correlations of the personality scales).
PREDICTION OF DEPRESSION
Concurrent Validity. Table 2 presents the concurrent correlations between depression symptom severity and the two sets of variables at both the early and late assessments. Several things are noteworthy about these data. First, the correlations at the late assessment generally are stronger than those at the early assessment. Second, it is readily apparent that the common variance among the personality and psychosocial variables is what overlaps with depression. For the personality variables, it is only the most general variance—the variance that they share with the psychosocial variables—that correlates with depression severity, whereas for the psychosocial variables, it is not only the general variance, but also the within-type variance which they share with each other, distinct from the more broadly shared variance, that correlates with depression severity. This difference between the personality and psychosocial variables is greater at the late assessment than the early assessment, with the within-type correlations for personality decreasing and those for the psychosocial variables increasing: For the early assessment, the median correlation (using absolute values) of the within-type variance was .19 for the personality measures and .36 for the psychosocial measures, whereas for the late assessment, the median rs were .04 and .42, respectively. The relevance of the within-type variance of the psychosocial measures to depression makes sense in light of the fact that these measures were developed, for the most part, within a framework of investigating the etiology of depression, so it is not surprising that they share common elements that overlap with depression. By contrast, the personality measures were developed independently of depression research, so again it makes sense that it should be the portion of their variance that they share with the psychosocial measures that correlates with depression.
TABLE 2.
Concurrent Correlations of Raw Scores and Three Components of Psychosocial and Personality Measures with Depression Severity at the Early and Late Assessments
| Early |
Late |
|||||||
|---|---|---|---|---|---|---|---|---|
| Variable | Raw Score | Late General | Within-type | Measure-specific | Raw Score | General | Within-type | Measure-specific |
| Psychosocial Variables | ||||||||
| ASQ-F | .44 | .35 | .45 | .08 | .46 | .46 | .39 | .05 |
| ASQ-S | −.23 | −.27 | −.38 | −.08 | −.23 | −.20 | −.31 | −.06 |
| SAS-SR | .69 | .35 | .36 | .49 | .74 | .47 | .48 | .36 |
| DAS | .28 | .35 | .37 | −.10 | .62 | .48 | .54 | .14 |
| SEF | −.30 | −.21 | −.31 | −.06 | −.43 | −.40 | −.40 | .03 |
| IIP | .33 | .32 | .33 | −.01 | .57 | .47 | .45 | .04 |
| Mediana | .32 | .34 | .37 | .08 | .52 | .47 | .43 | .06 |
| Personality Variables | ||||||||
| Neg. Temperament | .25 | .49 | −.20 | .06 | .57 | .66 | .06 | .11 |
| Mistrust | .33 | .52 | .18 | −.04 | .39 | .61 | .19 | −.09 |
| Self-harm | .31 | .52 | .13 | .06 | .54 | .68 | .02 | .12 |
| Dependency | −.12 | .43 | −.11 | −.33 | .38 | .67 | −.02 | −.09 |
| Pos. Temperament | −.33 | −.45 | −.23 | −.12 | −.43 | −.68 | −.01 | .01 |
| Detachment | .31 | .52 | .35 | .02 | .38 | .67 | .10 | .05 |
| Mediana | .31 | .51 | .19 | .06 | .41 | .67 | .04 | .09 |
Notes. N = 100. ASQ-F = Attributional StyleQuestionnaire-Failure; ASQ-S = Attributional Style Questionnaire-Success; SAS-SR = Social Adjustment Scale-Self-Report;DAS = Dysfunctional Attitudes Scale; SEF = Self-efficacy; IIP = Inventory of Interpersonal Problems; Neg. Temperament = Negative Temperament; Pos. Temperament. = Positive Temperament.
Based on absolute values. |r|s ≥ .35 in bold; |r|s > .19, .22, .32, p < .05, .01, .001, 2-tailed, respectively.
Finally, with a few exceptions (SAS-SR and early Dependency), the scales' scale-specific variance is unrelated to depression. This suggests that the specific measure used may be of relative unimportance when investigating relations with depression. More importantly, it suggests that different findings using different measures in different samples may represent sample-specific characteristics rather than important differences between measures. Thus, it will be important to replicate measure-specific findings on different samples before drawing firm conclusions about the specific measures used that yielded the findings.
In interpreting these correlations, it is important to keep the distribution of variance across the different components in mind. For example, the concurrent correlation between depression severity and Self-harm (raw score) was .31 for the early assessment and .54 for the late assessment. For Self-harm, only the general variance correlated with depression severity at either assessment (.52 and .68, respectively, whereas the other correlations were all less than .13). In addition, the proportion of raw score variance attributable to general variance increased from 17.1% at the early assessment to 42.7% at the late assessment. Thus, the increase in the correlation of Self-harm raw score with depression severity from the early to the late assessment was due not only to the fact that the general variance portion of the Self-harm raw score at the late assessment was more strongly correlated with depression, but also because the general variance comprised a greater percentage of the Self-harm raw score variance at that assessment.
Finally, it also is important to note that, whereas most of the correlations in Table 2 are in the expected direction, a few are not. Most notably, the measure-specific portion of the Dependency raw score is negatively correlated with depression severity at the early assessment. This means that a lower measure-specific component of Dependency is associated with higher depression severity. Thus, there is something unique measured by the SNAP Dependency scale for which being less dependent is associated with being more depressed, at least in this sample. We discuss subsequently what this may be.
Predictive Validity. We noted in our previous article (Clark et al., 2003) that early raw personality scores provided little clue to late depression severity scores. The same observation can be made of the raw scores of the psychosocial variables (see Table 3). Predictive correlations ranged from .00 to .17 for the personality measure raw scores and from -.01 to .18 for the psychosocial measure raw scores. However, when we examine the correlations of the early components of these variables with late depression severity scores, a different picture emerges. Whereas some of the early-assessed variables (e.g., Detachment, ASQ-S) remain uncorrelated, or largely so, with late depression severity scores, the components of a number of the others now have correlations of up to .50 (Dependency). Most striking, however, is that the only early component of any variable that predicts late depression severity is the most general component—the variance that is shared across the personality and psychosocial variables. Neither the within-type components nor the scale-specific components show any significant predictive power, with the largest correlation being less than .20 (.17 for the within-type component of SEF). This is in contrast to the concurrent correlations (shown in Table 2) for which a number of within-type components and even a few measure-specific components were correlated with depression severity.
TABLE 3.
Raw Scores and Three Components of Psychosocial and Personality Measures at the Early Assessment: Predictive Correlations of Late-Assessment Depression Severity
| Score Component |
||||
|---|---|---|---|---|
| Early Variable | Raw Score | General | Within-type | Measure-specific |
| Psychosocial Variables | ||||
| ASQ-F | .10 | .45 | −.11 | −.02 |
| ASQ-S | −.01 | −.24 | .13 | .02 |
| SAS-SR | .18 | .43 | −.13 | .10 |
| DAS | .06 | .46 | −.16 | −.09 |
| SEF | −.08 | −.31 | .17 | .05 |
| IIP | .12 | .47 | −.16 | −.09 |
| Median | .09 | .44 | .15 | .07 |
| Personality Variables | ||||
| Negative Temperament | .17 | .36 | −.05 | .06 |
| Mistrust | .16 | .22 | .02 | .03 |
| Self-harm | .06 | .24 | .00 | −.05 |
| Dependency | .17 | .50 | .01 | −.07 |
| Positive Temperament | −.14 | .50 | .01 | −.01 |
| Detachment | .00 | −.03 | .08 | −.02 |
| Median | .15 | .30 | .02 | .04 |
Note. N = 100. ASQ-F = Attributional Style Questionnaire-Failure; ASQ-S = Attributional Style Questionnaire-Success; SAS-SR= Social Adjustment Scale-Self-Report; DAS = Dysfunctional Attitudes Scale; SEF = Self-efficacy; IIP = Inventory of Interpersonal Problems. |r|s > .35 in bold; |r|s > .19, .22, .32, p < .05, .01, .001, 2-tailed, respectively.
Follow-up Analyses. An interesting finding was that, whereas the general variance of both types of measures was related concurrently to depression severity, for the within-type variance, only the psychosocial variables were so related. This suggested to us that the link between personality and depression might be mediated by the psychosocial variables (cf. Ingram, 2003). In essence, personality traits, being more stable and, to a large extent genetically based (e.g., McGue, Bacon & Lykken, 1993), may influence one's basic affective temperament, whereas the ability to regulate one's temperament is learned. Thus, the proximal variable to depression severity may be mood regulation, but one's temperament may determine how difficult it is to regulate one's mood. For example, it is likely to be more difficult for those high in trait negative affectivity (or mistrust, detachment, etc.) and low in trait positive temperament to maintain “healthy” cognitions (including attributions, attitudes, and self-views of interpersonal and social functioning, and self-worth). They have to “work harder” to achieve the same result than those low (high) in negative (positive) affective traits.
We tested this hypothesis by creating a series of regression models to predict late depression. The high intercorrelations of the scales'general components and, likewise, the high intercorrelations of the within-type components created colinearity problems if we included the components of more than one psychosocial variable in any model. Therefore, we ran three sets of pair-wise analyses for each personality variable and each psychosocial measure, respectively: one each examining the two concurrent relations—early- (or late-) personality and psychosocial variables predicting, respectively, early- (or late-) depression, and one examining the prediction of late depression severity from early personality and psychosocial variables. Within each of these analyses, we tested three models of how the psychosocial variables might mediate the relation of personality to depression: through (a) the general component, (b) the within-type component, or (c) both components. Because the measure-specific components were largely unrelated to depression, we did not include them in the models. Moreover, based on the results from (a) and (b), which we describe subsequently, we did not run (c) for the concurrent relations. Finally, because the general component of early detachment was not related to late depression, it was excluded from the last set of analyses (predicting late depression severity from early personality/psychosocial variables). This resulted in a total of 234 regression equations; therefore, we used a p-value of .01 in order not to identify spurious effects.
We used the procedure described by Baron and Kenny (1986) to test for mediation. This procedure requires that (a) both variables—the hypothesized distal causal variable (in this case, the general component of each personality measure) and the hypothesized mediator (in this case the general and within-type components of the psychosocial variables)—be related to the dependent variable (in this case, depression severity) and (b) the hypothesized distal causal variable and mediator be related to each other. As shown in Tables 2 and 3, requirement (a) was met for all variables, although there were only mild correlations between the within-type components of the psychosocial variables and depression severity. Requirement (b) was met for all variables as well, with correlations ranging from near unity for some of the general components to .28, all of which were significant (p < .01). The test for mediation then consists of examining the relation of the hypothesized distal causal variable to the dependent variable with and without the hypothesized mediator in the regression. Mediation is supported when the predictive power (indicated by the significance of the variable's beta weight in the equation) of the distal causal variable is weaker when the hypothesized mediator is in the regression compared to when it is not. The mediation may be partial or complete: Partial mediation is supported if the distal variable loses some predictive power but still has a significant beta weight with the mediator in the equation; complete mediation is supported if the predictive power of the distal variable is no longer significant with the mediator in the equation. Thus, in our analyses, the general component of each personality variable is the distal causal variable, the general and/or within-type components of each psychosocial variable are the hypothesized mediators, and, of course, depression severity is the dependent variable.
We first ran the regressions including either the general or the within-type component (but not both), and we found the results somewhat surprising: In no case did the general component, and in only 5 (of 72) cases did the within-type component of the psychosocial measures mediate concurrent relations between personality and depression severity. Moreover, the five cases involved five different personality variables, and each showed only partial mediation, so we concluded that psychosocial variables generally do not mediate concurrent relations between personality and depression severity. By contrast, when we examined the prediction of late depression by early assessment of personality and psychosocial variables, the general component of the psychosocial variables mediated in 40% (12 of 30) of the models; moreover, whereas the within-type component of the psychosocial measures added a unique contribution toward the prediction of late depression severity in 100% of the 30 models, it mediated in 0%.
Because the phenomenon of mediation by the general component in predicting late depression severity from early personality and psychosocial variables was reasonably broad, we then focused on the final set of models—when both the general and within-type components were included—to determine whether the general component still mediated personality-depression relations when the within-type component was added to the model as well. The results were striking: An increase in predictive power over the general component of each personality variable alone was observed in 100% of the models; when the general components of both the personality and psychosocial variables were entered first, the within-type component added significant predictive power in 86.7% (26 of 30) of the models. The four exceptions were Mistrust with SAS-SR, IIP, and ASQ-F, and Self-harm with ASQ-F; although the overall model was statistically significant in each case, none of the components was statistically significant in the final equations; thus, no mediation was found in these models. Of the 26 models in which an increase in predictive power was found, the within-type component completely carried the predictive power of the psychosocial variable in all but two models, and in no model was the contribution of the personality variable reduced when both components of each psychosocial variable were added. The two exceptions were Positive Temperament and Dependency together with IIP, in which case both the general and within-type components of IIP contributed to predict depression severity. Thus, what appeared might be mediation of personality effects by the general components of psychosocial variables was not supported by further analyses. The conclusion that must be drawn from these results is that psychosocial variables do not mediate the prediction of depression from personality traits as hypothesized, although the within-type components do contribute significantly to the prediction of late depression severity over and above the contribution of the general components of personality variables.
For comparison, we also used raw scores to run a parallel set of regressions for the concurrent relations (analyses for the predictive relations cannot be run because there are none with the raw scores). In these analyses, there were a few consistent findings: ASQ-F mediated the personality-depression relation for Mistrust and Dependency, and IIP also mediated the relation for Mistrust. Moreover, SAS-SR appeared to be a mediator in all cases, but this is most likely a spurious finding due to the very strong correlation between SAS-SR and depression severity. Neither DAS nor ASQ-S mediated the relation consistently for any personality variable. Thus, a slightly different conclusion might have been drawn had we used raw scores rather than component scores, but this example serves to underscore a point we made earlier: that diverse findings in the literature may represent sample-specific characteristics rather than important differences between measures. That is, a typical reaction to a few consistent results, like those we obtained with the raw scores, would have been to develop a post-hoc explanation and follow it up with further studies. However, when the analyses are run not on the individual variables, with their large proportion of measure-specific variance, but instead on the overlapping and specific components of these variables, it is clear that it is their overlapping component that is most predictive of depression. Therefore, the few findings based on specific measures, which differ from the findings using the overlapping variance, are unlikely to replicate.
DISCUSSION
In our earlier article (Clark et al., 2003) we showed that personality trait variance (which we interpreted as affectively based), but not state affect tapped by personality measures, predicted late depression. What have we learned from these additional analyses that we did not learn from the previous ones and how can we integrate the two sets of findings? First, it is important to note the strong similarity between the personality-based factors in the two analyses. In the earlier study we used a regression-based technique to derive the trait scores, but noted that the “trait scores are equivalent to the first factor score from a factor analysis” (Clark et al., 2003, p. 164). In this report, we used factor analysis to derive the scores and so, conversely, we may interpret the personality-based factor scores derived in this article as personality trait scores. Thus, when these scores were regressed on the psychosocial measures, the general variance identified represents the overlap between those measures and personality trait variance, and we may interpret this as the personality-trait-like variance contained in each psychosocial measure.
In this light, it is interesting to consider the size of the general components of the early and late psychosocial variables. On average, across the psychosocial variables, the general component at the late assessment was almost twice as large as at the early assessment. Thus, the late psychosocial measures contained a larger portion in common with personality traits. This is consistent with the view that psychosocial measures, such as the ASQ and DAS, if assessed during depression, look as much or more like another depressive symptom than like the more trait-like “vulnerability factor” they are hypothesized to represent (Gladstone & Parker, 2001).
As for the early assessment, which is of most interest for predicting later depression, the size of the psychosocial measures' general components ranges from 7.6% (ASQ-S) to 36.3% (SEF). Whereas the general components of these two extreme variables are the least predictive of late depression severity; those of the other four variables—ASQ-F, SAS-SR, DAS, and IIP—whose general components range from 13.7% (SAS-SR) to 29.3% (IIP) are all equally predictive (r = .43–.47) of late depression severity. Given these findings, it is not surprising that these four variables are among the most widely used in studies of depression. Perhaps the fact that the personality-trait-like variance they contain is relatively strongly related to depression is what makes them the “best” variables in this regard.
Conversely, the factor analysis for the psychosocial measures yielded two “time” factors, representing the variance common to the psychosocial measures at the early and late assessments, respectively, which would be the commonality among various types of cognitions (attributions, attitudes, self-views of social and interpersonal functioning, and self-worth) that are, at least in part, based in current affective state (because they aggregated by time). Therefore, when the psychosocial factors are regressed on the personality variables, how may we interpret the general variance that emerges? Since both the early and late psychosocial factors are entered into the regression, the resulting general components represent the portion of each personality measure's variance that overlaps with either or both of the two affective-state-based common elements in a range of types of cognitions. Thus, is it not surprising that two of the three stronger predictors of late depression severity among the personality measures' general variance were Negative and Positive Temperament, since these two variables are the most clearly affective of those examined. The strongest correlate was Dependency and, recalling that Clark et al. (2003) also found Dependency to have a unique relation with depression severity, we return to it later.
The Nature of the General, Within-type, and Measure-specific Components. Because the general component of each measure is that which each shares with measures of the other type and, as we have discussed, has a trait-like nature since they are based on aspects of measures that appear across time, these components necessarily represent broad constructs at or near the top of a hierarchical structure, most likely a trait structure and, therefore, most likely a personality trait structure. Although we have no way of assessing these general components other than with the measures used in this study, we can note which of the raw measures' scores are most highly correlated with them, which will give us some notion of their character. We examined the four highest raw score correlates of each of the general and within-factor components of each variable, and for the specific components of SAS-SR and Dependency (the only two measures whose specific components correlated with depression severity). The patterns that emerged were striking.
For the general variance contained in ASQ-F, SAS-SR, DAS, and IIP, late negative temperament, mistrust, and IIP invariably emerged as among the highest four correlates whether the psychosocial measures were assessed at the early or late time points. These correlations were strong, averaging .79 for Negative Temperament, .68 for Mistrust, and .72 for IIP. This suggests that what these psychosocial measures have in common with personality is negative-affect-related interpersonal difficulties, and that individual differences in this construct are stronger after than before acute-cognitive therapy. For the positively keyed psychosocial measures (ASQ-S and SEF), only late positive temperament emerged with any consistency. Thus, it is more difficult to characterize what these variables share with personality, other than it is a general positive affective factor.
By contrast, when the general variance in the personality variables was examined in relation to raw scores, IIP and DAS invariably emerged as among the top four correlates, with SAS-SR a strong “third-place” variable, correlating with five of the six personality measures' general component; however, the relations generally were time-specific. Thus, the general component in early (late) personality variables correlated, respectively, with the early (late) raw scores of the psychosocial measures, with the exception of Dependency, which correlated with late DAS and SAS-SR at both time points. Again, the correlations were strong: .76 for early IIP, .92 for late IIP; .78 for early and late DAS; and .67 and .77 for early and late SAS-SR, respectively. This overlapping variance may be characterized as general dysfunction— interpersonally, attitudinally, and socially. Thus, not surprisingly, the general variance appears to be a very broad negativity factor, with strong affective, interpersonal, and dysfunctional aspects.
Turning to the within-type variance for the psychosocial measures (which, you will recall, had some concurrent relations with depression), the strongest raw score correlates were the DAS (11 of 12 variables), the ASQ-F (10 of 12), and the SAS-SR (9 of 12), with again concurrent relations predominating (i.e., early within-type variance with early raw score). Thus, not surprisingly, it appears that after the personality-related variance is removed from the psychosocial variables, the more cognitive aspects of these variables emerge as the remaining common core.
Ironically, given the construct it assesses, Dependency appeared to be the most independent variable, as it was in our previous article. These analyses provide an explanation for the lack of concurrent correlation between early raw Dependency and depression. For most of the variables, the different components correlated in the same direction with concurrent depression. For example, general self-harm and detachment, within-type self-harm and detachment, and scale-specific self-harm and detachment all correlated positively with depression severity. Conversely, all three components of Positive Temperament correlated inversely with depression severity. However, whereas the general component of dependency correlated positively with depression severity, the within-type and scale-specific components both correlated inversely with depression severity at the early assessment, but had near zero correlations at the late assessment. In other words, the general “negativity” portion of dependency increased with increasing depression, whereas the scale-specific portion of dependency was inversely related to depression early in therapy and was unrelated to depression at the late assessment. This takes us a step farther than we were able to go in our earlier article, when we simply noted that there was no relation to depression early in therapy. One possible explanation is that increased dependency early in therapy is a sign of involvement in the therapeutic alliance, a willingness on the part of a patient to form a close relationship with the therapist, which in and of itself reduces depression. Later in therapy, the therapeutic alliance may change to a more collaborative relationship so dependency and depression severity become uncoupled. Further research is needed to test this hypothesis, but it gives us a glimpse of the possibilities that the type of component analysis carried out in this study offers for deepening our understanding of how personality, cognitive, social, and interpersonal variables interrelate in the context of depression.
Footnotes
The clinical trial was conducted at the University of Texas Southwestern Medical Center at Dallas, Department of Psychiatry, in the Psychosocial Research and Depression Clinic directed by Dr. Jarrett and was supported in part by grants MH-38238 and MH-01571 from the National Institute of Mental Health, Bethesda, MD. The research was also supported by the University of Minnesota Press (Dr. Clark). Gratitude is expressed to our colleagues for contributing to this research. Jeanette Doyle, MA; Greg Eaves, PhD; Paul Silver, PhD; Marjorie Woodruff, PhD; Bethany Hampton, PhD, Catherine Judd, PA-C, MS; Douglas Lisle, PhD; Regina Kinney, PhD; Maria Marwill-Magee, PhD; Andrew Clifford, PhD; Martin Schaffer, MD; and Rodger Kobes, MD provided clinical support. Michelle White, BS; Edna Christian, MA; Joseph Begue, BA; Julie Lowe, BA; Daisha Cipher, PhD; Patricia Green, MS; Demetria Clinton, BA; and Paula Reese provided research support. Barbara M. Foster, PhD; Janet Smith, BA; and Richard C. Risser, MS provided programming support. We appreciate the administrative support of both Eric J. Nestler, MD, PhD (The Lou and Ellen McGinley Distinguished Chair in Psychiatric Research and current chair) and Kenneth Z. Altshuler, MD (Stanton Sharp Professor and previous chair), Department of Psychiatry, The University of Texas Southwestern Medical Center at Dallas, as well as Jon Whitmore, PhD, Office of the Provost, and Michael O'Hara (Chair), Department of Psychology, University of Iowa.
The scree plot of eigenvalues also suggested the possibility of either a 1- or 3-factor solution, so both were examined. Neither the early nor late ASQ-S scales loaded on the first extracted factor, however, so it was not considered further. A third factor accounting for 15% of the common variance could be extracted before exhausting the common variance. Examination of this solution revealed that the first two factors remained a “late” and an “early” factor, and that only early and late ASQ-S had primary loadings on the third factor. Moreover, both early and late Self-efficacy split between this factor and the primary factor on which they loaded (the “early” and “late” factors, respectively), so the 3-factor solution was not as clean as the 2-factor solution. Therefore, we decided to use the 2-factor solution as the basis for further analyses. For completeness sake, we also ran all subsequent analyses based on the 3-factor solution. Whereas there were a few notable differences for specific scales, the overall conclusions remained unchanged.
The scree plot suggested the possibility of a 4-factor solution, so we examined this solution as well. Early and late Dependency and Propriety formed the fourth factor, but there is no clear interpretation of such a factor, so we selected the 3-factor solution for all further analyses.
REFERENCES
- Alloy LB, Abramson LY, Whitehouse WG, Hogan ME, Tashman NA, Steinberg DL, Rose DT, Donovan P. Depressogenic cognitive styles: Predictive validity, information processing and personality characteristics, and developmental origins. Behaviour Research & Therapy. 1999;39:503–531. doi: 10.1016/s0005-7967(98)00157-0. [DOI] [PubMed] [Google Scholar]
- American Psychological Association . Publication manual of the American Psychological Association. Author; Washington, DC: 2001. [Google Scholar]
- Baron RM, Kenny DA. The moderator-mediator variable distinction in social psychological research: Conceptual, strategic, and statistical considerations. Journal of Personality & Social Psychology. 1986;51:1173–1182. doi: 10.1037//0022-3514.51.6.1173. [DOI] [PubMed] [Google Scholar]
- Beck AT, Rush AJ, Shaw BF, Emery G. Cognitive therapy of depression. Guilford Press; New York: 1979. [Google Scholar]
- Beck AT, Ward CH, Mendelson M, Mock J, Erbaugh J. An inventory for measuring depression. Archives of General Psychiatry. 1961;4:561–571. doi: 10.1001/archpsyc.1961.01710120031004. [DOI] [PubMed] [Google Scholar]
- Bell-Dolan DJ, Reaven NM, Peterson L. Depression and social functioning: A multidimensional study of the linkages. Journal of Clinical Child Psychology. 1993;23:306–315. [Google Scholar]
- Boyce P, Parker G. Neuroticism as a predictor of outcome in depression. Journal of Nervous & Mental Disease. 1985;173:685–688. doi: 10.1097/00005053-198511000-00006. [DOI] [PubMed] [Google Scholar]
- Clark LA. Schedule for Nonadaptive and Adaptive Personality (SNAP) University of Minnesota Press; Minneapolis: 1993. [Google Scholar]
- Clark LA, Simms LJ, Wu KD, Casillas A. Schedule for Nonadaptive and Adaptive Personality-2nd Edition (SNAP-2): Manual for administration, scoring, and interpretation. University of Minnesota Press; Minneapolis: in press. [Google Scholar]
- Clark LA, Vittengl JR, Jarrett RB. Separate personality traits from states to predict depression. Journal of Personality Disorders. 2003;17:152–172. doi: 10.1521/pedi.17.2.152.23990. [DOI] [PMC free article] [PubMed] [Google Scholar]
- Clark LA, Watson D. Temperament. In: Pervin L, John O, editors. Handbook of personality. 2nd Guilford; New York: 1999. pp. 399–423. [Google Scholar]
- Clark LA, Watson D, Mineka S. Temperament, personality, and the mood and anxiety disorders. Journal of Abnormal Psychology. 1994;103:103–116. [PubMed] [Google Scholar]
- Dobson KS, Breiter HJ. Cognitive assessment of depression: Reliability and validity of three measures. Journal of Abnormal Psychology. 1983;92:107–109. doi: 10.1037//0021-843x.92.1.107. [DOI] [PubMed] [Google Scholar]
- Eaves G, Rush AJ. Cognitive patterns in symptomatic and remitted unipolar major depression. Journal of Abnormal Psychology. 1984;93:31–40. doi: 10.1037//0021-843x.93.1.31. [DOI] [PubMed] [Google Scholar]
- Edwards DW, Yarvis RM, Mueller DP, Zingale HC, Wagman WJ. Test-taking and the stability of adjustment scales: Can we assess patient deterioration? Evaluation Quarterly. 1978;2:275–291. [Google Scholar]
- Eysenck HJ. Superfactors P, E and N in a comprehensive factor space. Multivariate Behavioral Research. 1978;13:475–481. doi: 10.1207/s15327906mbr1304_7. [DOI] [PubMed] [Google Scholar]
- Gladstone GG, Parker G. Depressogenic cognitive schemas: Enduring beliefs or mood state artefacts? Australian and New Zealand Journal of Psychiatry. 2001;35:210–216. doi: 10.1046/j.1440-1614.2001.00883.x. [DOI] [PubMed] [Google Scholar]
- Hamilton M. A rating scale for depression. Journal of Neurology, Neurosurgery & Psychiatry. 1960;23:56–61. doi: 10.1136/jnnp.23.1.56. [DOI] [PMC free article] [PubMed] [Google Scholar]
- Harlan E, Clark LA. Short-forms of the Schedule for Nonadaptive and Adaptive Personality (SNAP) for self and collateral ratings: Development, reliability, and validity. Assessment. 1999;6:131–146. doi: 10.1177/107319119900600203. [DOI] [PubMed] [Google Scholar]
- Hirschfeld RMA, Montgomery SA, Keller MB, Kasper S, Schatzberg AF, Moeller H, Healy D, Baldwin D, Humble M, Versiani M, Montenegro R, Bourgeois M. Social functioning in depression: A review. Journal of Clinical Psychiatry. 2000;61:268–275. doi: 10.4088/jcp.v61n0405. [DOI] [PubMed] [Google Scholar]
- Horowitz LM, Rosenberg SE, Baer BA, Ureño G, Villaseñor VS. Inventory of interpersonal problems: Psychometric properties and clinical applications. Journal of Consulting and Clinical Psychology. 1988;56:885–892. doi: 10.1037//0022-006x.56.6.885. [DOI] [PubMed] [Google Scholar]
- Ingram RE. Origins of cognitive vulnerability to depression. Cognitive Therapy and Research. 2003;27:77–88. [Google Scholar]
- Jarrett RB, Kraft D, Doyle J, Foster BM, Eaves GG, Silver PC. Preventing recurrent depression using cognitive therapy with and without a continuation phase: A randomized clinical trial. Archives of General Psychiatry. 2001;58:381–388. doi: 10.1001/archpsyc.58.4.381. [DOI] [PMC free article] [PubMed] [Google Scholar]
- Lara ME, Klein DN. Psychosocial processes underlying the maintenance and persistence of depression: Implications for understanding chronic depression. Clinical Psychology Review. 1999;19:553–570. doi: 10.1016/s0272-7358(98)00066-x. [DOI] [PubMed] [Google Scholar]
- Lewinsohn PM, Rohde P, Seeley JR, Klein DN, Gotlib IH. Natural course of adolescent major depressive disorder in a community sample: Predictors of recurrence in young adults. American Journal of Psychiatry. 2000;157:1584–1591. doi: 10.1176/appi.ajp.157.10.1584. [DOI] [PubMed] [Google Scholar]
- McGue M, Bacon S, Lykken DT. Personality stability and change in early adulthood: A behavioral genetic analysis. Developmental Psychology. 1993;29:96–109. [Google Scholar]
- Peterson C, Seligman ME. Causal explanations as a risk factor for depression: Theory and evidence. Psychological Review. 1984;91:347–374. [PubMed] [Google Scholar]
- Peterson C, Semmel A, von Baeyer C, Abramson LY, Metalsky GI, Seligman MEP. The Attributional Style Questionnaire. Cognitive Therapy and Research. 1982;6:287–300. [Google Scholar]
- Ready RE, Clark LA. Correspondence of psychiatric patient and informant ratings of personality traits, temperament, and interpersonal problems. Psychological Assessment. 2002;14:39–49. [PubMed] [Google Scholar]
- Ready R,E, Watson D, Clark LA. Psychiatric patient and informant reported personality: Predicting concurrent and future behavior. Assessment. 2002;9:361–372. doi: 10.1177/1073191102238157. [DOI] [PubMed] [Google Scholar]
- Reynolds SK, Clark LA. Predicting personality disorder dimensions from domains and facets of the five-factor model. Journal of Personality. 2001;69:199–222. doi: 10.1111/1467-6494.00142. [DOI] [PubMed] [Google Scholar]
- Rush AJ, Gullion CM, Basco MR, Jarrett RB, Trivedi MA. The Inventory for Depressive Symptomatology (IDS): Psychometric properties. Psychological Medicine. 1996;26:477–486. doi: 10.1017/s0033291700035558. [DOI] [PubMed] [Google Scholar]
- Sato T, Hirano S, Narita T, Kusunoki K, Kato J, Goto M, Sakado K, Uehara T. Temperament and character inventory dimensions as a predictor of response to antidepressant treatment in major depression. Journal of Affective Disorders. 1999;56:153–161. doi: 10.1016/s0165-0327(99)00047-6. [DOI] [PubMed] [Google Scholar]
- Schwartz JAJ, Kaslow NJ, Seeley J, Lewinsohn P. Psychological, cognitive, and interpersonal correlates of attributional change in adolescents. Journal of Clinical Child Psychology. 2000;29:188–198. doi: 10.1207/S15374424jccp2902_5. [DOI] [PubMed] [Google Scholar]
- Sherer M, Maddux J, Mercandante B, Prentice-Dunn S, Jacobs B, Rogers R. The Self-Efficacy Scale: Construction and validation. Psychological Reports. 1982;51:663–671. [Google Scholar]
- Spitzer RL, Williams JBW, Gibbon M, First MB. Structured Clinical Interview for DSM-III-R-Outpatient Version (with Psychotic Screen) NY State Psychiatric Institute, Biometrics Research Department; New York: 1989. [Google Scholar]
- Tennen H, Herzberger S, Nelson HF. Depressive attributional style: The role of self-esteem. Journal of Personality. 1987;55:631–660. doi: 10.1111/j.1467-6494.1987.tb00456.x. [DOI] [PubMed] [Google Scholar]
- Vittengl JR, Clark LA, Jarrett RB. Interpersonal problems, personality pathology, and social adjustment after cognitive therapy for depression. Psychological Assessment. 2003;15:29–40. doi: 10.1037/1040-3590.15.1.29. [DOI] [PubMed] [Google Scholar]
- Vittengl JR, Clark LA, Owen-Salters E, Gatchel RJ. Diagnostic change and personality stability following functional restoration treatment in a chronic low back pain patient sample. Assessment. 1999;6:79–92. doi: 10.1177/107319119900600109. [DOI] [PubMed] [Google Scholar]
- Weissman MM.The Dysfunctional Attitudes Scale: A validation study 1979(Doctoral dissertation, University of Pennsylvania). Dissertation Abstract International, 40, 1389B-1390B [Google Scholar]
- Weissman MM, Bothwell S. Assessment of social-adjustment by patient self-report. Archives of General Psychiatry. 1976;33:1111–1115. doi: 10.1001/archpsyc.1976.01770090101010. [DOI] [PubMed] [Google Scholar]
- Weissmann MM, Prusoff BA, Thompson WD, Harding PS, Myers JK. Social adjustment by self-report in a community sample and in psychiatric outpatients. Journalof Nervous and Mental Disease. 1978;166:317–326. doi: 10.1097/00005053-197805000-00002. [DOI] [PubMed] [Google Scholar]
- Woodruff SL, Cashman JF. Task, domain, and general efficacy: A reexamination of the Self-Efficacy Scale. Psychological Reports. 1993;72:423–432. [Google Scholar]