

Abstract
The identification of molecular signatures characteristic of tumor cells that are capable of metastatic spread is required for the development of therapeutic interventions to abrogate this lethal process. To facilitate this, we have previously characterized an experimental system in which the role of candidate metastasis-related genes can be screened and tested. Monoclonal cell lines M4A4 and NM2C5 are spontaneously occurring sublines of the MDA-MB-435 cell breast tumor cell line that exhibit phenotypic differences in growth, invasion, and metastatic efficiency in athymic mice. In this study, transcriptional profiles of these cell lines were created using oligonucleotide microarrays representing over 12,000 genes. Intensity modeling and hierarchical clustering analysis identified a 171-gene expression signature that correlated with metastatic phenotype and highlighted several GTPase signaling components. Restoration of one of these GTPases, deleted in liver cancer-1 (DLC-1), in metastatic M4A4 cells to levels observed in the nonmetastatic NM2C5 cell line resulted in the inhibition of migration and invasion in vitro and a significant reduction in the ability of these cells to form pulmonary metastases in athymic mice. These studies show the utility of expression profiling, in an appropriate experimental system, to identify genetic determinants of metastatic sufficiency. The finding that DLC-1 can act as a metastasis-suppressor gene supports an influential role for GTPase signaling in tumor progression. (Cancer Res 2005; 65(14): 6042-53)
Introduction
Breast canceris one of the most common causes of cancerrelated deaths worldwide, largely due to the recurrence of therapeutically resistant disseminated disease. Whereas the study of clinical specimens is informative, the histologic heterogeneity of solid tumor tissues makes it difficult for conventional genetic analysis to identify the essential components of breast cancer progression; hence, the genetic basis for metastatic disease is unclear. To facilitate the investigation of this complex multistep process, we have developed an experimental system in which the role of candidate metastasis genes can be screened and tested (1, 2). Monoclonal cell lines M4A4 and NM2C5 are spontaneously occurring sublines of the MDA-MB-435 cell breast tumor cell line (3, 4), which exhibit many phenotypic differences in growth, invasion, dissemination, and spontaneous metastatic efficiency from an orthotopic site. The common origin of these cell lines enables the comparative investigation of cellular and molecular events in the metastatic process in a stable and isogeneic model.
We have previously identified a number of molecular differences between the two cell lines through molecular cytogenetic evaluation (5) and comparative transcriptional (1, 6, 7) and proteomic analyses (8). To further elucidate the extent of the molecular changes associated with acquisition of the metastatic phenotype, we have now used a genome-wide expression profiling approach. Oligonucleotide microarray technology (Affymetrix U95A GeneChips) was used to create a gene expression database of over 12,000 genes containing profiles of the nonmetastatic NM2C5 and the metastatic M4A4 cells. Our dChip intensity modeling approach was used to compute the gene expression values and confidence interval for the fold change of each gene in the expression profile (9). Hierarchical clustering analysis revealed a subset of 171 genes whose expression was statistically correlated with cellular phenotype. Some genes in this group have previously been implicated in invasion, tumor cell proliferation, and/or metastasis, but many have not. Differentially expressed genes belonged to various functional groups, but GTPase signaling components were one of the most well represented. These factors regulate multiple functions, many of which may impact the ability of a transformed cell to achieve metastatic efficiency. The most differentially expressed of the GTPase signaling components, deleted in liver cancer 1 (DLC-1), was chosen to test the utility of the molecular profiling approach to identify genes involved in metastatic efficiency.
The human DLC-1 gene encodes a 1,091 amino acid protein that is highly homologous to the rat p122-RhoGAP (10, 11). Rho-GTPase—activating proteins (RhoGAP) are important regulators in the switching between the active GTP-bound state and the inactive GDP-bound state of Rho proteins. RhoGAPs catalyze the conversion of the active GTP-bound Rho proteins to the inactive state, thereby attenuating their signal transduction activities. Thus, RhoGAPs act as negative modulators (12). The Rho proteins are members of the Ras superfamily and are involved in a variety of cellular functions, including the regulation of cell proliferation and actin cytoskeleton organization (13, 14), and have been implicated in oncogenic transformation and cancer progression (15, 16). The study of DLC-1 in cancer has shown that it meets several criteria of a tumor suppressor gene. It is frequently inactivated due to genomic deletion or promoter hypermethylation in transformed cells, and its overexpression can result in the inhibition of in vitro colony formation, cell migration, and the suppression of tumor formation in immunocompromised mice (17-19). In the present study, restoration of the DLC-1 gene in M4A4 cells by cDNA transduction proved to inhibit invasion and migration in vitro and to reduce the ability of these cells to form metastases in vivo. Further study of the function of DLC-1 and other candidate genes in this model will aid the elucidation of the molecular networks involved in the acquisition of metastatic sufficiency.
Materials and Methods
Cell culture and RNA preparation. Cell lines were propagated in RPMI 1640 supplemented with 10% newborn calf serum (Life Technologies, Inc., Gaithersburg, MD) at 37°C in a humidified atmosphere of 5% CO2-95% air. Analyses were done on cultures passaged no more than 10 times from frozen stocks. Cultures were tested and declared free of Mycoplasma and common murine pathogens. Cells were harvested at ∼75% confluence by direct application of RNeasy lysis buffer (Qiagen, Valencia, CA) and homogenized by needle shearing. Frozen xenograft tissues were mechanically homogenized directly in the same chaotropic lysis buffer. After RNeasy kit purification, total RNA was incubated with 0.08 unit/μL of RNase-free DNase (Promega, Madison, WI) for 40 minutes at 37°C. RNA samples were quantitated by spectrophotometry, checked for quality by agarose gel electrophoresis, and stored at —80°C.
Xenograft inoculation and recovery. Female athymic mice (BALB/c nu/nu; B&K Universal, Fremont, CA), ages 8 to 10 weeks, were housed in an isolation suite for the duration of the experiments and cared for in accordance with the standards of University of California, San Diego, under an approved protocol of the University of California. The tumorigenicity and spontaneous metastatic capability of the cell lines were determined by orthotopic inoculation into the mammary fat pad of six to nine animals per cell line. One million cells in 0.05 mL of a 1:1 mixture of RPMI 1640 and Matrigel (BD Biosciences, San Jose, CA) were inoculated into the right flank mammary fat pad of an anesthetized mouse. The rate of primary tumor growth was determined by plotting the means of two orthogonal diameters of the tumors, and animals were euthanized and autopsied at 3 to 5 months postinoculation when a primary tumor reached a diameter of 2 cm. Primary xenograft tissues were snap-frozen and stored under liquid nitrogen until used for DNA or RNA extraction, or formalin-fixed for histologic preparations following standard protocols.
Affymetrix GeneChip array analyses. Oligonucleotide microarray experiments were done as previously described (20). Briefly, total RNA was extracted from cell pellets using the RNeasy kit (Qiagen, Chatsworth, CA). Sample biochemistry (reverse transcription, second-strand synthesis, and probe generation) was done according to the Affymetrix Expression Analysis Technical Manual (Affymetrix, Santa Clara, CA). Labeled cRNA (20 μg) was hybridized for 18 hours at 45°C to Affymetrix Human Genome arrays (U95A). The arrays were washed and RNA was fluorescently labeled by incubation in streptavidin—R-phycoerythrin conjugate staining buffer at 40°C for 15 minutes, then washed at 22°C. A GeneChip array scanner detected the presence, location, and amount of bound target on the probe array. Raw data were collected using Affymetrix Microarray Suite (MAS 5.0) software. Replicate experiments were done using RNA samples extracted from independent cell line cultures.
Microarray data analysis. The dChip intensity modeling approach was used to compute the gene expression values and confidence interval for the fold change of each gene in the expression profile (9). A paired two-group comparison for each probe set was done, considering both measurement error and variation among individual samples (21). Paired analyses within each batch were necessary because the RNA chips were processed at different times and the possible batch effects were noted. Genes were determined to have altered expression levels in the metastatic versus the nonmetastatic group based on the following criteria: (a) lower bound fold change of two groups >1.3 in either direction in all pairs; (b) the difference between the mean expression levels of two groups >100 in either direction in all pairs. Such criteria were selected to have zero false positives when permuting the group labels. Classification of metastasis-related genes by functional grouping was based on annotation terms of Gene Ontology, protein domain, chromosome location, and pathway information from NetAffx (www.affymetrix.com/index.affx).
Hierarchical clustering. The metastasis-related genes were clustered and ordered by a hierarchical clustering algorithm using a centroid-linkage method (21). Briefly, the expression values for a gene across the eight samples were standardized to have mean 0 and SD 1 by linear transformation, and the distance between two genes was defined as 1 — r, where r is the standard correlation coefficient between the eight standardized values of two genes. Two genes with the closest distance were first merged into a supergene and connected by branches with length representing their distance, and were then deleted for future merging. The expression level of the newly formed supergene is the average of standardized expression levels of the two genes (centroid linkage) for each sample. Then, the next pair of genes (supergenes) with the smallest distance were merged, and the process was repeated n times to merge all n genes. The software (dChip 1.3) used to implement model-based expression calculations, two-group comparison, and clustering is available at www.dChip.org.
Evaluation of candidate gene proximity. The list of genes generated by dChip analysis were mapped according to chromosomal location using Genome View (21). Genes on each chromosome were placed on a map proportionally from chromosomal position 0 to the gene with the maximal chromosomal position. Transcription start site was used for relative gene position mapping. P values were calculated for gene stretches ≤20 selected genes to assess the significance (P <0.01) of gene proximity (www.dChip.org). Normalized rank distances were reduced to the order statistics of uniform distributions and P values were ascertained. In effect, the tightness of a stretch of n genes against that of n genes randomly put on the chromosome is assessed for significant clustering of genes on a chromosome.
Real-time, quantitative PCR analysis of RNA. DNase-treated RNA was reverse transcribed using Moloney murine leukemia virus reverse transcriptase with a combination of oligo (dT) and random primers (Ambion, Austin, TX). The resulting cDNA was used as a template for quantitative PCR (qPCR) using gene-specific primers. Real-time, quantitative PCR was done on an Applied Biosystem PRISM 7700 Sequence Detection System using SYBR Green I chemistry (PE Applied Biosystems, Foster City, CA) as described previously (22, 23). Briefly, PCR was done using the SYBR Green PCR Master Mix kit containing SYBR green I dye, AmpliTaq Gold DNA Polymerase, deoxynucleotide triphosphates with dUTP, passive reference, and optimized buffer components (PE Applied Biosystems). PCR primers were designed against the 3′ untranslated region of the human target genes using MacVector software (Oxford Molecular, Beaverton, OR) and designed to avoid potential binding to mouse homologue sequences. Fifty nanograms of cDNA template were added to a reaction volume of 25 μL and all primers were used at a final concentration of 100 nmol/L. No-template controls were included for each target. Thermocycling was initiated with a 10-minute, 95°C enzyme activation step followed by 40 cycles of 95°C for 15 seconds, 60°C for 1 minute, and 72°C for 1 minute. All reactions were done in triplicate, and each reaction was gel-verified to contain a single product of the correct size. Data analysis was done using the relative standard curve method as outlined by the manufacturer (PE Applied Biosystems) and as described previously (23). The mean glyceraldehyde-3-phosphate dehydrogenase (GAPDH) concentration (primer set supplied by PE Applied Biosystems) was determined for each cDNA sample and used to normalize expression of other genes tested in the same sample. The relative difference in expression was recorded as the ratio of normalized target concentrations for the same cDNA dilution. Gene-specific primer sequences are available on request.
Generation of M4A4-DLC1 cell lines. Full-length human DLC-1 cDNA was subcloned into the pLNCX expression vector (18) and used to transduce M4A4 cells as previously described (6). G418-resistant clones were propagated and screened for DLC-1 expression. Real-time qPCR using cDNA from the M4A4-DLC1 clones and primers DLC1 2845-5′ CGAGGAAATGAGCCGATGTCG and DLC1 3542-3′ TGTTCTGGTTACTGAAGGAATCCCG was applied to evaluate the transcript levels of DLC-1 in the monoclonal lines relative to GAPDH mRNA expression. M4A4-neo control cells were generated by transduction with the retroviral vector pLNCX alone (Clontech, Palo Alto, CA).
In vitro invasion and migration assays. Rates of migration and invasion of cells were evaluated using the modified Boyden chamber assay as previously described (6). Briefly, cells were plated in triplicate at 5 × 10⁵/3 cells per well in serum-free medium on 8 μm pore polycarbonate membranes of transwell chambers precoated with Matrigel (BD Biosciences). Control inserts (migration only) contained no Matrigel coating. The lower chambers of the transwells contained RPMI 1640 with 10% fetal bovine serum as chemoattractant. Cells were incubated for 72 hours at 37°C in a 5% CO2 atmosphere. The total number of cells in the upper and lower compartments of the transwell chambers was determined after detachment by trypsin treatment using a hemocytometer. The number of cells that had migrated/invaded through the membranes was adjusted for cell growth. Comparisons between group means were assessed using a one-way ANOVA with the Newman-Keuls posttest (GraphPad Software, Inc., San Diego, CA). Values were expressed as the mean ± SE. P < 0.05 were considered significant.
Quantitative detection of human Alu sequences in mice lungs. The detection of human tumor cells present in the lungs of experimental mice was achieved by the quantitative detection of human Alu sequences present in total lung genomic DNA preparations. Our approach was based on the method used by Schneider et al. (24). Whole lungs from untreated control mice and from mice inoculated with M4A4-neo and M4A4-DLC1 cells were dissected at autopsy and homogenized in PBS. Genomic DNA was isolated with the DNeasy Tissue kit (Qiagen, Valencia, CA). Human Alu sequences were PCR-amplified on an ABI Prism 7700 sequence detection system (PE Applied Biosystems) in a 25 μL reaction mixture using 12 μL of 2× SYBR Green PCR master mix, 500 nmol/L of Alu sequence primers, and 60 ng of template DNA. The primer sequences used were as follows: Alu sense, 5′-CACCTGTAATCCCAGCACTTT-3′; Alu antisense, 5′-CCCAGGCTGGAGTGCAGT-3′. These primers are complementary to the longer right monomer of the Alu repeat consensus sequences (25, 26). PCR reaction conditions were as follows: 95°C for 10 minutes followed by 40 cycles of 95°C for 30 seconds; 65°C for 5 seconds and 72°C for 10 seconds. All reactions were done in triplicate and each assay included control murine lung DNA and a no-template control. A dissociation curve analysis was done for each reaction. Quantification of human DNA in murine tissue was based on a standard curve prepared with serial dilutions (0.5 pg-2 ng) of human genomic DNA (Promega) mixed with 60 ng of mouse DNA (extracted from untreated athymic mice lung tissue) in a 25 μL reaction. To approximate the actual number of tumor cells present in each tissue sample, the amount of human genomic DNA per cell (∼7.5 pg) was calculated via a standard curve constructed after measuring the amount of DNA extracted from serial dilutions of 2.5 × 10⁶ to 104 cells. This is in agreement with the calculation of the size of the human genome (3.3 × 10⁹ bp/haploid nucleus) which is ∼7.2 pg/cell. The amount of mouse DNA per cell can then be estimated by the mouse genome (2.7 × 10⁹ bp/haploid nucleus) to be ∼5.9 pg/cell. Sixty nanograms of mouse DNA would then be ∼10,000 cells. Data processing and statistical analysis were done using Microsoft Excel (Microsoft Corporation, Redmond, WA) and GraphPad Prism (GraphPad Software). Comparative statistical significance was calculated a one-way ANOVA with the Newman-Keuls posttest (GraphPad Software).
Results
Gene expression signature associated with metastatic phenotype. To investigate whether gene expression differences could be found that distinguished the metastatic M4A4 and nonmetastatic NM2C5 cell lines, RNA samples were profiled using microarray technology. Quadruplicate, independent RNA samples prepared from each cell line were labeled and hybridized to Affymetrix U95A oligonucleotide GeneChip arrays containing ∼12,600 genes. Hybridization signal intensities derived from >200,000 measurements per chip were normalized using algorithms in which individual sample expression is compared with the mean of all samples. The dChip model-based approach was used to compute the gene expression values and confidence interval for the fold change of each gene in the profiled cell lines samples (9). Classification of genes having altered expression levels in the metastatic M4A4 cell line relative to nonmetastatic NM2C5 cells was based on a number of criteria, including (a) a lower bound fold change of the mean expression of the two groups >1.3 in either direction and (b) the difference between the mean expression levels of two groups was >100 in either direction (see Microarray data analysis in Materials and Methods). An initial subset of genes that maximally varied between experimental groups was selected for hierarchical clustering and grouping by biological function. Using a centroid-linkage hierarchical clustering algorithm, genes were ordered and visualized in a heatmap diagram in which the pattern and length of the branches reflect the relatedness of the samples (see Supplemental Data for raw data and figures at http://biowww.dfci.harvard.edu/~rskim/goodison/). A total of 171 genes were identified as either significantly up-regulated or down-regulated with respect to the metastatic phenotype. In line with our previous studies of this metastasis model (1, 6, 8), genes identified as down-regulated (112 genes) in the metastatic cell line were considerably more numerous than those that were elevated (59 genes). The identities of all 171 genes are available in the Supplemental Data, but the 85 most highly ranked differentially expressed genes (>2-fold change) are listed in Table 1. Among the top-ranked genes were some that we had previously identified using alternative molecular screening approaches, including osteopontin and tyrosinase-related protein 1 (1, 6, 8). The differentially expressed genes were then clustered into groups according to biological function. Analysis revealed a decreased expression of genes belonging to the classes of GTPases (deleted in liver cancer 1, Rac/Cdc42 guanine nucleotide exchange factor 6, G protein γ 11, Rho-related gene 3), and the epidermal growth factor—like domain genes (fibronectin, integrins, thrombospondin 1) in metastatic M4A4 cells. A high number of transcription factor genes also had increased expression in M4A4 cells, including v-maf, MAX interactor 1, aryl-hydrocarbon receptor nuclear translocator 2 and the cAMP responsive element modulator.
Table 1.
Differentially expressed transcripts as indicated by microarray analysis
| Affymetrix probe no. | Genes | Entrez gene no. | Fold change | Biological process or localization |
|---|---|---|---|---|
| Up-regulated in M4A4 cells | ||||
| 2092_s_at | Osteopontin | 6696 | 41.79 | Ossification, cytokine activity |
| 34342_s_at | Osteopontin | 6696 | 33.35 | Ossification, cytokine activity |
| 41531_at | Transmembrane 4 superfamily member 1 | 4071 | 4.8 | Integral to plasma membrane |
| 36062_at | Leupaxin | 9404 | 3.67 | Protein complex assembly |
| 41182_at | Tyrosinase-related protein 2 | 1638 | 3.35 | Melanin biosynthesis |
| 38927_i_at | Tyrosinase (oculocutaneous albinism IA) | 7299 | 3.28 | Melanin biosynthesis |
| 31465_g_at | Tyrosinase-related protein 2 | 1638 | 3.26 | Melanin biosynthesis |
| 36711_at | V-maf musculoaponeurotic fibrosarcoma oncogene homologue F (avian) | 23764 | 3.25 | Transcription regulation |
| 34696_at | 3-Hydroxyisobutyryl-CoA hydrolase | 26275 | 3.12 | Catalytic activity |
| 40215_at | UDP-glucose ceramide glucosyltransferase | 7357 | 2.83 | Glucosylceramide biosynthesis |
| 892_at | Transmembrane 4 superfamily member 1 | 4071 | 2.82 | Integral to plasma membrane |
| 33193_at | Hypothetical protein FLJ10055 | 55062 | 2.77 | |
| 38928_r_at | Tyrosinase (oculocutaneous albinism IA) | 7299 | 2.67 | Melanin biosynthesis |
| 38110_at | Syndecan binding protein (syntenin) | 6386 | 2.58 | Membrane targeting |
| 33362_at | CDC42 effector protein (Rho GTPase binding) 3 | 10602 | 2.45 | Cytoskeletal regulatory protein binding |
| 34155_s_at | Tyrosinase (oculocutaneous albinism IA) | 7299 | 2.33 | Melanin biosynthesis |
| 36933_at | N-myc downstream regulated gene 1 | 10397 | 2.33 | Cell differentiation |
| 35352_at | Aryl-hydrocarbon receptor nuclear translocator 2 | 9915 | 2.32 | Response to hypoxia |
| 38073_at | RNA (guanine-7-)methyltransferase | 8731 | 2.24 | mRNA capping |
| 40237_at | Pleckstrin homology-like domain, family A, member 2 | 7262 | 2.21 | Imprinting, apoptosis |
| 32067_at | cAMP responsive element modulator | 1390 | 2.18 | Transcription factor |
| 809_at | RAB27A, member RAS oncogene family | 5873 | 2.15 | GTPase |
| 748_s_at | MAX interactor 1 | 4601 | 2.12 | Transcription corepressor |
| 39072_at | MAX interactor 1 | 4601 | 2.1 | Transcription corepressor |
| 1812_s_at | Proto-oncogene Met, Alt. splice form 2 | HG1747-HT1764* | 2.08 | |
| 36938_at | N-acylsphingosine amidohydrolase (acid ceramidase)1 | 427 | 2.07 | Fatty acid metabolism |
| 717_at | Tribbles homologue 2 | 28951 | 2.07 | Protein kinase |
| 35769_at | G protein-coupled receptor 56 | 9289 | 2.04 | Receptor |
| 32225_at | ATPase, Na+/K+ transporting, α1 polypeptide | 476 | 2.03 | Ion transport |
| 37023_at | Lymphocyte cytosolic protein 1 (L-plastin) | 476 | 2.03 | Actin binding |
| 38422_s_at | Four and a half LIM domains 2 | 2274 | 2.02 | Transcription regulation |
| Up-regulated in NM2C5 cells | ||||
| 36911_at | Tyrosinase-related protein 1 | 7306 | 19.03 | Melanin biosynthesis |
| 38772_at | Cysteine-rich, angiogenic inducer, 61 | 3491 | 13.82 | Regulation of cell proliferation |
| 41191_at | Palladin | 23022 | 10.25 | Biogenesis of lysosome-related organelles |
| 36638_at | Connective tissue growth factor | 1490 | 7.51 | Regulation of cell proliferation |
| 32242_at | Crystallin, αB | 1410 | 7.13 | Protein folding |
| 32243_g_at | Crystallin, αB | 1410 | 6.06 | Protein folding |
| 681_at | Matrix metalloproteinase 8 (neutrophil collagenase) | 4317 | 5.8 | Collagen catabolism |
| 37403_at | Annexin A1 | 301 | 5.24 | Calcium ion binding |
| 38042_at | Glucose-6-phosphate dehydrogenase | 2539 | 4.96 | Glucose 6-phosphate utilization |
| 41049_at | Insulin receptor substrate 1 | 3667 | 4.69 | Insulin receptor binding |
| 37958_at | Transmembrane 4 superfamily member 10 | 83604 | 4.62 | Transmembrane |
| 38842_at | Angiomotin-like 2 | 51421 | 4.55 | Mediates angiostatin inhibition of endothelial cell migration |
| 40953_at | Calponin 3, acidic | 1266 | 4.11 | Actin binding |
| 296_at | Tubulin, β | HG4322-HT4592* | 4.07 | Structural |
| 39754_at | Integrin, β5 | 3693 | 3.6 | Cell-matrix adhesion |
| 115_at | Thrombospondin 1 | 7057 | 3.54 | Matrix interactions, inflammatory response, angiogenesis inhibitor |
| 32215_i_at | Rho-related BTB domain containing 3 | 22836 | 3.47 | GTPase activity |
| 32434_at | Myristoylated alanine-rich protein kinase C substrate | 4082 | 3.4 | Cell motility, mitogenesis |
| 851_s_at | Insulin receptor substrate 1 | 3667 | 3.4 | Insulin receptor binding |
| 31684_at | Annexin A2 pseudogene 1 | 303 | 3.34 | |
| 37951_at | Deleted in liver cancer 1 | 10395 | 3.34 | Regulation of cell proliferation |
| 769_s_at | Annexin A2 | 302 | 3.32 | Calcium ion binding |
| 38655_at | Hypothetical protein MGC5576 | 79022 | 3.17 | |
| 36792_at | Tropomyosin 1 (α) | 7168 | 3.1 | Actin binding |
| 39109_at | TPX2, microtubule-associated protein homologue | 22974 | 3.07 | Cell proliferation |
| 38350_f_at | Similar to a tubulin | 112714 | 2.93 | |
| 38420_at | Collagen, type V, α2 | 1290 | 2.93 | ECM structural constituent |
| 1884_s_at | Proliferating cell nuclear antigen | 5111 | 2.93 | Regulation of cell cycle |
| 37027_at | Hypothetical protein MGC5395 | 79026 | 2.92 | Intracellular signaling cascade |
| 37755_at | BTB (POZ) domain containing 3 | 22903 | 2.86 | Protein binding |
| 33240_at | PDZ domain containing RING finger 3 | 23024 | 2.79 | Protein binding |
| 297_g_at | Tubulin, β | HG4322-HT4592* | 2.76 | Structural |
| 38065_at | High-mobility group box 2 | 3148 | 2.75 | DNA binding |
| 40195_at | H2A histone family, member X | 3014 | 2.75 | Nucleosome assembly |
| 31720_s_at | Fibronectin 1 | 2335 | 2.69 | Cell adhesion |
| 40078_at | Protease, serine, 23 | 11098 | 2.67 | Chymotrypsin activity |
| 32755_at | Actin, α2, smooth muscle, aorta | 59 | 2.57 | Motor activity |
| 35837_at | Scrapie responsive protein 1 | 11341 | 2.49 | Neurogenesis |
| 36989_at | Dystroglycan 1 (dystrophin-associated glycoprotein 1) | 1605 | 2.48 | Laminin receptor activity |
| 40454_at | FAT tumor suppressor homologue 1 (Drosophila) | 2195 | 2.43 | Cell-to-cell signaling |
| 36181_at | LIM and SH3 protein 1 | 3927 | 2.43 | SH3/SH2 adaptor |
| 40992_s_at | Sin3-associated polypeptide, 30 kDa | 8819 | 2.43 | Transcription corepressor |
| 34678_at | Fer-1 like 3, myoferlin (C. elegans) | 8819 | 2.41 | Muscle contraction |
| 39331_at | Tubulin, β polypeptide | 7280 | 2.37 | Structural molecule |
| 32855_at | Low-density lipoprotein receptor (familial hypercholesterolemia) | 3949 | 2.33 | Transmembrane receptor |
| 39597_at | Actin-binding LIM protein family, member 3 | 22885 | 2.32 | Cytoskeleton organization and biogenesis |
| 40803_at | Pro-oncosis receptor inducing membrane injury gene | 114908 | 2.3 | Receptor |
| 442_at | Tumor rejection antigen (gp96) 1 | 7184 | 2.3 | Heat shock protein |
| 35907_at | Cyclin F | 899 | 2.27 | Regulation of cell cycle |
| 2085_s_at | Catenin (cadherin-associated protein), α1, 102 kDa | 1495 | 2.25 | Cell adhesion |
| 39145_at | Myosin, light polypeptide 9, regulatory | 10398 | 2.19 | Nucleosome assembly |
| 37908_at | Guanine nucleotide binding protein (G protein), γ11 | 2791 | 2.18 | G protein signaling |
| 39046_at | H2A histone family, member V | 94239 | 2.14 | DNA binding |
| 41155_at | Catenin (cadherin-associated protein), α1, 102 kDa | 1495 | 2.14 | Cell adhesion |
| 36578_at | Baculoviral IAP repeat-containing 2 | 329 | 2.13 | Antiapoptosis |
| 39760_at | Quaking homologue, KH domain RNA binding (mouse) | 9444 | 2.12 | RNA binding |
| 35839_at | Squalene epoxidase | 6713 | 2.11 | Electron transport |
| 757_at | Annexin A2 | 302 | 2.08 | Calcium ion binding |
| 37543_at | Rac/Cdc42 GEF 6 | 9459 | 2.06 | Apoptosis |
| 33127_at | Lysyl oxidase-like 2 | 4017 | 2.05 | Scavenger receptor |
| 36119_at | Caveolin 1, caveolae protein, 22 kDa | 857 | 2.04 | Integrin-mediated cell adhesion |
| 36488_at | EGF-like-domain, multiple 5 | 1955 | 2.00 | Structural molecule activity |
| 35771_at | Deformed epidermal autoregulatory factor 1 | 10522 | 2.00 | DNA binding |
| Up-regulated in M4A4-DLC1 cells | ||||
| 39827_at | DNA damage inducible transcript 4 | 54541 | 5.99 | Transcriptional target of p53, stress response |
| 658_at | Thrombospondin 2 | 7058 | 5.03 | Cell adhesion, angiogenesis inhibitor |
| 34922_at | Cadherin 19, type 2 | 28513 | 4.35 | Homophilic cell adhesion |
| 659_g_at | Thrombospondin 2 | 7058 | 4.07 | Cell adhesion, angiogenesis inhibitor |
| 41421_at | Calmodulin-binding transcription activator 2 | 23125 | 4.00 | Transcription activation |
| 35837_at | Scrapie responsive protein 1 | 11341 | 3.94 | Neurogenesis |
| 287_at | Activating transcription factor 3 | 467 | 3.93 | Transcription factor |
| 41408_at | Suppressor of var1, 3-like 1 (S. cerevisiae) | 6832 | 3.74 | Helices C |
| 37951_at | Deleted in liver cancer 1 | 10395 | 3.61 | Regulation of cell proliferation |
| 32168_s_at | Down syndrome critical region gene 1 | 1827 | 3.40 | Calcium-mediated signaling |
| 41048_at | Phorbol-12-myristate-13-acetate-induced protein 1 | 5366 | 3.33 | Mediator of p53-dependent apoptosis |
| 36070_at | KIAA1199 protein | 57214 | 3.30 | |
| 35799_at | DnaJ (Hsp40) homologue, subfamily B, member 9 | 4189 | 3.08 | Protein folding |
| 39219_at | CCAAT/enhancer binding protein, γ | 1054 | 2.71 | Transcription regulation |
| 39023_at | Isocitrate dehydrogenase 1 (NADP+), soluble | 3417 | 2.62 | Tricarboxylic acid cycle |
| 33849_at | Pre B-cell colony-enhancing factor | 10135 | 2.56 | Regulation of cell proliferation |
| 32901_s_at | IFN-related developmental regulator 1 | 3475 | 2.54 | Myoblast cell fate determination |
| 37544_at | Nuclear factor, interleukin 3 regulated | 4783 | 2.53 | Transcription regulation |
| 33285_i_at | Hypothetical protein FLJ21168 | 80143 | 2.50 | |
| 36203_at | Ornithine decarboxylase 1 | 4953 | 2.45 | Polyamine biosynthesis |
Affymetrix transcript ID.
Chromosomal location clustering. To investigate whether genes of interest were associated with regard to chromosomal location, genes were mapped using Genome View (http://www.biostat.harvard.edu/complab/dchip/map%20chromosome.htm). Clustered genes were aligned and P values calculated for stretches of 20 or less selected genes to assess the significance of gene proximity for all 171 differentially expressed genes (see Supplemental Data). The distribution of the differentially expressed genes across the genome was mostly random, indicating that gross chromosomal rearrangement is not the major factor influencing the observed expression patterns, but several genes were found to be in close genomic proximity. Major regions of differentially expressed gene clusters were evident on chromosomes 4 and 15. Aligning the differentially expressed genes according to a more detailed chromosomal position, it was noted that three of the genes more highly expressed in M4A4 cells were grouped together at 15q15. Of the genes more highly expressed in NM2C5 cells, four were grouped at 11q22 and two at 20pter. Each of these chromosomal regions have been revealed to be involved in cell-specific chromosomal rearrangements in a comprehensive molecular cytogenetic analysis of the M4A4, NM2C5 cell lines that we have recently done (5).
Array data validation. The aim of the expression profiling done in this study was to identify genes that play a potential role in the induction or inhibition of the metastatic phenotype and that warrant functional in vivo investigation. Whereas there are advantages to comparing the profiles of “pure” human cell line populations, we have previously observed considerable differences in specific gene expression between cells grown in culture and those growing in primary tumors in the murine host (7). This is entirely expected because of the influence the microenvironment has on tumor cell gene expression patterns. Therefore, we needed to validate that the differential expression of the genes of interest to us was retained in the cells comprising the in vivo primary tumor mass. The drawback of analyzing xenograft material is the prevalence of murine signal cross-hybridization or amplification, but this can be avoided by qPCR analysis using primers that are specific to human mRNA sequences. We selected 10 genes of interest and analyzed expression levels in triplicate RNA samples extracted from cultured cells and from xenograft material. Of the genes selected from the microarray data, all were validated as being differentially expressed in the cultured cell line RNA samples (Table 2). The high validation rate is likely due to the use of replicate array data and the use of evolving bioinformatics programs, such as dChip, that rank differentially expressed genes using P values rather than fold change (20, 21). Due to the more selective and specific analysis of a single gene when using qPCR, the level of differential expression was expectedly higher than estimated by microarray analysis in most cases (Table 2). Measurements of in vivo expression levels were more in line with microarray data. Of the 10 genes tested, the observed in vitro difference of one gene (RAB27A) was not maintained in vivo (Table 2).
Table 2.
Real-time, qPCR verification of GeneChip arrays results
| Affymetrix probe no. | Genes | Entrez gene no. | Fold change |
||
|---|---|---|---|---|---|
| GeneChip arrays | In vitro qPCR | In vivo qPCR | |||
| Up-regulated in M4A4 cells | |||||
| 2092_s_at | Osteopontin | 6696 | 41.79 | 80 | 25 |
| 809_at | RAB27A, member RAS oncogene family | 5873 | 2.15 | 5.2 | Equal |
| 41182_at | Tyrosinase-related protein 2 | 1638 | 3.35 | 3 | 2.1 |
| Up-regulated in NM2C5 cells | |||||
| 36911_at | Tyrosinase-related protein 1 | 7306 | 19.03 | 200 | 400 |
| 38772_at | Cysteine-rich, angiogenic inducer, 61 | 3491 | 13.82 | 100 | 4.5 |
| 681_at | Matrix metalloproteinase 8 (neutrophil collagenase) | 4317 | 5.8 | 80 | 20 |
| 115_at | Thrombospondin 1 | 7057 | 3.54 | 30 | 14 |
| 37951_at | Deleted in liver cancer 1 | 10395 | 3.34 | 2.4 | 7 |
| 37403_at | Annexin A1 | 301 | 5.24 | 9.2 | 7.6 |
| 36638_at | Connective tissue growth factor | 1490 | 7.51 | 7 | 10 |
Retroviral transduction of M4A4 cells with DLC-1. A criterium often used to prioritize genes for further study is the degree of differential expression. However, fold change values are not necessarily linked to phenotypic effect and given that the genes were identified using stringent statistical criteria, prioritizing genes using fold change is somewhat arbitrary. An example of this is osteopontin (OPN), the most highly expressed gene in M4A4 cells relative to NM2C5. Having previously identified OPN as a candidate gene in earlier studies (1), we have previously manipulated the ectopic expression of this gene in NM2C5 cells and retested their metastatic capability in vivo , but no effect on the phenotype in athymic mice was revealed.7 Through green fluorescent protein labeling and tracking of NM2C5 cells in vivo , we have previously observed that NM2C5 cells are capable of reaching the lung efficiently (2), but are unable to proliferate and form metastases. This inability was not due to any intrinsic loss of proliferative capacity because the cells were able to grow exponentially and indefinitely when retrieved from the lung tissue and cultured in vitro or reinoculated into the mammary gland. It was also not attributable to inhibition by circulating factors from a concomitant primary tumor in the mammary gland, as indicated by the absence of metastases after resection of the primary tumor. Thus, whereas NM2C5 cells thrive in the mammary gland, mitotic quiescence of disseminated NM2C5 cells is induced by the surrounding cellular microenvironment experienced in the lung. Clearly, these cells do not have a fixed genetic program as they are not insensitive to the environment. Thus, genes of interest on our list would be those involved in cell proliferation, in the response to environmental signals, and/or in mediating downstream effects as part of a signaling cascade. The DLC-1 gene fits all of these criteria and was thus chosen to test the utility of the global expression approach in identifying genes that have a role in the phenotype of the metastasis model.
To evaluate a possible functional role for DLC-1 in the phenotype of the MDA-MB-435 metastasis model, M4A4 cells were transduced with the full-length human DLC-1 cDNA to increase its expression. Single-cell clones of stably transduced cells were selected and propagated, and analyzed individually for the expression level of DLC-1 using quantitative PCR. Microarray and quantitative PCR analyses revealed that NM2C5 cells express DLC-1 transcripts at levels ∼3-fold greater than M4A4 cells (Tables 1 and 2). To make a fair comparison of subsequent phenotype, we deliberately intended to select a clonal M4A4-DLC1 cell line that had DLC-1 expression levels equivalent to nonmetastatic NM2C5 cells. However, it is interesting to note that among 11 M4A4-DLC1 clonal cell lines tested, we could not find any that had DLC-1 expressed at >3.4-fold the level of M4A4 cells and, therefore, never significantly greater than that observed in NM2C5 cells. No significant difference in DLC-1 levels between M4A4 and M4A4-neo cells was observed nor were any clear differences in cellular morphology between the M4A4-DLC1 clones and the unmanipulated, or vector-only transduced M4A4 populations evident. Although the in vitro proliferation rate of the M4A4-DLC1 clone was reduced relative to parental M4A4 and vector-only transduced M4A4-neo cells, the growth rate remained higher than the NM2C5 cell population (data not shown).
Tumorigenicity and metastatic propensity of M4A4-DLC1 cells. To assess the effects of DLC-1 on phenotype in vivo ,we injected equivalent numbers of NM2C5, M4A4, M4A4-DLC1, and M4A4-neo cells into the mammary fat pad of BALB/c athymic nude mice. All cell lines tested were tumorigenic in all cases and formed palpable tumors within 2 weeks. The M4A4-DLC1 primary tumor growth rate was not significantly different from the other M4A4-inoculated groups. As previously described, we evaluated meta-static capability under equivalent primary tumor loads by sacrifice at an end-point dependant on primary tumor size rather than a defined postinoculation period (1).
The accurate measurement of metastatic efficiency in mouse models is problematic. In the majority of previously reported studies, macroscopically detectable surface lesions have been used as a measure of the degree of metastasis. For monitoring potentially subtle changes in metastatic burden, such measurements are insufficient because surface examination does not take into consideration intraorgan metastasis, they assume equal distribution of tumor cells within an organ, and they do not enable the detection of small tumor cell populations. Additionally, the manipulation of the test cell line may change the metastatic pattern as well as the overall metastatic efficiency so surface evaluation alone may miss important changes. Classic histologic evaluation of host organs provides an improved, albeit nonquantitative estimation, but for practical reasons such analyses are most often done in only a few sections of the relevant organs. More comprehensive and more quantitative methods of analysis are essential for the accurate evaluation of metastasis in experimental models. In this study, we utilized the ability to detect human specific Alu DNA sequences in a nonhuman genetic background. Procedures used to detect Alu sequences have improved with evolving technological advances (27, 28); moreover, with the advent of accessible quantitative PCR methodology, the detection of Alu sequences now offers the most accurate analysis of metastasis in secondary organs (24, 29).
Quantification of human DNA in murine tissue was based on a standard curve prepared with serial dilutions of human genomic DNA (0.5 pg-2 ng) mixed with 60 ng of mouse genomic DNA. The detection limit of the assay was 2 pg of human DNA in a 20 μL reaction (100 pg/mL), which equates to 0.27 cell equivalents, or 27 human cells in a background of 1 × 10⁶ mouse cells (see Materials and Methods). Monitoring the amplification of a 4-fold serial dilution of human DNA, curves shifted to increasingly higher cycle numbers as template copy numbers decreased (Fig. 1A). An excellent relationship (r2 = 0.996) between the Alu signal and the amount of human DNA present in the reaction was evident (Fig. 1B). The presence of a single amplification product was confirmed by melting curve analysis (Fig. 1C) and the specificity of the product was proven by the absence of a PCR product when using only murine DNA as template (data not shown). Thus, this rapid assay was sensitive, reliable, and specific for human Alu sequences.
Figure 1.

Quantification of human Alu sequences by real-time quantitative PCR. A, real-time amplification plot done to determine cycle threshold values (intersect at horizontal line) using serial 4-fold dilutions of human genomic DNA (2-2,048 pg) mixed with 60 ng of mouse genomic DNA. B, standard curve created using triplicate measurements for each dilution and calculated using the threshold cycles indicated in (A). C, dissociation curves of the human-specific Alu sequence amplicons.
As previously described (1, 2), M4A4 cells developed a considerable pulmonary metastatic load in the host lungs. The restoration of DLC-1 expression in M4A4 cells to levels equivalent to that of NM2C5 cells resulted in significant inhibition of pulmonary colonization in athymic mice (Fig. 2). Further studies are required to monitor whether DLC-1 expression affects M4A4 cell behavior at multiple points of the metastatic cascade, but the efficiency of lung colonization of cells disseminating from M4A4-DLC1 primary tumors was reduced to levels ∼25% of M4A4. Qualitative histologic examination of additional host mice showed that M4A4-DLC1 cells were still capable of forming metastases and that the actual metastases formed by M4A4-DLC1 cells were similar in structure to those formed by M4A4 cells (Fig. 3), but were generally smaller and less abundant. Alu-PCR analysis also detected a low steady-state level of NM2C5 cells in host lung tissue extracts. This was expected as we have previously shown that NM2C5 cells can reach the host lung and remain dormant in this secondary organ for up to 6 months (2).
Figure 2.

Quantification of human DNA in murine lung tissue by real-time PCR of Alu sequences. At an experimental end point of primary tumor size, lungs of five or six mice inoculated with the indicated cell lines were homogenized and DNA was extracted. Human Alu sequence—specific quantitative PCR was done in triplicate for each lung as indicated in Materials and Methods. Columns, means; bars, SE. A one-way ANOVA was used to calculate the overall P value (P = 0.001) for comparisons between all four groups. The Newman-Keuls posttest was used for individual comparisons, as indicated. M4A4-DLC1, M4A4 cells were stably transduced with DLC-1. M4A4-neo, M4A4 cells were transduced with appropriate vector only.
Figure 3.
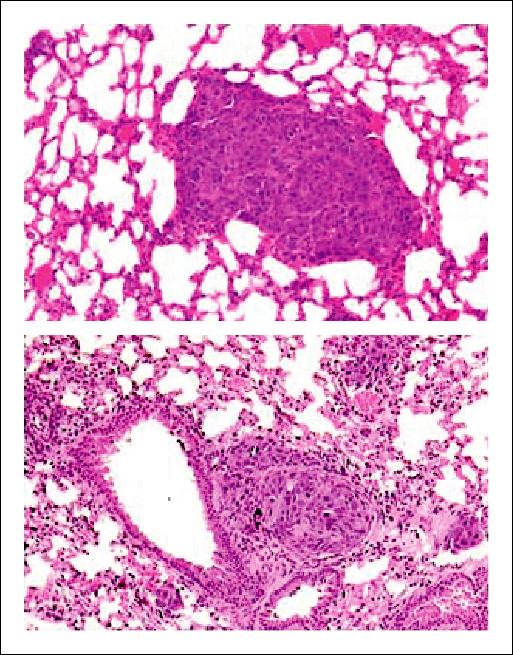
Examples of pulmonary metastases resulting from inoculation of breast tumor cell lines into the mammary fat pad of athymic mice. Representative histologic sections of metastases composed of M4A4 cells (top) and M4A4-DLC1 cells (bottom) are shown. Magnification, ×100.
In vitro cell invasion and migration. Rho protein family members have been shown to be involved in a variety of cellular functions, including the regulation of cell actin cytoskeleton organization, an essential factor in cellular functions (13, 14). To determine whether DLC-1 had an effect on the invasive and migratory abilities of M4A4 cells, evaluations using the modified Boyden chamber assay (30) were done. Whereas the ability of M4A4 and NM2C5 cells to migrate across an uncoated porous membrane (8 μm pores) was equal (Fig. 4A), in agreement with our previous studies (6) we found that M4A4 cells were significantly more able than NM2C5 cells to invade through Matrigel toward a serum chemoattractant (P = 0.0015; Fig. 4B). Restoration of DLC-1 expression in M4A4-DLC1 cells to NM2C5 levels had a significant effect on their invasive ability. Invasion of M4A4-DLC1 cells was reduced ∼4-fold relative to M4A4 cells (P = 0.0006) and to M4A4-neo cells (P = 0.0175; Fig. 4B). However, the migratory activity of M4A4-DLC1 cells was also perturbed; M4A4-DLC1 cells were significantly (P < 0.001) less motile than the M4A4, M4A4-neo, or NM2C5 cell lines (Fig. 4A).
Figure 4.

Influence of DLC-1 expression on the migration and invasion of M4A4 cells. A, the rate of cell migration was assessed by induction of movement toward serum through an uncoated membrane in a modified Boyden chamber assay. B, cell invasiveness was assessed by the movement toward serum through Matrigel-coated membranes. Columns, means of triplicate determinations for each experiment; bars, SE. A one-way ANOVA was used to calculate the overall P value for comparisons between all four groups. The Newman-Keuls posttest was used for individual comparisons, as indicated. M4A4-DLC1, M4A4 cells stably transduced with DLC1. M4A4-neo, M4A4 cells were transduced with appropriate vector only.
Global gene expression changes associated with DLC-1 expression. Having established a role for DLC-1 in the metastatic efficiency of M4A4 cells, we examined whether the up-regulation of DLC-1 by ectopic expression affected other genes at the transcriptional level by querying the global gene expression profile of the transductants and comparing them with unmanipulated M4A4 cells. Relative to M4A4, those genes that were differentially expressed in M4A4-DLC1 cells, but not in M4A4-neo, were deemed to be directly affected by DLC-1 expression. Applying the same criteria used in the profiling analyses described above, 19 genes were significantly and specifically up-regulated in M4A4-DLC1 cells (Table 1). Notably, none were significantly down-regulated. As expected, DLC-1 expression was measured at 3.6-fold over M4A4 cells by microarray analysis. Three of the nineteen up-regulated genes were transcription factors and all belonged to the basic leucine zipper (bZIP) family of factors. Of the genes listed in Table 1, thrombospondin 2 (TSP2) may be of particular interest. Like its counterpart TSP1, which is highly expressed in NM2C5 cells, TSP2 inhibits tumor growth through multiple effects, including inhibition of angiogenesis (31, 32); thus, it is conceivable that the ability of M4A4 cells to thrive in murine lung tissue is reduced by the induced expression of this gene. However, it is notable that the rate of formation of primary tumors resulting from inoculation of M4A4-DLC1 cells was not significantly different to that of nontransduced M4A4 cells so it is unlikely that any inhibitory effect is due to a direct influence on angiogenesis. The potential role of the thrombospondin family in the metastatic sufficiency of this model will be included into our ongoing investigations into the mechanisms of DLC1-induced phenotypic changes. Increased DLC-1 expression also induced the expression of two of the genes previously shown to be up-regulated in NM2C5 cells relative to M4A4 cells. The DNA damage—inducible transcript 4 (RTP80) and scrapie responsive protein 1 (SCRG1) genes were restored to levels similar to those observed in NM2C5 cells. Through such analyses, we can begin to understand the hierarchy of gene regulation networks in this model.
Discussion
The development of tumor metastases requires that a cancer cell must complete a series of steps involving complex interactions between tumor cells and various cells and tissues of the host (33, 34). Accordingly, metastasis is an inherently inefficient process. Studies using in vivo video microscopy techniques have quantified the fate of tumor cells during the metastatic process and have shown that metastatic inefficiency is due primarily to the regulation of metastatic colonization, the latter phase of metastasis (35, 36). After cells have arrested in an organ, molecular interactions between the cancer cells and the new organ can markedly change the gene expression patterns of cancer cells, and therefore their behavior and ability to grow (37, 38). Our previous finding that solitary NM2C5 tumor cells do disseminate, persist for extended periods of time in distal organs, but fail to initiate cell division, revealed that the fundamental phenotypic difference between the pair of cell lines in our metastasis model consists of the ability to merely survive, or to thrive in a secondary host organ (2).
This study shows that the metastatic phenotype of the M4A4 cell line is accompanied by profound changes in gene expression. According to the microarray hybridization data, those genes identified as being significantly differentially expressed in M4A4 cells represent ∼2.5% of all genes expressed. Functional assignment based on literature review revealed that many of the differentially expressed genes belong to gene families or pathways previously implicated in tumor progression and metastasis (39, 40). Included were cell cycle regulators and DNA-binding factors that may drive or facilitate cell proliferation; specific and generic transcriptional regulators; and proteins that play a role in signal transduction, cell structure, and motility. GTPase signaling component genes, which regulate proliferation and cytoskeletal organization in response to extracellular factors (41), were well represented in the most highly ranked differentially expressed genes. Because GTPase signaling pathways have been implicated in tumor growth and progression, we chose to genetically manipulate a differentially expressed RhoGAP gene, DLC-1, in the model.
We aimed to derive M4A4 transductants that had DLC-1 restored to levels similar to those observed in the nonmetastatic NM2C5 clone. This is an important consideration when comparing related studies (42) where levels of ectopic expression are often considerably higher than those expected in physiologic conditions. Interestingly, of the surviving antibiotic-selected, transduced M4A4 monoclonal lines, none had a significantly higher level of DLC-1 than that found in NM2C5 cells. In line with reports of a tumor cell inhibitory function (17-19), this suggests that there is a threshold at which DLC-1 expression levels completely inhibit the growth of MDA-MB-435 cells. As we wanted to test the metastatic capability of M4A4 transductants in a spontaneous metastasis assay, we selected only those that grew robustly in culture and were therefore less likely to compromise primary tumor growth. The restoration of DLC-1 significantly reduced the ability of M4A4 cells to colonize murine lungs in spontaneous metastasis assays, but did not alter tumorigenic ability at the primary site. Thus, DLC-1 can function as a metastasis-suppressor gene. Of several metastasis-suppressor genes identified to date, the majority affect the final outgrowth of tumor cells after they have arrived at a distant site, and all affect important signaling cascades (43, 44).
The influence of DLC-1 in M4A4 cells is consistent with previous observations in breast cancer. DLC-1 is often down-regulated or inactivated in breast primary tumors and breast tumor cell lines, and the restoration of its expression has been shown to significantly inhibit growth and tumorigenicity of cells derived from metastatic breast cancer (18, 45). Furthermore, DLC-1 has recently been confirmed as a highly significant breast cancer susceptibility gene in a large-scale human genomic screening (46). In a clonal model of experimental organ-specific metastasis, DLC-1 was found to be down-regulated in breast cell populations that were highly metastatic to bone (47). Moreover, DLC-2, a recently described isoform of DLC-1, is located on chromosome 13q12, a region of recurrent deletion and loss of heterozygosity in breast tumors, and this gene is also capable of inhibiting the proliferation of breast tumor cells in vitro (48, 49). However, this is the first time that DLC-1 has been shown to have an effect specifically on the growth of secondary, metastatic tumors.
Tumor cell growth at a metastatic site differs from that in the primary location through altered responsiveness to a new local microenvironment and stresses (37, 38). Thus, DLC-1 may play a role in sensing inhibitory signals present in the secondary organ that are not a factor in the primary site. A DLC-1—mediated negative regulatory effect on tumor cell proliferation is likely due to its ability to inactivate Rho-GTPase proteins that regulate many cellular functions in response to extracellular factors (41). DLC-1 has specific GTPase-activating protein functions for RhoA and Cdc42 (50), members of the Rho family that are consistently overexpressed in breast tumors (51). Evidence for the influence of GTPase signaling in tumor metastasis is growing. The expression of the RhoC molecule was identified as being correlated with metastatic propensity in an increasingly metastatic series of the melanoma A375 cell line derived by reculturing of metastatic deposits (42). Subsequent 20-fold overexpression of RhoC increased the metastatic efficiency of recipient cells in an experimental metastasis assay. Any perturbation of the regulatory cycle of GTPase activity regulation will have profound effects on cellular behavior. Seraj et al. (52) showed that there is an inverse relationship between the aggressiveness of bladder cancer cells and RhoGDI2 expression levels. RhoGDI2 is a Rho GTPase regulatory protein that binds and holds GDP bound Rho proteins in an inactive nonmembrane localized, cytoplasmic compartment. Hence, the inferred effect of decreased expression of a Rho GDI would be to provide increased access of Rho GEFs to the Rho GTPases and thus membrane localization, GTP loading, and activation (52), allowing the cells to become more invasive and/or metastatic. Furthermore, several guanine nucleotide exchange factors (GEF) have been identified as oncogenes because of their ability to up-regulate Rho GTPase activity during malignant transformation (15). Overexpression of the GEF Tiam1 (T-lymphoma invasion and metastasis 1) protein in SP-1 mouse breast adenocarcinoma cells induces Tiam1-ankyrin association in the cell membrane, Rac1 signaling, and metastatic phenotypes (53).
Our data indicate that DLC-1 has the capacity to function as a metastasis-suppressor gene. Further investigation of the pathways through which DLC-1 regulates signaling and subsequent phenotypic effects is required to identify subsets of genes that comprise the link between the sensing of the tissue microenvironment and proliferative regulation. The identification of the genes and biological pathways that contribute to metastatic efficiency will be of significant benefit for tumor classification and therapy.
Acknowledgments
The costs of publication of this article were defrayed in part by the payment of page charges. This article must therefore be hereby marked advertisement in accordance with 18 U.S.C. Section 1734 solely to indicate this fact.
Footnotes
B. Nicholson, S. Goodison, and V. Urquidi, unpublished data.
Note: Supplementary data for this article are available at Cancer Research Online (http://cancerres.aacrjournals.org/).
Requests for reprints: Steve Goodison, Department of Pathology, University of Florida Health Science Center, Shands Hospital, 655 West 8th Street, Jacksonville, FL 32209-6511. Phone: 904-244-4220; Fax: 904-244-4290; E-mail: steve.goodison@jax.ufl.edu.
Grant support: NIH grant CA RO1 108597 (S. Goodison) and Rebecca and John Moores Cancer Center Intramural Award (V. Urquidi).
References
- 1.Urquidi V, Sloan D, Kawai K, et al. Contrasting expression of thrombospondin-1 and osteopontin correlates with absence or presence of metastatic phenotype in an isogenic model of spontaneous human breast cancer metastasis. Clin Cancer Res. 2002;8:61–74. [PubMed] [Google Scholar]
- 2.Goodison S, Kawai K, Hihara J, et al. Prolonged dormancy and site-specific growth potential of cancer cells spontaneously disseminated from nonmetastatic breast tumors as revealed by labeling with green fluorescent protein. Clin Cancer Res. 2003;9:3808–14. [PubMed] [Google Scholar]
- 3.Cailleau R, Olive M, Cruciger QV. Long-term human breast carcinoma cell lines of metastatic origin: preliminary characterization. In Vitro. 1978;14:911–5. doi: 10.1007/BF02616120. [DOI] [PubMed] [Google Scholar]
- 4.Zhang RD, Fidler IJ, Price JE. Relative malignant potential of human breast carcinoma cell lines established from pleural effusions and a brain metastasis. Invasion Metastasis. 1991;11:204–15. [PubMed] [Google Scholar]
- 5.Goodison S, Viars C, Urquidi V. Molecular cytogenetic analysis of a human breast metastasis model: identification of phenotype-specific chromosomal rearrangements. Cancer Genet Cytogenet. 2005;156:37–48. doi: 10.1016/j.cancergencyto.2004.04.005. [DOI] [PubMed] [Google Scholar]
- 6.Agarwal D, Goodison S, Nicholson B, Tarin D, Urquidi V. Expression of matrix metalloproteinase 8 (MMP-8) and tyrosinase-related protein-1 (TYRP-1) correlates with the absence of metastasis in an isogenic human breast cancer model. Differentiation. 2003;71:114–25. doi: 10.1046/j.1432-0436.2003.710202.x. [DOI] [PubMed] [Google Scholar]
- 7.Sloan DD, Nicholson B, Urquidi V, Goodison S. Detection of differentially expressed genes in an isogenic breast metastasis model using RNA arbitrarily primed-polymerase chain reaction coupled with array hybridization (RAP-array) Am J Pathol. 2004;164:315–23. doi: 10.1016/S0002-9440(10)63121-5. [DOI] [PMC free article] [PubMed] [Google Scholar]
- 8.Kreunin P, Urquidi V, Lubman DM, Goodison S. Identification of metastasis-associated proteins in a human tumor metastasis model using the mass-mapping technique. Proteomic. 2004;4:2754–65. doi: 10.1002/pmic.200300767. [DOI] [PMC free article] [PubMed] [Google Scholar]
- 9.Li C, Wong WH. Model-based analysis of oligonucleotide arrays: expression index computation and outlier detection. Proc Natl Acad Sci U S A. 2001;98:31–6. doi: 10.1073/pnas.011404098. [DOI] [PMC free article] [PubMed] [Google Scholar]
- 10.Yuan BZ, Miller MJ, Keck CL, Zimonjic DB, Thorgeirsson SS, Popescu NC. Cloning, characterization, and chromosomal localization of a gene frequently deleted in human liver cancer (DLC-1) homologous to rat RhoGAP. Cancer Res. 1998;58:2196–9. [PubMed] [Google Scholar]
- 11.Homma Y, Emori Y. A dual functional signal mediator showing RhoGAP and phospholipase C-δ stimulating activities. EMBO J. 1995;14:286–91. doi: 10.1002/j.1460-2075.1995.tb07002.x. [DOI] [PMC free article] [PubMed] [Google Scholar]
- 12.Morii N, Kumagai N, Nur EKMS, Narumiya S, Maruta H. rho GAP of 28 kDa (GAP2), but not of 190 kDa (p190), requires Asp65 and Asp67 of rho GTPase for its activation. J Biol Chem. 1993;268:27160–3. [PubMed] [Google Scholar]
- 13.Clark EA, King WG, Brugge JS, Symons M, Hynes RO. Integrin-mediated signals regulated by members of the rho family of GTPases. J Cell Biol. 1998;142:573–86. doi: 10.1083/jcb.142.2.573. [DOI] [PMC free article] [PubMed] [Google Scholar]
- 14.Sekimata M, Kabuyama Y, Emori Y, Homma Y. Morphological changes and detachment of adherent cells induced by p122, a GTPase-activating protein for Rho. J Biol Chem. 1999;274:17757–62. doi: 10.1074/jbc.274.25.17757. [DOI] [PubMed] [Google Scholar]
- 15.Jaffe AB, Hall A. Rho GTPases in transformation and metastasis. Adv Cancer Res. 2002;84:57–80. doi: 10.1016/s0065-230x(02)84003-9. [DOI] [PubMed] [Google Scholar]
- 16.Lozano J, Xing R, Cai Z, et al. Deficiency of kinase suppressor of Ras1 prevents oncogenic ras signaling in mice. Cancer Res. 2003;63:4232–8. [PubMed] [Google Scholar]
- 17.Ng IO, Liang ZD, Cao L, Lee TK. DLC-1 is deleted in primary hepatocellular carcinoma and exerts inhibitory effects on the proliferation of hepatoma cell lines with deleted DLC-1. Cancer Res. 2000;60:6581–4. [PubMed] [Google Scholar]
- 18.Yuan BZ, Zhou X, Durkin ME, et al. DLC-1 gene inhibits human breast cancer cell growth and in vivo tumorigenicity. Oncogene. 2003;22:445–50. doi: 10.1038/sj.onc.1206064. [DOI] [PubMed] [Google Scholar]
- 19.Zhou X, Thorgeirsson SS, Popescu NC. Restoration of DLC-1 gene expression induces apoptosis and inhibits both cell growth and tumorigenicity in human hepato-cellular carcinoma cells. Oncogene. 2004;23:1308–13. doi: 10.1038/sj.onc.1207246. [DOI] [PubMed] [Google Scholar]
- 20.Stuart RO, Wachsman W, Berry CC, et al. In silico dissection of cell-type-associated patterns of gene expression in prostate cancer. Proc Natl Acad Sci U S A. 2004;101:615–20. doi: 10.1073/pnas.2536479100. [DOI] [PMC free article] [PubMed] [Google Scholar]
- 21.Li C, Wong WH. Springer; New York: 2003. DNA-Chip Analyzer (dChip). In: Zeger SL, editor. The analysis of gene expression data: methods and software. [Google Scholar]
- 22.Goodison S, Viars C, Grazzini M, Urquidi V. The interrelationship between DRIM gene expression and cytogenetic and phenotypic characteristics in human breast tumor cell lines. BMC Genomics. 2003;4:39. doi: 10.1186/1471-2164-4-39. [DOI] [PMC free article] [PubMed] [Google Scholar]
- 23.Wang-Rodriguez J, Urquidi V, Rivard A, Goodison S. Elevated osteopontin and thrombospondin expression identifies malignant human breast carcinoma but is not indicative of metastatic status. Breast Cancer Res. 2003;5:R136–43. doi: 10.1186/bcr620. [DOI] [PMC free article] [PubMed] [Google Scholar]
- 24.Schneider T, Osl F, Friess T, Stockinger H, Scheuer WV. Quantification of human Alu sequences by real-time PCR—an improved method to measure therapeutic efficacy of anti-metastatic drugs in human xenotransplants. Clin Exp Metastasis. 2002;19:571–82. doi: 10.1023/a:1020992411420. [DOI] [PubMed] [Google Scholar]
- 25.Li TH, Schmid CW. Alu's dimeric consensus sequence destabilizes its transcripts. Gene. 2004;324:191–200. doi: 10.1016/j.gene.2003.09.036. [DOI] [PubMed] [Google Scholar]
- 26.Schmid CW. Does SINE evolution preclude Alu function? Nucleic Acids Res. 1998;26:4541–50. doi: 10.1093/nar/26.20.4541. [DOI] [PMC free article] [PubMed] [Google Scholar]
- 27.Weisberg TF, Cahill BK, Vary CP. Non-radioisotopic detection of human xenogeneic DNA in a mouse transplantation model. Mol Cell Probes. 1996;10:139–46. doi: 10.1006/mcpr.1996.0019. [DOI] [PubMed] [Google Scholar]
- 28.Kim J, Yu W, Kovalski K, Ossowski L. Requirement for specific proteases in cancer cell intravasation as revealed by a novel semiquantitative PCR-based assay. Cell. 1998;94:353–62. doi: 10.1016/s0092-8674(00)81478-6. [DOI] [PubMed] [Google Scholar]
- 29.Zijlstra A, Mellor R, Panzarella G, et al. A quantitative analysis of rate-limiting steps in the metastatic cascade using human-specific real-time polymerase chain reaction. Cancer Res. 2002;62:7083–92. [PubMed] [Google Scholar]
- 30.Albini A, Iwamoto Y, Kleinman HK, et al. A rapid in vitro assay for quantitating the invasive potential of tumor cells. Cancer Res. 1987;47:3239–45. [PubMed] [Google Scholar]
- 31.Hahn W, Ho SH, Jeong JG, et al. Gene Ther. 2004;11:Viral vector-mediated transduction of a modified thrombospondin-2 cDNA inhibits tumor growth and angiogenesis, 739–45. doi: 10.1038/sj.gt.3302219. [DOI] [PubMed] [Google Scholar]
- 32.Noh YH, Matsuda K, Hong YK, et al. An N-terminal 80 kDa recombinant fragment of human thrombospondin-2 inhibits vascular endothelial growth factor induced endothelial cell migration in vitro and tumor growth and angiogenesis in vivo. J Invest Dermatol. 2003;121:1536–43. doi: 10.1046/j.1523-1747.2003.12643.x. [DOI] [PubMed] [Google Scholar]
- 33.Fidler IJ. Host and tumour factors in cancer metastasis. Critical factors in the biology of human cancer metastasis: twenty-eighth G.H.A. Clowes memorial award lecture. Eur J Clin Invest. 1990;20:481–6. [PubMed] [Google Scholar]
- 34.Nicolson GL. Organ specificity of tumor metastasis: role of preferential adhesion, invasion and growth of malignant cells at specific secondary sites. Cancer Metastasis Rev. 1988;7:143–88. doi: 10.1007/BF00046483. [DOI] [PubMed] [Google Scholar]
- 35.Luzzi KJ, MacDonald IC, Schmidt EE, et al. Multistep nature of metastatic inefficiency: dormancy of solitary cells after successful extravasation and limited survival of early micrometastases. Am J Pathol. 1998;153:865–73. doi: 10.1016/S0002-9440(10)65628-3. [DOI] [PMC free article] [PubMed] [Google Scholar]
- 36.Chambers AF, Groom AC, MacDonald IC. Dissemination and growth of cancer cells in metastatic sites. Nat Rev Cancer. 2002;2:563–72. doi: 10.1038/nrc865. [DOI] [PubMed] [Google Scholar]
- 37.Nakajima M, Morikawa K, Fabra A, Bucana CD, Fidler IJ. Influence of organ environment on extracellular matrix degradative activity and metastasis of human colon carcinoma cells. J Natl Cancer Inst. 1990;82:1890–8. doi: 10.1093/jnci/82.24.1890. [DOI] [PubMed] [Google Scholar]
- 38.Gohji K, Nakajima M, Boyd D, et al. Organ-site dependence for the production of urokinase-type plasminogen activator and metastasis by human renal cell carcinoma cells. Am J Pathol. 1997;151:1655–61. [PMC free article] [PubMed] [Google Scholar]
- 39.Tuck AB, Arsenault DM, O'Malley FP, et al. Osteopontin induces increased invasiveness and plasminogen activator expression of human mammary epithelial cells. Oncogene. 1999;18:4237–46. doi: 10.1038/sj.onc.1202799. [DOI] [PubMed] [Google Scholar]
- 40.Volpert OV, Lawler J, Bouck NP. A human fibrosarcoma inhibits systemic angiogenesis and the growth of experimental metastases via thrombospondin-1. Proc Natl Acad Sci U S A. 1998;95:6343–8. doi: 10.1073/pnas.95.11.6343. [DOI] [PMC free article] [PubMed] [Google Scholar]
- 41.Schmitz AA, Govek EE, Bottner B, Van Aelst L. Rho GTPases: signaling, migration, and invasion. Exp Cell Res. 2000;261:1–12. doi: 10.1006/excr.2000.5049. [DOI] [PubMed] [Google Scholar]
- 42.Clark EA, Golub TR, Lander ES, Hynes RO. Genomic analysis of metastasis reveals an essential role for RhoC. Nature. 2000;406:532–5. doi: 10.1038/35020106. [DOI] [PubMed] [Google Scholar]
- 43.Welch DR, Steeg PS, Rinker-Schaeffer CW. Molecular biology of breast cancer metastasis. Genetic regulation of human breast carcinoma metastasis. Breast Cancer Res. 2000;2:408–16. doi: 10.1186/bcr87. [DOI] [PMC free article] [PubMed] [Google Scholar]
- 44.Steeg PS. Metastasis suppressors alter the signal transduction of cancer cells. Nat Rev Cancer. 2003;3:55–63. doi: 10.1038/nrc967. [DOI] [PubMed] [Google Scholar]
- 45.Plaumann M, Seitz S, Frege R, Estevez-Schwarz L, Scherneck S. Analysis of DLC-1 expression in human breast cancer. J Cancer Res Clin Oncol. 2003;129:349–54. doi: 10.1007/s00432-003-0440-z. [DOI] [PubMed] [Google Scholar]
- 46.Tang K, Oeth P, Kammerer S, et al. Mining disease susceptibility genes through SNP analyses and expression profiling using MALDI-TOF mass spectrometry. J Proteome Res. 2004;3:218–27. doi: 10.1021/pr034080s. [DOI] [PubMed] [Google Scholar]
- 47.Kang Y, Siegel PM, Shu W, et al. A multigenic program mediating breast cancer metastasis to bone. Cancer Cell. 2003;3:537–49. doi: 10.1016/s1535-6108(03)00132-6. [DOI] [PubMed] [Google Scholar]
- 48.Ching YP, Wong CM, Chan SF, et al. Deleted in liver cancer (DLC) 2 encodes a RhoGAP protein with growth suppressor function and is underexpressed in hepatocellular carcinoma. J Biol Chem. 2003;278:10824–30. doi: 10.1074/jbc.M208310200. [DOI] [PubMed] [Google Scholar]
- 49.Nagaraja GM, Kandpal RP. Chromosome 13q12 encoded Rho GTPase activating protein suppresses growth of breast carcinoma cells, and yeast two-hybrid screen shows its interaction with several proteins. Biochem Biophys Res Commun. 2004;313:654–65. doi: 10.1016/j.bbrc.2003.12.001. [DOI] [PubMed] [Google Scholar]
- 50.Wong CM, Lee JM, Ching YP, Jin DY, Ng IO. Genetic and epigenetic alterations of DLC-1 gene in hepatocellular carcinoma. Cancer Res. 2003;63:7646–51. [PubMed] [Google Scholar]
- 51.Fritz G, Just I, Kaina B. Rho GTPases are over-expressed in human tumors. Int J Cancer. 1999;81:682–7. doi: 10.1002/(sici)1097-0215(19990531)81:5<682::aid-ijc2>3.0.co;2-b. [DOI] [PubMed] [Google Scholar]
- 52.Seraj MJ, Harding MA, Gildea JJ, Welch DR, Theodorescu D. The relationship of BRMS1 and RhoGDI2 gene expression to metastatic potential in lineage related human bladder cancer cell lines. Clin Exp Metastasis. 2000;18:519–25. doi: 10.1023/a:1011819621859. [DOI] [PubMed] [Google Scholar]
- 53.Bourguignon LY, Zhu H, Shao L, Chen YW. Ankyrin-Tiam1 interaction promotes Rac1 signaling and metastatic breast tumor cell invasion and migration. J Cell Biol. 2000;150:177–91. doi: 10.1083/jcb.150.1.177. [DOI] [PMC free article] [PubMed] [Google Scholar]