

Abstract
Runx2 transcribes Runx2-II and Runx2-I isoforms with distinct N-termini. Deletion of both isoforms results in complete arrest of bone development, whereas selective loss of Runx2-II is sufficient to form a grossly intact skeleton with impaired endochondral bone development. To elucidate the role of Runx2-II in osteoblast function in adult mice, we examined heterozygous Runx2-II (Runx2-II+/−) and homozygous Runx2-II (Runx2-II−/−)-deficient mice, which, respectively, lack one or both copies of Runx2-II but intact Runx2-I expression. Compared to wild-type mice, 6-week-old Runx2-II+/− had reduced trabecular bone volume (BV/TV%), cortical thickness (Ct.Th), and bone mineral density (BMD), decreased osteoblastic and osteoclastic markers, lower bone formation rates, impaired osteoblast maturation of BMSCs in vitro, and significant reductions in mechanical properties. Homozygous Runx2-II−/− mice had a more severe reduction in BMD, BV/TV%, and Ct.Th, and greater suppression of osteoblastic and osteoclastic markers than Runx2-II+/− mice. Non-selective Runx2+/− mice, which have an equivalent reduction in Runx2 expression due to the lack one copy of Runx2-I and II, however, had an intermediate reduction in BMD. Thus, selective Runx2-II mutation causes diminished osteoblastic function in an adult mouse leading to low-turnover osteopenia and suggest that Runx2-I and II have distinct functions imparted by their different N-termini.
Keywords: Runx2-II, Knockout, Osteopenia, Osteoblast, Osteoclast, Hypertrophic chondrocyte, Trabecular bone, Cortical bone, Remodeling, Mouse
Introduction
Runx2 is a master gene regulating bone development. The Runx2 gene produces two major transcripts driven by alternative promoters designated P1 and P2, respectively (Fig. 1). Runx2 Type I (Runx2-I) is derived from the P2 proximal promoter and begins with the sequence MRIPV encoded by Exon 2. Runx2 Type II (Runx2-II, formerly called Osf2) is controlled by the P1 distal promoter and begins with MASNS encoded by exon 1 (Ducy et al., 1997; Harada et al., 1999). Thus, there are 4 alleles that generate two distinct gene products, Runx2-I and Runx2-II, which differ only by the amino acids at their N-terminal regions (Fig. 1) (Banerjee et al., 2001; Xiao et al., 1999). Homozygous Runx2 null mice (derived from inactivating mutations affecting all four alleles) results in arrested bone formation and the complete lack of all mineralized skeletal elements due to the absence of osteoblastic differentiation (Komori et al., 1997; Otto et al., 1997). Haploinsufficiency of both Runx2-I and Runx2-II gene products causes cleidocranial dysplasia (CCD), an autosomal dominant disorder characterized by defective bone formation (Choi et al., 2001; Mundlos et al., 1997; Nakashima and de Crombrugghe, 2003). Hypomorphic mutations of Runx2 also have been described that result in mild CCD or dental phenotype characterized by delayed eruption of permanent teeth (Zhou et al., 1999).
Fig. 1.

Diagrams of Runx2 alleles and gene products in non-selective Runx2 and selective Runx2-II-deficient mice. (A) Heterozygous Runx2+/− mice have one copy of wild-type Runx2 alleles predicted to generate 1/2 of the normal Runx2-I and Runx2-II gene products. (B) Homozygous Runx2−/− mice have neither wild-type Runx2 alleles nor Runx2-I and Runx2-II gene products. (C) Heterozygous Runx2-II+/− mice have one wild-type Runx2 allele and one Runx2-II mutant allele. These mice should express normal amounts of Runx2-I and 1/2 the amount of Runx2-II gene products. (D) Homozygous Runx2-II−/− mice have two mutant Runx2-II alleles predicted to produce normal amounts of Runx2-I but no Runx2-II gene products. P1 or P2 designates the promoter regions for Runx2-II or Runx2-I, respectively.
The separate functions of Runx2-I and -II in vivo are not clearly understood. Several observations, however, support the possibility that Runx2-I and -II have distinct functions. These include different expression patterns (Choi et al., 2002; Park et al., 2001), response to hormones and growth factors (Banerjee et al., 2001), and evidence for differential transactivation potential of the N-termini in cell culture models (Harada et al., 1999; Xiao et al., 1999). Runx2-II, previously called Osf2, is widely believed to be the “osteoblast-specific” isoform (Ducy et al., 1997). We previously developed a selective Runx2-II knockout mouse model to characterize its role in skeletogenesis. These studies, which were limited to newborn mice, found that selective deletion of the Runx2-II isoform resulted in a less severe skeletal phenotype compared to deletion of both isoforms, indicating that Runx2-I was sufficient for gross skeletal development. Whereas combined Runx2-I and -II null mice completely lacked a mineralized skeleton, the selective Runx2-II null mice formed an intact mineralized skeleton, but displayed a greater impairment of endochondral bone development compared to intramembranous and cortical bone formation (Xiao et al., 2004). Mice with selective deletion of Runx2-II also had improved survival compared to the deletion of both isoforms, thereby allowing assessment of the post-natal effects of selective Runx2-II deficiency.
In the present study, we characterized the impact of selective Runx2-II deficiency on osteoblast function in adult bone. We examined bone mineral density (BMD), microcomputed tomography (CT), and 3-point bending biomechanical testing of femurs as well-assessed biochemical markers, gene-expression profiles, bone histology, and bone marrow stromal cell (BMSC) cultures in wild-type (Runx2-II+/+) and Runx2-II heterozygous (Runx2-II+/−) mice for up to 24 weeks of age.
Materials and methods
Animals
Selective Runx2-II mutant mice (129SVJ and C57BL/6 mixed background), lacking the type II isoform, but with intact Type I isoform (Figs. 1C, D), were produced as previously described (Xiao et al., 2004). Heterozygous, homozygous Runx2-II mutant mice and wild-type littermates were generated by mating F2 heterozygous Runx2-II mutant mice. Less than 10% of Runx2-II−/− mice survived past 6 weeks, from which six were selected for evaluation. We used 40 wild-type and 100 Runx2-II+/− mice in these studies. In addition, we examined the bone mineral density in heterozygote non-selective Runx2 mutant mice, lacking one copy of both Type I and Type II isoform (Figs. 1A, B). These mice were obtained from Dr. Gerard Karsenty (Otto et al., 1997). Heterozygous non-selective Runx2 mutant mice (Runx2+/−) and wild-type littermates were generated by mating heterozygous Runx2 mutant mice.
Bone densitometry, skeletal radiography, and nondecalcified bone histological preparations
Bone mineral density (BMD) of whole femurs and lumbar spines were assessed at 6, 12, and 24 weeks of age using a PIXImus™ bone densitometer (Lunar Corp., Madison, Wisconsin, USA) as previously described (Tu et al., 2003). Six-week-old mice were radiographed using a Hewlett-Packard Faxitron 43807 and X-Omat film. Skeletons of mice were prelabeled with tetracycline hydrochloride (Sigma T-7660, 30 μg/g body weight) and calcein (Sigma C-0875, 30 μg/g body weight) by intraperitoneal injection at days 1 and 5 in 6- and 24-week-olds prior to collection of tibias. Tibias were removed from 6- and 24-week-old mice, fixed in 70% ethanol, prestained in Villanueva stain and processed for methyl methacrylate embedding. Five-μm sections were stained with Goldner’s stain and analyzed under transmitted light, and 10-μm Villanueva prestained sections were evaluated under fluorescent light as reported previously by our laboratory (Tu et al., 2003).
Micro-CT analysis
The distal femoral metaphyses were scanned using a μCT 40 (Scanco Medical AG, Bassersdorf, Switzerland); 167 slices of the metaphyses under the growth plate, constituting 1.0 mm in length, were selected. The three-dimensional (3D) images were generated using the following values for a gauss filter (sigma 0.8, support 1) and a threshold of 275. A 3D image analysis was performed to determine bone volume (BV/TV), trabecular number (Tb.N), trabecular thickness (Tb.Th), and trabecular separation (Tb.Sp). Cortical bone was measured on the mid-shaft region of cortical bone in 50 slices of the diaphysis, constituting 0.3 mm in length. The mean cortical thickness (Ct.Th) was determined at 8 different points on the cortical slice.
Serum biochemical measurements
Serum osteocalcin levels were measured using a mouse osteocalcin EIA kit (Biomedical Technologies Inc., Stoughton, MA, USA). Serum Calcium (Ca) was measured by the colorimetric cresolphthalein binding method, and phosphorus (P) was measured by the phosphomolybdate–ascorbic acid method (Tu et al., 2003). Serum osteoprotegerin (OPG) and RANK ligand (RANK-L) were measured using mouse ELISA kits (Quantikine®, R&D systems), and serum TRAP was assayed with the ELISA-based SBA Sciences mouseTRAP™ assay (Suomen Bioanalytiikka Oy).
Alkaline phosphatase activity and mineralization assays in bone marrow stromal cell cultures
Bone marrow stromal cells from 6- or 24-week-old mice were prepared as previously described (Xiao et al., 2001). The adherent cells (representing bone mesenchymal stem cells, BMSCs) were grown for periods of up to 12 days in the differentiation medium (α-MEM containing 10% v/v FBS supplemented with 5 mM β-glycerophosphate and 25 μg/ml of ascorbic acid) for inducing osteoblastic differentiation of BMSCs. Alkaline phosphatase (ALP) activity and Alizarin Red-S histochemical staining for mineralization were performed as previously described (Xiao et al., 1998). For quantification of mineralization, Alizarin Red-S was extracted with 10% cetylpyridinium chloride and assessed at 562 nm. Total DNA content was measured with a PicoGreen® dsDNA quantitation reagent and kit (Molecular Probes, Eugene, OR).
Real-time RT-PCR
For quantitative real-time RT-PCR, 2.0 μg total RNA isolated from long bone of 6- and 24-week-old mice was reverse transcribed as described (Xiao et al., 2003). PCR reactions contained 100 ng template (cDNA or RNA), 300 nM each forward and reverse primer and 1X iQ™ SYBR® Green Supermix (Bio-Rad, Hercules, CA) in 50 μl. Samples were amplified for 40 cycles in an iCycler iQ™ Real-Time PCR Detection System with an initial melt at 95°C for 10 min followed by 40 cycles of 95°C for 15 s and 60°C for 1 min. PCR product accumulation was monitored at multiple points during each cycle by measuring the increase in fluorescence caused by the binding of SybrGreen I to dsDNA. The threshold cycle (Ct) of tested-gene product from the indicated genotype was normalized to the Ct for cyclophilin A.
Biomechanical testing
Femurs were dissected and cleaned from muscle and soft tissue attachments, and then frozen at −20°C until testing. On the day of testing, the bones were thawed and rehydrated with PBS for 3 h. Bending tests were performed using a three-point fixture on an electromechanical testing system (ELF 3200, EnduraTEC, Inc., and Minnetonka, MN). The bones were flexed in the anterior–posterior plane by displacing the loading point fixture at 5 mm/min until failure (Silva and Ulrich, 2000). Bending force–deflection curves were constructed and analyzed for stiffness (S) and maximum force to failure ( Fmax). The flexural rigidity (EI) was calculated from the classical equations of beam theory for a simply-supported beam with a central concentrated load.
Statistical analysis
We evaluated differences among the three groups (for instance, wild-type, heterozygous and homozygous Runx2-II-deficient mice) by one-way analysis of variance when there was no potential for a time effect, i.e., when all three of the groups were measured at one time point. If the global test was significant, pairwise comparisons were performed using Tukey’s HSD method. Variables for which we measured in the two groups (for instance, wild-type, heterozygous Runx2-II or Runx2-deficient mice) over time were compared using a two-way analysis of variance with interaction. We found no significant interactions between group and time for any analysis. If global main effects were seen for either time or group, we performed pairwise comparisons using Tukey’s HSD method. All values are expressed as means ± SEM. All computations were performed using the Statgraphic statistical graphics system (STSC Inc.) or SAS 9.1.
Results
Gross appearance and survival rate
The survival of hetereozygous Runx2-II+/− mice was not different from wild-type littermates and they had no gross skeletal abnormalities by X-ray analysis, whereas homozygous Runx2-II−/− mice had marked growth retardation and dwarfism (data not shown), as previously reported in newborn mice (Xiao et al., 2004).
Bone mineral density
Wild-type (Runx2-II+/+) mice exhibited an age-associated increase in femoral (0.061 ± 0.001, 0.077 ± 0.001, 0.086 ± 0.001 g/cm2, Fig. 2A) and lumbar spine (0.061 ± 0.001, 0.073 ± 0.001, 0.075 ± 0.001 g/cm2, Fig. 2B) BMD at 6, 12, and 24 weeks, respectively. Runx2-II+/− mice, which are deficient in only one copy of Runx2-II (Fig. 1C), also displayed an age-dependent increase in BMD, but demonstrated a significant reduction in both femoral and lumbar spine BMD compared to wild-type mice at all time points (Figs. 2A, B). Bone loss in Runx2-II+/− mice was greater in lumbar spine, which is predominately trabecular bone, than the femur, which is a mixture of trabecular and cortical bone. Six-week-old Runx2-II null mice, which lack both copies of Runx2-II but retain both copies of Runx2-I (Fig. 1D), had a more severe reduction in both femoral (39%) and lumbar spine (34%) BMD compared to heterozygous Runx2+/− mice, consistent with a dose-dependent effect of Runx2-II in regulating bone mineral density.
Fig. 2.

Effects of genotype and age on bone mineral density (BMD). (A, B) BMD of femur and spine in selective Runx2-II-deficient mice. (C, D) BMD of femur and spine in non-selective Runx2-deficient mice. BMD analysis of the femoral and lumbar spine was assessed by the PIXImus™ mouse densitometer at 6-, 12-, and 24-week-old in Runx2-II+/+, selective Runx2-II+/−, Runx2-II−/−, and non-selective Runx2+/+, Runx2+/−, Runx2−/− mice. Reductions in both femoral and lumbar spine BMD were greater in 6-week-old Runx2-II null mice compared to heterozygous selective Runx2-II+/− and non-selective Runx2+/− mice. Wild-type mice from non-selective Runx2-deficient strain have a lower BMD compared to wild-type mice used in the proceeding analysis, likely due to the fact that that they are derived from a different genetic background. Data represent the mean ± SEM. *Difference from wild-type Runx2-II+/+ mice; #difference from heterozygous Runx2-II+/− mice at P values specified below the bar graft at each time point. The time-dependent increments in BMD at 6, 12, and 24 weeks were also significantly different (as indicated by brackets above the bar graphs).
To further define the role of Runx2-I and -II isoforms and gene dosage, we determine the effects of loss of both Runx2-I and -II isoforms (Fig. 1A) on BMD using the originally described heterozygous Runx2+/− mice created by disruption of the common Runx binding domain (Otto et al., 1997). Compared with their wild-type littermates, heterozygous Runx2 mutant mice, which lack one copy of Runx2-I and -II (Fig. 1A), exhibited a 13% reduction in femoral BMD (0.0455 ± 0.001 vs. 0.0524 ± 0.001 g/cm2, Fig. 2C) and a 14% reduction in lumbar spine BMD (0.04210 ± 0.001 vs. 0.0491 ± 0.001 g/cm2, Fig. 2D). The loss of one copy of both Runx2-I and -II in the femur resulted in a phenotype intermediate to that of Runx2-II−/− and Runx2-II+/− mice (vide supra), indicating that a 50% reduction in Runx2 from the loss of both copies of the Type II isoform leads to a greater degree of osteopenia than a equivalent reduction caused by loss of one copy each of the Type I and II isoforms (Figs. 2A and C). Comparison of the heterozygous selective Runx2-deficient and the original Runx2-deficient mice also revealed site-specific differences in bone loss. In this regard, bone loss in the lumbar spine was equivalent regardless of whether mice lost one copy of Runx2-II (Runx2-II+/−) or one copy each of Runx2-I and Runx2-II (Figs. 2B and D).
μCT evaluation
μCT analysis was performed to further determine the relative contribution of cortical and trabecular bone to these changes in femoral BMD. Wild-type (Runx2-II+/+) mice displayed an age-dependent reduction in trabecular bone volume and an age-dependent increase in cortical bone thickness of the femur (Table 1). In 6-week-old Runx2-II-deficient mice, we observed a gene-dose-dependent reduction in BV/TV%, Tb.N, Tb.Th, and Ct.Th (Fig. 3 and Table 1) as evidenced by the more severe reductions in these parameters in 6-week-old homozygous Runx2-II mice compared to Runx2-II+/− mice (Table 1). At 24 weeks of age, Runx2-II+/− mice had persistent reductions in trabecular bone volume (30% vs. 34% in 6-week-old and 24-week-old Runx2-II+/− mice, respectively), but during this time, cortical bone thickness increased in both wild-type and Runx2-II+/− mice and attained levels that were no longer significantly different (Fig. 3 and Table 1). Thus, the loss of bone mass by BMD in 24-week-old Runx2-II+/− mice (Fig. 2) was predominantly due to loss of trabecular bone volume in the femoral metaphysis. These findings are consistent with our previous report of the selective preservation of cortical bone formation in Runx2-II-deficient mice (Xiao et al., 2004).
Table 1.
Micro-CT analysis of femurs in wild-type and mutant mice
| Genotype | Runx2-II+/+ | Runx2-II+/− | Runx2-II−/− |
|---|---|---|---|
| BV/TV (%) | |||
| 6 weeks | 21.2 ± 1.4 | 14.8 ± 1.4a (P = 0.0039) | 7.1 ± 1.4a,b (P = 0.0027) |
| 24 weeks | 14.5 ± 1.2c | 9.6 ± 1.3a,c (P = 0.0062) | – |
| (P < 0.0001) | (P < 0.0001) | ||
| Tb.N (mm−1) | |||
| 6 weeks | 6.44 ± 0.20 | 5.43 ± 0.21a (P = 0.0026) | 3.91 ± 0.26a,b (P = 0.0002) |
| 24 weeks | 4.65 ± 0.20c | 4.04 ± 0.21a,c (P = 0.0257) | – |
| (P = 0.0014) | (P = 0.0133) | ||
| Tb.Th (mm) | |||
| 6 weeks | 0.045 ± 0.001 | 0.041 ± 0.001a (P = 0.0333) | 0.035 ± 0.001a,b (P = 0.0343) |
| 24 weeks | 0.046 ± 0.002 | 0.041 ± 0.002a (P = 0.0050) | – |
| (P = 0.6158) | (P = 0.9855) | ||
| Tb.Sp (mm) | |||
| 6 weeks | 0.149 ± 0.010 | 0.184 ± 0.011a (P = 0.0280) | 0.266 ± 0.013a,b (P < 0.0001) |
| 24 weeks | 0.217 ± 0.011c | 0.254 ± 0.011a,c (P = 0.0090) | – |
| (P < 0.0001) | (P < 0.0001) | ||
| Ct.Th (mm) | |||
| 6 weeks | 0.18 ± 0.01 | 0.16 ± 0.01a (P = 0.0475) | 0.13 ± 0.01a,b (P < 0.0001) |
| 24 weeks | 0.241 ± 0.005c | 0.236 ± 0.005c (P = 0.4331) | – |
| (P < 0.0001) | (P < 0.0001) | ||
Data are mean ± SEM from 6 individual mice.
Significant difference from wild-type Runx2-II+/+ mice.
Significant difference from heterozygous Runx2-II+/− mice.
Difference between 6 and 24 weeks at the indicated P value using statistical analysis described in Materials and methods.
Fig. 3.

3D images of femurs in 6- and 24-week wild-type and mutant mice. 3D images of metaphyseal bone (upper panel) and cortical bone (lower panel) generated from μCT analysis. There was an age-dependent reduction in trabecular bone volume and an increase in cortical thickness in wild-type mice. The trabecular bone volume and cortical thickness was reduced in Runx2-II+/− and Runx2-II−/− mice proportionate to the reduction in gene dosage. Runx2-II+/− mice displayed an age-dependent decrease in trabecular bone and increase in cortical bone similar to wild-type mice.
Histology
To understand the cellular basis for these structural changes and to identify potential mechanisms responsible for the reduced bone mass in Runx2-II-deficient mice, we examined histological sections of the epiphyseal bone, growth plate, and metaphyseal bone of tibia of 6-week-old wild-type, heterozygous, and null mice (Figs. 4A, B). Heterozygous Runx2-II+/− mice displayed reduced trabecular bone volume and normal appearing growth plate as well as normal bone shape and length, consistent with the X-ray, BMD, and μCT structural analysis. Mineral apposition rates in trabecular bone of the metaphyseal region as assessed by dual fluorescent labeling were reduced; in contrast, mineralization on the periosteal and endosteal surfaces of cortical bone was preserved in Runx2-II+/−-deficient mice (Figs. 4C, D), suggesting that Runx2-II plays a more important function in trabecular bone compared to cortical bone. There were no demonstrable differences in osteoblastic and osteoclastic surfaces between wild-type and Runx2-II-deficient mice (data not shown). Homozygous Runx2-II−/− mice show a more marked reduction of trabecular bone volume, a widened growth plate consisting of increased zone of hypertrophic chondrocytes, and severe impairment of bone formation, as evidenced by no double labels in trabecular bone (Fig. 4C); however, osteoblast surfaces and mineral apposition rates in the periosteal and endosteal bone were preserved in Runx2-II null mice (Fig. 4D).
Fig. 4.
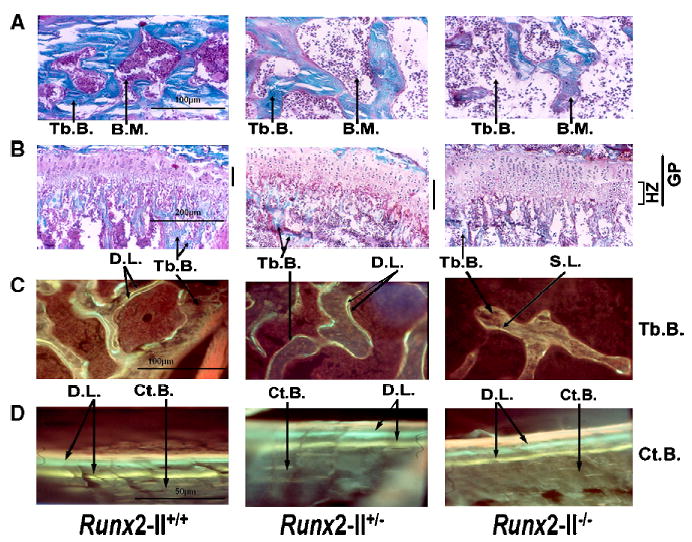
Nondecalcified histological sections of tibia bone in 6-week-old Runx2-II wild-type and mutant mice. (A, B) Goldner-stained sections of the epiphyseal bone (×200 magnification) and growth plate and metaphyseal bone (×100 magnification) of 6-week-old Runx2-II+/+, Runx2-II+/−, and Runx2-II−/− mice. Mineralized trabecular bone (Tb) is blue and unmineralized osteoid is reddish brown in color. (C, D) Villanueva-stained sections of trabecular (×200 magnification) and cortical bone (×400 magnification) viewed under fluorescent light in 6-week-old Runx2-II+/+, Runx2-II+/−, and Runx2-II−/− mice prelabeled with tetracycline followed by calcein (double label). Heterozygous Runx2-II+/− mice have reduced trabecular bone volume, normal appearing growth plate, and reduced bone formation rates. Homozygous Runx2-II−/− mice show a marked reduction of trabecular bone volume, a widened growth plate consisting of increased zone of hypertrophic chondrocytes, and severe impairment of bone formation as evidenced by a diffuse single label or unlabeled trabecular bone surfaces. In contrast, mineral apposition rates on the periosteal surfaces of cortical bone were preserved in both heterozygous Runx2-II+/− and homozygous Runx2-II−/− mice. Tb.B., trabecular bone, Ct.B., cortical bone, B.M., bone marrow, G.P., growth plate, H.Z., hypertrophic zone, D.L., double label, S.L., single label.
Biochemical bone markers and gene expression profiles
Wild-type Runx2-II+/+ mice had reduced osteoblastic and osteoclastic markers as a function of age, consistent with an age-dependent decrease in bone formation and resorption (Table 2). Selective Runx2-II deficiency resulted in a further reduction in osteoblast and osteoclast markers that was dependent upon gene dosage. In 6-week-old heterozygous Runx2-II+/− mice, RANK-L and TRAP were reduced compared to age-matched wild-type mice, whereas reductions in Osteocalcin were not observed until 24 weeks of age (Table 2). In 6-week-old Runx2-II−/− mice, Osteocalcin (107 ± 56 vs. 451 ± 51 ng/ml), TRAP (2.6 ± 0.49 vs. 4.5 ± 0.35 U/l), and RANK-L (28.3 ± 7.2 vs. 97.6 ± 5.1 pg/ml) were reduced compared with age-matched wild-type mice (Table 2). In addition, the RANK-L/OPG ratio, which is an indicator of osteoclastogenesis, was reduced by approximately 25% in heterozygous Runx2-II+/− mice and 70% in homozygous Runx2-II−/− mice compared to wild-type littermates, consistent with the reduction in osteoclastic markers (Table 2). These data suggest that the selective loss of Runx2-II results in diminished osteoblast and osteoclast function and consequent low-turnover osteopenia. The loss of Runx2-II had no effect on serum calcium and phosphorus levels at either 6 or 24 weeks (Table 2).
Table 2.
Biochemistry analysis of serum in wild-type and mutant mice
| Genotype | Runx2-II+/+ | Runx2-II+/− | Runx2-II−/− |
|---|---|---|---|
| Ca (mg/dl) | |||
| 6 weeks | 8.9 ± 0.16 | 8.8 ± 0.17 (P = 0.5921) | 9.3 ± 0.37 (P = 0.1856) |
| 24 weeks | 9.9 ± 0.27a | 9.6 ± 0.29a (P = 0.1856) | – |
| (P = 0.0028) | (P = 0.0194) | ||
| P (mg/dl) | |||
| 6 weeks | 10.5 ± 0.42 | 10.2 ± 0.44 (P = 0.6328) | 11.6 ± 0.95 (P = 0.1812) |
| 24 weeks | 9.5 ± 0.27a | 9.0 ± 0.26 (P = 0.3727) | – |
| (P = 0.0028) | (P = 0.1326) | ||
| Osteocalcin (ζg/ml) | |||
| 6 weeks | 451 ± 51 | 492 ± 49 (P = 0.2196) | 107 ± 56b,c (P = 0.0022) |
| 24 weeks | 114 ± 10a | 56 ± 9a,b (P = 0.0342) | – |
| (P < 0.0001) | (P < 0.0001) | ||
| OPG (ζg/ml) | |||
| 6 weeks | 2.9 ± 0.18 | 2.5 ± 0.18 (P = 0.0793) | 2.7 ± 0.25 (P = 0.4016) |
| 24 weeks | 2.4 ± 0.23 | 2.3 ± 0.24 (P = 0.6936) | – |
| (P = 0.0636) | (P = 0.4248) | ||
| RANK-L (pg/ml) | |||
| 6 weeks | 97.6 ± 5.1 | 66.4 ± 5.1b (P = 0.0003) | 28.3 ± 7.2b,c (P = 0.0003) |
| 24 weeks | 90.4 ± 4.5 | 59.9 ± 4.5b (P < 0.0001) | – |
| (P = 0.3021) | (P = 0.3462) | ||
| TRAP (U/L) | |||
| 6 weeks | 4.5 ± 0.35 | 3.0 ± 0.35b (P = 0.0078) | 2.6 ± 0.49b (P = 0.5163) |
| 24 weeks | 1.9 ± 0.18a | 0.99 ± 0.17a,b (P = 0.0160) | – |
| (P < 0.0001) | (P < 0.0001) | ||
Data are mean ± SEM. from 6 to 10 individual mice. Osteocalcin, OPG, and RANK-L are produced by osteoblasts, and TRAP is produced by osteoclasts.
Difference between 6 and 24 weeks at the indicated P value using statistical analysis described in Materials and methods.
Significant difference from wild-type Runx2-II+/+ mice.
Significant difference from heterozygous Runx2-II+/− mice at P < 0.05 by one-way ANOVA.
With regards to gene expression profiles, the selective Runx2-II+/− mice displayed approximately 50% reduction of Runx2 Type II isoform and 25% reduction of total Runx2, whereas the selective Runx2-II−/− mice had undetectable levels of Runx2 Type II isoform and 50% reduction of total Runx2. As compared with wild-type mice, we found that the expression of osteogenic transcription factors, such as Runx1, Runx3, Msx2, Dlx5, Sox9, and Runx2 Type I isoform, were normal in Runx2-II+/− and Runx2-II−/− mice (Table 3); however, Osterix and Ihh were significantly lower in Runx2-II−/− mice, indicating loss of Runx2-II down-regulates these key genes involved in osteoblastic differentiation (Nakashima et al., 2002; Nakashima and de Crombrugghe, 2003).
Table 3.
Gene-expression profiles in 6-week old mutant mice
| Gene | Accession no. | Runx2-II+/− | Runx2-II−/− | P value |
|---|---|---|---|---|
| Transcriptional factors | ||||
| Runx2-II | NM_009820 | 0.43 ± 0.07a | 0a,b | <0.0001 |
| Runx2-I | D14636 | 1.05 ± 0.09 | 0.92 ± 0.13 | 0.716 |
| Runx2 | NM_009820 | 0.75 ± 0.06a | 0.50 ± 0.09a,b | <0.0001 |
| Runx1 | NM_009821 | 0.94 ± 0.12 | 0.88 ± 0.08 | 0.219 |
| Runx3 | NM_019732 | 0.80 ± 0.10 | 0.91 ± 0.14 | 0.332 |
| Cbfβ | NM_022309 | 0.88 ± 0.09 | 1.01 ± 0.13 | 0.606 |
| Msx2 | NM_013601 | 1.27 ± 0.13 | 0.85 ± 0.19 | 0.135 |
| Sox9 | NM_011448 | 1.12 ± 0.11 | 1.08 ± 0.16 | 0.703 |
| PPARγ | NM_011146 | 1.06 ± 0.13 | 1.13 ± 0.19 | 0.844 |
| Dlx5 | NM_010056 | 1.08 ± 0.10 | 0.89 ± 0.15 | 0.574 |
| Osterix | AF184902 | 0.97 ± 0.09 | 0.40 ± 0.13a,b | <0.0001 |
| Indian Hedgehog | BC046984 | 0.91 ± 0.13 | 0.55 ± 0.18a | 0.029 |
| Cell-type markers | ||||
| Osteoblast | ||||
| Alkaline Phosphatase | NM_007431 | 0.90 ± 0.08 | 0.51 ± 0.11a,b | 0.003 |
| Osteocalcin | NM_007541 | 0.76 ± 0.08a | 0.27 ± 0.12a,b | <0.0001 |
| Osteopontin | AF515708 | 0.74 ± 0.07a | 0.19 ± 0.10a,b | <0.0001 |
| MEPE | NM_053172 | 1.02 ± 0.07 | 0.26 ± 0.11a,b | <0.0001 |
| Collagen I | NM_007742 | 0.90 ± 0.09 | 0.45 ± 0.12a,b | 0.003 |
| DMP1 | MMU242625 | 0.80 ± 0.09 | 0.51 ± 0.13a | 0.009 |
| Osteoprotegerin | MMU94331 | 0.95 ± 0.09 | 0.78 ± 0.13 | 0.357 |
| RANK ligand | NM_011613 | 0.67 ± 0.09a | 0.32 ± 0.13a,b | <0.0001 |
| MMP13 | NM_008607 | 0.70 ± 0.08a | 0.36 ± 0.12a,b | <0.0001 |
| VEGFA | NM_009505 | 0.78 ± 0.10 | 0.60 ± 0.15a | 0.041 |
| Osteoclast | ||||
| TRAP | NM_007388 | 0.73 ± 0.08a | 0.40 ± 0.11a,b | <0.0001 |
| MMP9 | NM_013599 | 0.90 ± 0.07 | 0.53 ± 0.11a,b | 0.004 |
| Chondrocyte | ||||
| Collagen II | NM_031163 | 1.25 ± 0.14 | 0.91 ± 0.20 | 0.264 |
| Collagen X | NM_009925 | 1.09 ± 0.13 | 0.37 ± 0.19a,b | 0.010 |
| Adipocyte | ||||
| aP2 | NM_024406 | 0.96 ± 0.12 | 1.28 ± 0.17 | 0.292 |
| Lipoprotein lipase | NM_008509 | 1.01 ± 0.11 | 1.16 ± 0.16 | 0.659 |
PPARγ, peroxisome proliferator-activated receptor γ; MEPE, matrix extracellular phosphoglycoprotein; DMP1, dentin matrix protein 1; VEGFA, vascular endothelial growth factor A; TRAP, tartrate-resistant acid phosphatase; MMP, matrix metalloproteinase; aP2, adipocyte fatty acid-binding protein 2. Data are mean ± SEM from 6 to 10 6-week-old individual mice and expressed as the fold changes relative to the housekeeping gene cyclophilin A subsequently normalized to wild-type mice.
Significant difference from wild-type Runx2-II+/+.
Significant difference from heterozygous Runx2-II+/− mice at P < 0.05 by one-way ANOVA.
In addition, both osteoblastic and osteoclastic cell type markers were down-regulated in Runx2-II+/− and Runx2-II−/− mice in proportion to the reduction in Runx2-II gene dosage (Table 3), indicating both osteoblastic and osteoclastic activities were impaired in Runx2-II deficient mice. Indeed, we confirmed and extended the analysis of osteoblast and osteoclastic function in bone by examining gene expression profiles by real-time PCR using total RNA isolated from long bone of 6-week-old mice. Our findings of message expression for RANK-L, Osteocalcin, OPG, and TRAP were concordant with the circulating amounts of proteins for these factors. With regard to osteoblastic markers, message levels of RANK-L, Osteoponin (OPN), MMP13, and Osteocalcin (Osc) were significantly reduced in heterozygous Runx2-II+/− mice, whereas OPG was normal. The message for the osteoclastic marker TRAP was also reduced in heterozygous Runx2-II+/− mice. In contrast, we only observe significant decrements in hypertrophic chondrocyte gene makers, including Type X and VEGFA in selective Runx2-II−/− mice, consistent with the observation that Runx2-II is predominantly expressed in hypertrophic chondrocyte and especially involved in hypertrophic zone remodeling (Park et al., 2001). There were no changes in adipocyte markers in Runx2-II+/− and Runx2-II−/− mice (Table 3).
BMSCs cultures
To further confirm the osteoblast function defects in Runx2-II-deficient mice, we performed BMSC cultures derived from age-matched Runx2-II+/+ and Runx2-II+/− mice grown in osteoblastic differentiation media for up to 12 days. There was an age-dependent decrease in mineralized nodule formation but not ALP activity at 6- and 24-week Runx2-II+/+ mice (Figs. 5A, C). Compared with age-matched wild-type BMSC, Runx2-II+/− cultures showed less abundant mineralized nodules and had significantly lower Alizarin Red-S accumulation at day 12 of culture (Figs. 5A, B). The Runx2-II+/− BMSC cultures also displayed significantly lower ALP activity at day 8 of culture compared with age-matched wild type (Fig. 5C).
Fig. 5.
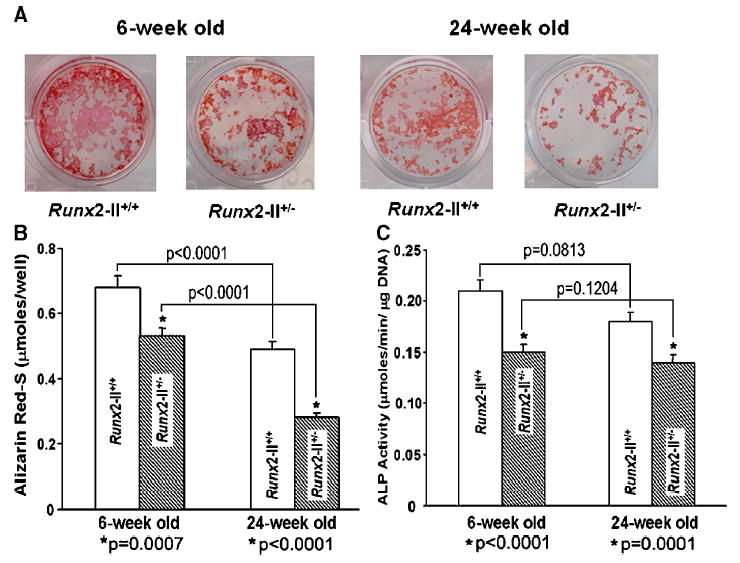
Assessment of osteoblastic differentiation in BMSCs cultures from 6- and 24-week wild-type and mutant mice. (A) Histochemical staining of mineralization nodules. BMSCs from 6- and 24-week mice were cultured for 12 days in differentiation media and stained with Alizarin Red-S. There is an age-dependent decrease in mineralized nodule formation and the heterozygous BMSC cultures showed less abundant mineralized nodules. (B) Quantification of mineralization. Alizarin Red-S was extracted with 10% cetylpyridinium chloride and quantified as described in Materials and methods. The heterozygous BMSCs had significantly lower Alizarin Red-S accumulation at day 12 of culture compared with age-matched wild type. (C) Alkaline phosphatase (ALP) activity. The heterozygous BMSCs had significantly lower ALP activity at day 8 of culture compared with age-matched wild-type, indicating reduced osteoblast function in Runx2-II mutant mice. Data represent the mean ± SEM. *Difference from wild-type Runx2-II+/+ mice at P values specified below the bar graft at each time point. The time-dependent decrements in mineralization but not ALP activity at 6 and 24 weeks were also significantly different (as indicated by brackets above the bar graphs).
Mechanical testing
To explore the functional consequences of loss of Runx2-II, we used 3-point bending tests to determine the biomechanical properties of femurs from Runx2-II-deficient mice. With increasing age, both Runx2-II+/+ and Runx2-II+/− femurs exhibited significant increases in bending strength ( Fmax), Stiffness, and flexural rigidity (EI), and a significant decrease in the maximum deflection to failure (Table 4). Compared to age-matched Runx2-II+/+ mice, femurs from 6-week-old Runx2-II+/− mice exhibited significantly reduced bending strength, stiffness, and flexural rigidity. Femurs from 6-week-old Runx2-II−/− mice exhibited further reductions in bending strength, stiffness, and flexural rigidity compared to Runx2-II+/+ and Runx2-II+/− mice (Table 4). At 24 weeks of age, femurs from Runx2-II+/− mice still exhibited significantly lower bending strength, stiffness, and flexural rigidity compared to age-matched Runx2-II+/+ mice (Table 4).
Table 4.
Biomechanical properties of femurs in wild-type and mutant mice
| Genotype | Runx2-II+/+ | Runx2-II+/− | Runx2-II−/− |
|---|---|---|---|
| Max force (N) | |||
| 6 weeks | 25.1 ± 5.4 | 18.7 ± 3.3a (P = 0.0028) | 8.1 ± 2.7a,b (P = 0.0001) |
| 24 weeks | 37.8 ± 6.4c | 29.9 ± 5.1a,c (P = 0.0014) | – |
| (P = 0.0001) | (P < 0.0001) | ||
| Max deflection (mm) | |||
| 6 weeks | 0.85 ± 0.11 | 0.86 ± 0.05 (P = 0.8775) | 0.81 ± 0.09 (P = 0.3397) |
| 24 weeks | 0.56 ± 0.11c | 0.49 ± 0.06c (P = 0.0908) | – |
| (P < 0.0001) | (P < 0.0001) | ||
| Stiffness (N/mm) | |||
| 6 weeks | 48.1 ± 12.5 | 34.3 ± 6.2a (P = 0.0024) | 10.4 ± 3.2a,b (P < 0.0001) |
| 24 weeks | 93.0 ± 16.9c | 77.1 ± 9.4a,c (P = 0.0024) | – |
| (P < 0.0001) | (P < 0.0001) | ||
| Flexural rigidity (N.mm2) | |||
| 6 weeks | 125.2 ± 32.6 | 89.2 ± 16.1a (P = 0.0024) | 27.1 ± 8.2a,b (P < 0.0001) |
| 24 weeks | 242.2 ± 44.0c | 200.8 ± 24.4a,c (P = 0.0024) | – |
| (P < 0.0001) | (P < 0.0001) | ||
Data are mean ± SEM from 5 to 10 individual mice.
Significant difference from wild-type Runx2-II+/+ mice.
Significant difference from heterozygous Runx2-II+/− mice.
Difference between 6 and 24 weeks at the indicated P value using statistical analysis described in Materials and methods.
Discussion
To further understand the role of Runx-2 in skeletal development, we characterized the structural, cellular, and molecular abnormalities of adult mice selectively deficient for Runx2-II, but with normal expression of the Runx2-I isoform. Evidence for selective deficiency of Runx2-II in mutant mice was confirmed by reduced Runx2-II mRNA levels (Table 3) and prior electromobility shift assays demonstrating a reduction in total Runx2 protein binding to an OSE2 element (Xiao et al., 2004). In contrast to the complete lack of skeletogenesis in the absence of both Runx2-I and -II gene products, we found that selective Runx2-II-deficient mice with normal Runx2-I expression develop mineralized bone structures that are structurally impaired. Loss of a single copy of Runx2-II isoform in selective heterozygous Runx2-II deficiency is sufficient to reduce BMD (Figs. 2 and 3) and impair mechanical strength of bone (Table 4). Osteopenia in Runx2-II-deficient mice was caused by a reduction in trabecular bone volume, decreased number and thickness of trabecular bone, as well as to a reduction of cortical thickness (Fig. 3 and Table 1). Impaired osteoblastic function was the primary cause of osteopenia in Runx2-II-deficient mice. Serum biochemical markers and real-time PCR analysis of bone revealed that Runx2-II-deficient mice have defects in osteoblast-mediated bone formation (Table 3 and Fig. 4). In addition, BMSCs derived from selective Runx2-II-deficient mice revealed a defect of osteoblastic function in vitro as evidenced by diminished alkaline phosphatase activity and mineralization (Fig. 5). Age-dependent acquisition of BMD, however, was preserved in Runx2-II-deficient mice, indicating that selective Runx2-II deficiency does not alter changes in bone mass that are observed with growth.
We also observed evidence for reduced osteoclast function in selective Runx2-deficient mice, including decreased circulating TRAP levels and reduced expression of osteoclastic markers in bone (Table 2). Since Runx2 is not expressed in osteoclasts, these effects are likely mediated through the osteoblastic factors RANK (receptor activator of NF-κB) ligand, which promotes osteoclast formation, and osteoprotegerin (OPG), which is an antagonist that competes with RANK as a decoy receptor for RANK-L and thus attenuates osteoclast differentiation (Kong and Penninger, 2000; Kong et al., 1999). Impairment of osteoclastic differentiation in adult Runx2-II-deficient mice was associated with a net deficiency of RANK-L activity (as a result of no changes in OPG secretion and decreased RANK-L synthesis leading to a gene-dose-dependent reduced RANKL/OPG ratio) (Katagiri and Takahashi, 2002). Our observations coincided with that of others, which report reduced osteoclasts in non-selective Runx2-deficient mice (Yoda et al., 2004) and an effect of Runx2 overexpression in osteoblasts to induce osteoclast differentiation through increased RANK-L (Enomoto et al., 2003; Geoffroy et al., 2002). Collectively, these data suggest an important role of Runx2-II in regulating the coupling of osteoblasts to osteoclasts.
A gene-dose-dependent effect on bone formation has been observed in the non-selective Runx2-deficient mice lacking both functional Runx2-I and Runx2-II (Stein et al., 2004; Tsuji et al., 2004). Similarly, the bone phenotype of Runx2-II was also proportional to the gene dose, since Runx2-II−/− mice had a more severe osteopenia than Runx2-II+/− mice (Figs. 2 and 4). Comparison of the selective Runx2-II mutant mice with the originally described non-selective Runx2 mutant mice, however, revealed differences between Runx2-I and -II function that cannot be explained by gene-dose reduction. In this regard, selective Runx2-II−/− mice (Fig. 1D) are equivalent to the non-selective Runx2+/− mice (Fig. 1A) with regards to gene-dose reduction (namely, deleting half of the possible transcripts), but in the first instance, this is achieved by the absence of both copies of Runx2-II, and in the latter instance, this is attained by deleting 1/2 of Runx2-I and Runx2-II. The fact that selective Runx2-II−/− mice have a more severe skeletal phenotype than Runx2+/− (e.g., approximately 2-fold greater reduction in BMD) suggests the possibility that Runx2-I and -II have distinct functions imparted by their different N-termini (Fig. 2). Such differential function of the N-termini might occur through a functional domain that interacts with different co-factors or enhanced DNA binding (Gu et al., 2000; Kundu et al., 2002; Thirunavukkarasu et al., 1998; Xiao et al., 1999; Yoshida et al., 2002).
The Runx2-II-deficient mouse skeletal phenotype also may be the consequence of the site-specific functions of Runx2 isoforms (i.e., intramembranous, perichondral/bone collar/cortical, endochondral bone) (Chung et al., 2004; Gerstenfeld et al., 2002). In this regard, in situ studies indicate that Runx2-I is predominately expressed in pre-hypertrophic chondrocytes and perichondrial/periosteal cell giving rise to the bone collar and cortical bone (Choi et al., 2002; Park et al., 2001), whereas Runx2-II expression occurs in hypertrophic chondrocytes and osteoblasts (Inada et al., 1999; Liu et al., 2001; Ueta et al., 2001). Consistent with site- and cell-type-specific functions of Runx2-II (Enomoto et al., 2000; Karsenty, 1999; Karsenty and Wagner, 2002; Yamaguchi et al., 2000), heterozygous Runx2-II-deficient mice have greater reductions in trabecular than cortical bone volume (Figs. 3 and 4). Moreover, the recovery of cortical bone with age in Runx2-II-deficient mice (Table 1, Fig. 3) suggests that Runx2-I is sufficient for increases in cortical bone mass that could arise as a compensation for the lower trabecular bone mass.
In addition, we found that Runx2-II null mice had a widened hypertrophic chondrocyte zone and impaired remodeling of the metaphyseal region into trabecular bone (Fig. 4). Since Runx2-II is strongly expressed in terminally differentiated chondrocytes, this suggests a special role for Runx2-II in the fate of hypertrophic chondrocytes and subsequent endochondral bone formation as well as vascular invasion into the cartilage, which was reported to be impaired in the original Runx2−/− mice (Enomoto et al., 2000; Himeno et al., 2002). In contrast, chondrocyte differentiation was inhibited before the prehypertrophic stages in the original Runx2 null mice lacking both isoforms (Inada et al., 1999; Takeda et al., 2001; Ueta et al., 2001).
A better understanding of the downstream effectors of Runx2-II and/or cell-specific factors that underlie the differences in Runx2-II effects on bone remodeling in trabecular and cortical bone is important to defining molecular pathways that could be exploited to more effectively restore trabecular bone volume in osteoporotic disorders. We identified decrements in the interstitial collagenases MMP13 and MMP9 as well as vascular endothelial growth factor (VEGF) in selective Runx2-II-deficient mice, which raises the possibility that the growth plate abnormalities are due to impaired matrix remodeling similar to that observed in MMP9, MMP13, and VEGF null mice (Himeno et al., 2002; Inada et al., 2004; Stickens et al., 2004; Vu et al., 1998; Zelzer et al., 2001). Also, we observed decreased expression of Type X collagen, a marker of hypertrophic chondrocytes (Inada et al., 1999; Ueta et al., 2001), but not Sox9 and Type II collagen in Runx2-II null mice, consistent with the impairment of hypertrophic chondrocytes maturation in the growth plate of selective Runx2-II-deficient mice. We also found that osterix, a previously reported downstream mediator of Runx2 (Nakashima et al., 2002), is also reduced in selective Runx2-II null mice, along with a significant decrease osteoblastic markers such as in alkaline phosphatase, osteocalcin, osteopontin, MEPE, and DMP1, but not adipocyte markers lipoprotein lipase (Lpl) and aP2. Finally, the reduction in Indian hedgehog (Ihh) is consistent with the predominate function of Runx2-II in regulating endochondral bone formation (Yamaguchi et al., 2000), since mice lacking the Ihh gene have no osteoblasts in endochondral bones, but have normal intramembranous bone formation (Chung et al., 2001; Long et al., 2004; St-Jacques et al., 1999). The loss of a single copy of Runx2-II isoform is sufficient to cause osteopenia, indicating the importance of Runx2 gene expression for normal skeletal function.
In conclusion, our studies show that a normal complement of Runx2-II expression is required for optimal osteoblast function in the adult bone. Our data suggest that Runx2-II effects are dose-dependent and the loss of a single copy of Runx2-II isoform is sufficient to cause osteopenia. Overall, the structural, cellular, and biochemical changes in Runx2-II-deficient mice resemble a low-turnover form of osteopenia, where reduced bone formation exceeds the reduction in bone resorption (Kawaguchi et al., 1999; Rodan, 1991) and points to the important role that Runx2-II gene products play in regulating osteoblast function postnatally. In addition, Runx2 appears to have differential effects on trabecular and cortical bone formation, possibly reflecting a site-specific function of Runx2-II in osteoblasts derived from sites of endochondral ossification. This site-specific function might have clinical implications, since age-related osteopenia is characterized by a greater loss of cortical bone compared to trabecular bone (Kawaguchi et al., 1999), whereas post-menopausal osteoporosis is characterized by trabecular bone loss in excess of cortical bone loss (Manolagas and Jilka, 1995). Additional differences between Runx2-II and Runx2-I might reflect differences in their respective N-termini. The selective deletion of Runx2-I will be required to more fully understand the differential function of these two isoforms.
Acknowledgments
We thank Dr. Gerard Karsenty for his gift of the non-selective Runx2 mutant mice. This work was supported by the grant RO1-AR049712 from the National Institutes of Health.
References
- Banerjee C, Javed A, Choi JY, Green J, Rosen V, van Wijnen AJ, Stein JL, Lian JB, Stein GS. Differential regulation of the two principal Runx2/Cbfa1 N-terminal isoforms in response to bone morphogenetic protein-2 during development of the osteoblast phenotype. Endocrinology. 2001;142:4026–4039. doi: 10.1210/endo.142.9.8367. [DOI] [PubMed] [Google Scholar]
- Choi JY, Pratap J, Javed A, Zaidi SK, Xing L, Balint E, Dalamangas S, Boyce B, van Wijnen AJ, Lian JB, Stein JL, Jones SN, Stein GS. Subnuclear targeting of Runx/Cbfa/AML factors is essential for tissue-specific differentiation during embryonic development. Proc Natl Acad Sci U S A. 2001;98:8650–8655. doi: 10.1073/pnas.151236498. [DOI] [PMC free article] [PubMed] [Google Scholar]
- Choi KY, Lee SW, Park MH, Bae YC, Shin HI, Nam S, Kim YJ, Kim HJ, Ryoo HM. Spatio-temporal expression patterns of Runx2 isoforms in early skeletogenesis. Exp Mol Med. 2002;34:426–433. doi: 10.1038/emm.2002.60. [DOI] [PubMed] [Google Scholar]
- Chung UI, Schipani E, McMahon AP, Kronenberg HM. Indian hedgehog couples chondrogenesis to osteogenesis in endochondral bone development. J Clin Invest. 2001;107:295–304. doi: 10.1172/JCI11706. [DOI] [PMC free article] [PubMed] [Google Scholar]
- Chung UI, Kawaguchi H, Takato T, Nakamura K. Distinct osteogenic mechanisms of bones of distinct origins. J Orthop Sci. 2004;9:410–414. doi: 10.1007/s00776-004-0786-3. [DOI] [PubMed] [Google Scholar]
- Ducy P, Zhang R, Geoffroy V, Ridall L, Karsenty G. Osf2/Cbfa1: a transcriptional activator of osteoblast differentiation. Cell. 1997;89:747–754. doi: 10.1016/s0092-8674(00)80257-3. [DOI] [PubMed] [Google Scholar]
- Enomoto H, Enomoto-Iwamoto M, Iwamoto M, Nomura S, Himeno M, Kitamura Y, Kishimoto T, Komori T. Cbfa1 is a positive regulatory factor in chondrocyte maturation. J Biol Chem. 2000;275:8695–8702. doi: 10.1074/jbc.275.12.8695. [DOI] [PubMed] [Google Scholar]
- Enomoto H, Shiojiri S, Hoshi K, Furuichi T, Fukuyama R, Yoshida CA, Kanatani N, Nakamura R, Mizuno A, Zanma A, Yano K, Yasuda H, Higashio K, Takada K, Komori T. Induction of osteoclast differentiation by Runx2 through receptor activator of nuclear factor-kappa B ligand (RANKL) and osteoprotegerin regulation and partial rescue of osteoclastogenesis in Runx2−/− mice by RANKL transgene. J Biol Chem. 2003;278:23971–23977. doi: 10.1074/jbc.M302457200. [DOI] [PubMed] [Google Scholar]
- Geoffroy V, Kneissel M, Fournier B, Boyde A, Matthias P. High bone resorption in adult aging transgenic mice overexpressing cbfa1/runx2 in cells of the osteoblastic lineage. Mol Cell Biol. 2002;22:6222–6233. doi: 10.1128/MCB.22.17.6222-6233.2002. [DOI] [PMC free article] [PubMed] [Google Scholar]
- Gerstenfeld LC, Cruceta J, Shea CM, Sampath K, Barnes GL, Einhorn TA. Chondrocytes provide morphogenic signals that selectively induce osteogenic differentiation of mesenchymal stem cells. J Bone Miner Res. 2002;17:221–230. doi: 10.1359/jbmr.2002.17.2.221. [DOI] [PubMed] [Google Scholar]
- Gu TL, Goetz TL, Graves BJ, Speck NA. Auto-inhibition and partner proteins, core-binding factor beta (CBFbeta) and Ets-1, modulate DNA binding by CBFalpha2 (AML1) Mol Cell Biol. 2000;20:91–103. doi: 10.1128/mcb.20.1.91-103.2000. [DOI] [PMC free article] [PubMed] [Google Scholar]
- Harada H, Tagashira S, Fujiwara M, Ogawa S, Katsumata T, Yamaguchi A, Komori T, Nakatsuka M. Cbfa1 isoforms exert functional differences in osteoblast differentiation. J Biol Chem. 1999;274:6972–6978. doi: 10.1074/jbc.274.11.6972. [DOI] [PubMed] [Google Scholar]
- Himeno M, Enomoto H, Liu W, Ishizeki K, Nomura S, Kitamura Y, Komori T. Impaired vascular invasion of Cbfa1-deficient cartilage engrafted in the spleen. J Bone Miner Res. 2002;17:1297–1305. doi: 10.1359/jbmr.2002.17.7.1297. [DOI] [PubMed] [Google Scholar]
- Inada M, Yasui T, Nomura S, Miyake S, Deguchi K, Himeno M, Sato M, Yamagiwa H, Kimura T, Yasui N, Ochi T, Endo N, Kitamura Y, Kishimoto T, Komori T. Maturational disturbance of chondrocytes in Cbfa1-deficient mice. Dev Dyn. 1999;214:279–290. doi: 10.1002/(SICI)1097-0177(199904)214:4<279::AID-AJA1>3.0.CO;2-W. [DOI] [PubMed] [Google Scholar]
- Inada M, Wang Y, Byrne MH, Rahman MU, Miyaura C, Lopez-Otin C, Krane SM. Critical roles for collagenase-3 (Mmp13) in development of growth plate cartilage and in endochondral ossification. Proc Natl Acad Sci U S A. 2004;101:17192–17197. doi: 10.1073/pnas.0407788101. [DOI] [PMC free article] [PubMed] [Google Scholar]
- Karsenty G. The genetic transformation of bone biology. Genes Dev. 1999;13:3037–3051. doi: 10.1101/gad.13.23.3037. [DOI] [PubMed] [Google Scholar]
- Karsenty G, Wagner EF. Reaching a genetic and molecular understanding of skeletal development. Dev Cell. 2002;2:389–406. doi: 10.1016/s1534-5807(02)00157-0. [DOI] [PubMed] [Google Scholar]
- Katagiri T, Takahashi N. Regulatory mechanisms of osteoblast and osteoclast differentiation. Oral Dis. 2002;8:147–159. doi: 10.1034/j.1601-0825.2002.01829.x. [DOI] [PubMed] [Google Scholar]
- Kawaguchi H, Manabe C, Miyaura C, Chikuda H, Nakamura K, Kuro-o M. Independent impairment of osteoblast and osteoclast differentiation in klotho mouse exhibiting low-turnover osteopenia. J Clin Invest. 1999;104:229–237. doi: 10.1172/JCI5705. [DOI] [PMC free article] [PubMed] [Google Scholar]
- Komori T, Yagi H, Nomura S, Yamaguchi A, Sasaki A, Deguchi K, Shimizu Y, Bronson RT, Gao YH, Inada M, Sato M, Okamoto R, Kitamura Y, Yoshiki S, Kishimoto T. Targeted disruption of Cbfa1 results in a complete lack of bone formation owing to maturational arrest of osteoblasts. Cell. 1997;89:755–764. doi: 10.1016/s0092-8674(00)80258-5. [DOI] [PubMed] [Google Scholar]
- Kong YY, Penninger JM. Molecular control of bone remodeling and osteoporosis. Exp Gerontol. 2000;35:947–956. doi: 10.1016/s0531-5565(00)00178-9. [DOI] [PubMed] [Google Scholar]
- Kong YY, Yoshida H, Sarosi I, Tan HL, Timms E, Capparelli C, Morony S, Oliveira-dos-Santos AJ, Van G, Itie A, Khoo W, Wakeham A, Dunstan CR, Lacey DL, Mak TW, Boyle WJ, Penninger JM. OPGL is a key regulator of osteoclastogenesis, lymphocyte development and lymph-node organogenesis. Nature. 1999;397:315–323. doi: 10.1038/16852. [DOI] [PubMed] [Google Scholar]
- Kundu M, Javed A, Jeon JP, Horner A, Shum L, Eckhaus M, Muenke M, Lian JB, Yang Y, Nuckolls GH, Stein GS, Liu PP. Cbfbeta interacts with Runx2 and has a critical role in bone development. Nat Genet. 2002;32:639–644. doi: 10.1038/ng1050. [DOI] [PubMed] [Google Scholar]
- Liu W, Toyosawa S, Furuichi T, Kanatani N, Yoshida C, Liu Y, Himeno M, Narai S, Yamaguchi A, Komori T. Over-expression of Cbfa1 in osteoblasts inhibits osteoblast maturation and causes osteopenia with multiple fractures. J Cell Biol. 2001;155:157–166. doi: 10.1083/jcb.200105052. [DOI] [PMC free article] [PubMed] [Google Scholar]
- Long F, Chung UI, Ohba S, McMahon J, Kronenberg HM, McMahon AP. Ihh signaling is directly required for the osteoblast lineage in the endochondral skeleton. Development. 2004;131:1309–1318. doi: 10.1242/dev.01006. [DOI] [PubMed] [Google Scholar]
- Manolagas SC, Jilka RL. Mechanisms of diseases: bone marrow, cytokines, and bone remodeling—Emergency insights into the pathophysiology of osteoporosis. N Engl J Med. 1995;332:305–311. doi: 10.1056/NEJM199502023320506. [DOI] [PubMed] [Google Scholar]
- Mundlos S, Otto F, Mundlos C, Mulliken JB, Aylsworth AS, Albright S, Lindhout D, Cole WG, Henn W, Knoll JH, Owen MJ, Mertelsmann R, Zabel BU, Olsen BR. Mutations involving the transcription factor CBFA1 cause cleidocranial dysplasia. Cell. 1997;89:773–779. doi: 10.1016/s0092-8674(00)80260-3. [DOI] [PubMed] [Google Scholar]
- Nakashima K, de Crombrugghe B. Transcriptional mechanisms in osteoblast differentiation and bone formation. Trends Genet. 2003;19:458–466. doi: 10.1016/S0168-9525(03)00176-8. [DOI] [PubMed] [Google Scholar]
- Nakashima K, Zhou X, Kunkel G, Zhang Z, Deng JM, Behringer RR, de Crombrugghe B. The novel zinc finger-containing transcription factor osterix is required for osteoblast differentiation and bone formation. Cell. 2002;108:17–29. doi: 10.1016/s0092-8674(01)00622-5. [DOI] [PubMed] [Google Scholar]
- Otto F, Thornell AP, Crompton T, Denzel A, Gilmour KC, Rosewell IR, Stamp GW, Beddington RS, Mundlos S, Olsen BR, Selby PB, Owen MJ. Cbfa1, a candidate gene for cleidocranial dysplasia syndrome, is essential for osteoblast differentiation and bone development. Cell. 1997;89:765–771. doi: 10.1016/s0092-8674(00)80259-7. [DOI] [PubMed] [Google Scholar]
- Park MH, Shin HI, Choi JY, Nam SH, Kim YJ, Kim HJ, Ryoo HM. Differential expression patterns of Runx2 isoforms in cranial suture morphogenesis. J Bone Miner Res. 2001;16:885–892. doi: 10.1359/jbmr.2001.16.5.885. [DOI] [PubMed] [Google Scholar]
- Rodan GA. Perspectives: mechanical loading, estrogen deficiency, and the coupling of bone formation to bone resorption. J Bone Miner Res. 1991;6:527–530. doi: 10.1002/jbmr.5650060602. [DOI] [PubMed] [Google Scholar]
- Silva MJ, Ulrich SR. In vitro sodium fluoride exposure decreases torsional and bending strength and increases ductility of mouse femora. J Biomech. 2000;33:231–234. doi: 10.1016/s0021-9290(99)00158-x. [DOI] [PubMed] [Google Scholar]
- Stein GS, Lian JB, van Wijnen AJ, Stein JL, Montecino M, Javed A, Zaidi SK, Young DW, Choi JY, Pockwinse SM. Runx2 control of organization, assembly and activity of the regulatory machinery for skeletal gene expression. Oncogene. 2004;23:4315–4329. doi: 10.1038/sj.onc.1207676. [DOI] [PubMed] [Google Scholar]
- Stickens D, Behonick DJ, Ortega N, Heyer B, Hartenstein B, Yu Y, Fosang AJ, Schorpp-Kistner M, Angel P, Werb Z. Altered endochondral bone development in matrix metalloproteinase 13-deficient mice. Development. 2004;131:5883–5895. doi: 10.1242/dev.01461. [DOI] [PMC free article] [PubMed] [Google Scholar]
- St-Jacques B, Hammerschmidt M, McMahon AP. Indian hedgehog signaling regulates proliferation and differentiation of chondrocytes and is essential for bone formation. Genes Dev. 1999;13:2072–2086. doi: 10.1101/gad.13.16.2072. [DOI] [PMC free article] [PubMed] [Google Scholar]
- Takeda S, Bonnamy JP, Owen MJ, Ducy P, Karsenty G. Continuous expression of Cbfa1 in non-hypertrophic chondrocytes uncovers its ability to induce hypertrophic chondrocyte differentiation and partially rescues Cbfa1-deficient mice. Genes Dev. 2001;15:467–481. doi: 10.1101/gad.845101. [DOI] [PMC free article] [PubMed] [Google Scholar]
- Thirunavukkarasu K, Mahajan M, McLarren KW, Stifani S, Karsenty G. Two domains unique to osteoblast specific transcription factor Osf2/Cbfa1 contribute to its transactivation function and its inability to heterodimerize with Cbfβ. Mol Cell Biol. 1998;18:4197–4208. doi: 10.1128/mcb.18.7.4197. [DOI] [PMC free article] [PubMed] [Google Scholar]
- Tsuji K, Komori T, Noda M. Aged mice require full transcription factor, Runx2/Cbfa1, gene dosage for cancellous bone regeneration after bone marrow ablation. J Bone Miner Res. 2004;19:1481–1489. doi: 10.1359/JBMR.040601. [DOI] [PubMed] [Google Scholar]
- Tu Q, Pi M, Karsenty G, Simpson L, Liu S, Quarles LD. Rescue of the skeletal phenotype in CasR-deficient mice by transfer onto the Gcm2 null background. J Clin Invest. 2003;111:1029–1037. doi: 10.1172/JCI17054. [DOI] [PMC free article] [PubMed] [Google Scholar]
- Ueta C, Iwamoto M, Kanatani N, Yoshida C, Liu Y, Enomoto-Iwamoto M, Ohmori T, Enomoto H, Nakata K, Takada K, Kurisu K, Komori T. Skeletal malformations caused by overexpression of Cbfa1 or its dominant negative form in chondrocytes. J Cell Biol. 2001;153:87–100. doi: 10.1083/jcb.153.1.87. [DOI] [PMC free article] [PubMed] [Google Scholar]
- Vu TH, Shipley JM, Bergers G, Berger JE, Helms JA, Hanahan D, Shapiro SD, Senior RM, Werb Z. MMP-9/gelatinase B is a key regulator of growth plate angiogenesis and apoptosis of hypertrophic chondrocytes. Cell. 1998;93:411–422. doi: 10.1016/s0092-8674(00)81169-1. [DOI] [PMC free article] [PubMed] [Google Scholar]
- Xiao ZS, Crenshaw M, Guo R, Nesbitt T, Drezner MK, Quarles LD. Intrinsic mineralization defect in Hyp mouse osteoblasts. Am J Physiol. 1998;275:E700–E708. doi: 10.1152/ajpendo.1998.275.4.E700. [DOI] [PubMed] [Google Scholar]
- Xiao ZS, Hinson TK, Quarles LD. Cbfa1 isoform overexpression upregulates osteocalcin gene expression in non-osteoblastic and pre-osteoblastic cells. J Cell Biochem. 1999;74:596–605. [PubMed] [Google Scholar]
- Xiao ZS, Quarles LD, Chen QQ, Yu YH, Qu XP, Jiang CH, Deng HW, Li YJ, Zhou HH. Effect of asymmetric dimethylarginine on osteoblastic differentiation. Kidney Int. 2001;60:1699–1704. doi: 10.1046/j.1523-1755.2001.00011.x. [DOI] [PubMed] [Google Scholar]
- Xiao ZS, Simpson LG, Quarles LD. IRES-dependent translational control of Cbfa1/Runx2 expression. J Cell Biochem. 2003;88:493–505. doi: 10.1002/jcb.10375. [DOI] [PubMed] [Google Scholar]
- Xiao ZS, Hjelmeland AB, Quarles LD. Selective deficiency of the “bone-related” Runx2-II unexpectedly preserves osteoblast-mediated skeletogenesis. J Biol Chem. 2004;279:20307–20313. doi: 10.1074/jbc.M401109200. [DOI] [PubMed] [Google Scholar]
- Yamaguchi A, Komori T, Suda T. Regulation of osteoblast differentiation mediated by bone morphogenetic proteins, hedgehogs, and Cbfa1. Endocr Rev. 2000;21:393–411. doi: 10.1210/edrv.21.4.0403. [DOI] [PubMed] [Google Scholar]
- Yoda S, Suda N, Kitahara Y, Komori T, Ohyama K. Delayed tooth eruption and suppressed osteoclast number in the eruption pathway of heterozygous Runx2/Cbfa1 knockout mice. Arch Oral Biol. 2004;49:435–442. doi: 10.1016/j.archoralbio.2004.01.010. [DOI] [PubMed] [Google Scholar]
- Yoshida CA, Furuichi T, Fujita T, Fukuyama R, Kanatani N, Kobayashi S, Satake M, Takada K, Komori T. Core-binding factor beta interacts with Runx2 and is required for skeletal development. Nat Genet. 2002;32:633–638. doi: 10.1038/ng1015. [DOI] [PubMed] [Google Scholar]
- Zelzer E, Glotzer DJ, Hartmann C, Thomas D, Fukai N, Soker S, Olsen BR. Tissue specific regulation of VEGF expression during bone development requires Cbfa1/Runx2. Mech Dev. 2001;106:97–106. doi: 10.1016/s0925-4773(01)00428-2. [DOI] [PubMed] [Google Scholar]
- Zhou G, Chen Y, Zhou L, Thirunavukkarasu K, Hecht J, Chitayat D, Gelb BD, Pirinen S, Berry SA, Greenberg CR, Karsenty G, Lee B. CBFA1 mutation analysis and functional correlation with phenotypic variability in cleidocranial dysplasia. Hum Mol Genet. 1999;8:2311–2316. doi: 10.1093/hmg/8.12.2311. [DOI] [PubMed] [Google Scholar]