

Summary
Many approaches have been tried to establish assays for melanosome transfer to keratinocytes. In this report we describe and summarize various novel attempts to label melanosomes in search of a reliable, specific, reproducible and quantitative assay system. We tried to fluorescently label melanosomes by transfection of GFP-labeled melanosomal proteins and by incubation of melanocytes with fluorescent melanin intermediates or homologues. In most cases a weak cytoplasmic fluorescence was perceived, which was probably due to incorrect sorting or deficient incorporation of the fluorescent protein and different localisation. We were able to label melanosomes via incorporation of 14C-thiouracil into melanin. Consequently, we tried to develop an assay to separate keratinocytes with transferred radioactivity from melanocytes after co-culture. Differential trypsination and different magnetic bead separation techniques were tested with unsatisfactory results. An attempt was also made to incorporate fluorescent thiouracil, since this would allow cells to be separated by FACS. In conclusion, different methods to measure pigment transfer between donor melanocytes and acceptor keratinocytes were thoroughly examined. This information could give other researchers a head start in the search for a melanosome transfer assay with said qualities to better understand pigment transfer.
Keywords: melanin, transfer, pigmentation, melanocyte, keratinocyte, GFP, thiouracil
Introduction
The color of human skin is determined by melanocytes located at the dermal-epidermal barrier which produce the pigment melanin and subsequently transfer it to keratinocytes for distribution in the upper layers of the epidermis (Boissy, 2003; Jimbow and Sugiyama, 1998). Tyrosinase gene family proteins (TYR, TYRP1 and TYRP2) regulate the synthesis of melanin, which takes place in specialized organelles termed melanosomes. Apart from those melanogenic enzymes, many other proteins have been identified in early melanosomes (Basrur et al., 2003), including GP100 and MART1, which play structural roles in melanosome maturation (Hoashi et al., 2005; Kushimoto et al., 2003; Yasumoto et al., 2004).
The transfer of melanin from melanocytes to keratinocytes is absolutely necessary to protect skin cells from damaging UV radiation and that process is upregulated by UV itself (Abdel-Malek, 1998). However, little is known about the mechanism(s) by which melanosomes are transferred and how that process is regulated by melanocytes and/or keratinocytes. The protease-activated receptor 2 (PAR-2) has been reported to play an important role in the transfer (Babiarz-Magee et al., 2004; Seiberg, 2001) and activation of PAR-2, which is localized on the surface of keratinocytes, up-regulates transfer by an as yet unknown mechanism. In addition, Scott et al. (2002) suggest a model with filopodia serving as conduits for melanosome transfer. A major obstacle to elucidating these processes is the lack of a suitable assay to rapidly and quantitatively measure transfer in vitro or in vivo. Several attempts have been made to analyze and quantify the process of melanosome transfer. Starting from the thesis that the uptake of melanosomes is mediated through phagocytosis, Virador et al. (2002) and Sharlow et al. (2000) measured the phagocytosis rate of keratinocytes, including their uptake of fluorescent latex beads and/or purified melanosomes. Minwalla et al. (2001) utilized nonspecific fluorescent labeling of human primary melanocytes and followed the transfer of fluorescent vesicles to keratinocytes in co-culture to measure melanosome transfer. Furthermore, a co-culture model using melan-a melanocytes and SP1 keratinocytes to assess standard regulators of pigmentation has been previously described by our lab (Lei et al., 2002), and a method that uses Fontana-Masson staining of melanin for quantification has also been introduced (Yoon et al., 2003). We recently developed an imaging technique for skin sections that quantifies melanin in three-dimensional skin models and in skin in situ (Tadokoro et al., 2005; Yoon et al., 2003). Yet another approach is the visualisation of melanosomal transfer by electron microscopy (reviewed in Boissy, 2003; Jimbow and Sugiyama, 1998). Using time-laps digital microscopy Scott et al. (2002) generate movies of co-cultured human melanocytes and keratincocytes. They also use membrane fluorescence labeling for studying membrane fusion as a marker for melanosomal transfer. However, all of those approaches are unfavourable in terms of either specificity, reproducibility, quantifiability or complexity. To address all of these problems would require efficient labeling of melanosomes combined with 2- or 3-dimensional culture systems containing melanocytes and keratinocytes and the ability to distinguish between label present in keratinocytes versus melanocytes.
Apart from the direct visualization of melanin that can be used in the live imaging of co-cultures, Fontana-Masson silver stain as well as L-DOPA stain can be used to enhance melanin content. Melanin can also be specifically labeled by 14C-thiouracil (Napolitano et al., 1996; Palumbo et al., 1994; Whittaker, 1971), which provides yet another approach to label melanosomes. Green fluorescent protein (GFP) and its variants (Cubitt et al., 1995) have been used to label proteins, including some that are related to melanosomal transport within melanocytes such as MyosinVa (Westbroek et al., 2003), RAB27a (Bahadoran et al., 2003) and RAB27b (Chen et al., 2002b). However, despite a relatively large number of melanosome-specific proteins, no report to date has shown GFP labeling of such proteins that could be used to stably and reproducibly track melanosomal transfer. Fluorescent labeling of proteins in viable cells can also be achieved with short cysteine-rich domains, and fluorescein derivatives with two As(III) substituents, FlAsH, bind specifically to tetracysteine motifs (-C-C-X-X-C-C-) (Adams et al., 2002; Griffin et al., 2000).
In this report, we summarize various attempts to design a reliable, specific, reproducible and quantitative assay to characterize melanosome transfer. We present our successful and unsuccessful approaches to develop such an assay, and we discuss the potentials and limitations of each technique to reach this goal.
Results and Discussion
GFP constructs of melanosomal proteins
We initially examined the use of a live marker GFP approach to establish a melanosome transfer assay. Different constructs with GFP and various melanosomal proteins were generated and then tested following transfection into mouse melan-a and human primary melanocytes (summarized in Table 1).
TABLE 1.
Summary of Melanosome Labeling Approaches
| Method | Target | Advantages | Disadvantages | Result |
|---|---|---|---|---|
| Green Fluorescent Protein | TYR
TYRP1 Mart1 Gp100 |
- specific | - low fluorescence
- deficient targeting |
|
| LAMP1
LAMP3 RAB27a |
- not melanosome-specific
- reversible binding of RAB27a |
- deficient targeting
- EGFP-RAB27a could be useful |
||
| Cysteine – tag / FlAsH | Tyr
Tyrp1 |
- specific | - low fluorescence
- uptake not specific |
|
| Fluorescently labeled melanin intermediates or homologues (tyramide, thiouracil) | melanin | - specific | - low fluorescence
- no incorporation in melanin |
|
| 14C-Thiouracil | melanin | - specific | - radioactive component
- need for cell separation by other methods than FACS |
- specific melanin labeling
- deficient cell separation |
| CFDA | protein | - low specificity
- low stability |
- variation of fluorescence due to test substances and melanocyte proliferation rates |
We attempted to direct GFP to the melanosomal membrane by linking it to TYR and to TYRP1, melanocyte-specific proteins that reside in the melanosomal membrane. Both are type I membrane glycoproteins that share extensive amino acid sequence identity and structural homology. Whereas the catalytic sites of both proteins are located in the large amino terminal domains, which reside within the melanosomal lumen, the sorting signals critical for proper trafficking of those proteins to melanosomes are present in their short cytoplasmic tails. After translation, TYR and TYRP1 are transported through the rough endoplasmic reticulum and Golgi apparatus, where they undergo post-translational processing and glycosylation, and eventually they are transported from the trans-Golgi network to melanosomes via clathrin-coated vesicles (Watabe et al., 2004).
We initially linked enhanced GFP (EGFP) to the amino terminal domain of human TYRP1 in order to avoid disrupting the critical sorting signal at the carboxy terminus (Figure 1A). Transient transfection of this construct into human primary melanocytes repeatedly gave a very weak fluorescence that was in the cytoplasm, but not in the nucleus (data not shown). We ascribed the relatively weak signals found with EGFP-TYRP1 to several possible reasons. GFP is highly pH sensitive and is quenched at an acidic pH (Sawano and Miyawaki, 2000) and melanosomes are acidic organelles (Ancans and Thody, 2000). Therefore our first explanation would be the attenuation of fluorescence of EGFP by acidic melanosomal pH. Quenching of the signal by absorption due to melanin per se, or by its reducing properties (Inouye and Tsuji, 1994) is also possible, as is the disrupted sorting of the chimeric protein to melanosomes.
Figure 1. Transfection of human melanocytes with E(C)GFP-CYT-TYR.

A) schematic representation of the GFP constructs of TYR and TYRP1, showing the position of the fluorescent moiety. B) Human melanocytes (culture method 2) transfected with E(C)GFP-CYT-TYR demonstrate diffuse green fluorescence with perinuclear accentuation. D) Addition of bafilomycin A1 (25 nM) results in a brighter signal that shows a clear granular distribution. F) Co-staining with the melanosomal marker NKI/BETEB (against GP100) demonstrates discrete co-localisation in the perinuclear region but not in the dendrite tips.
One approach to avoid the problem of the acidic environment of melanosomes is the use of a pH resistant form of GFP. Sawano and Miyawaki (2000) created a GFP variant which is stable in a wide pH range (pH 4 to 12), termed enhanced cyan-GFP (ECGFP). The fluorescence of ECGFP decreases only by 10% when the pH is decreased to 4, compared to a reduction of nearly 90% in the fluorescence of EGFP. Human TYRP1 protein was linked to ECGFP at its amino terminal end, creating a construct comparable to EGFP-TYRP1. Transfection of human melanocytes with ECGFP-TYRP1 gave a weak fluorescent signal in the cytoplasm, similar to the signal created by EGFP-TYRP1 (data not shown). Thus, we conclude that the acidic pH of melanosomes is not the limiting factor in the quenching process. To exclude attenuation of the fluorescent signal by the physical or chemical properties of melanin, EGFP-TYRP and ECGFP-TYRP1 were transfected in unpigmented melanocytic cells, melan-c albino mouse melanocytes. However, the lack of melanin did not change the fluorescence pattern and again a weak signal was seen throughout the cytoplasm leading us to conclude that it is not the melanin per se that interferes with the fluorescent labeling of melanosomes (data not shown).
We next linked EGFP to the carboxy terminal ends of TYR and TYRP1, constructs that would put the fluorescent label on the cytoplasmic side of the melanosomal membrane (Figure 1A). Again, a very weak fluorescent signal was detected throughout the cell, this time including cell nuclei, which is compatible with the idea that the protein is not routed correctly via the secretory pathway, and diffuses freely in the cytosol (data not shown).
As mentioned above, TYR and TYRP1 have critical signals in their cytoplasmic tails that direct their proper sorting to melanosomes. A fusion protein was made, consisting of EGFP or ECGFP attached to the transmembrane domain and cytoplasmic tails of human TYR or TYRP1 (Figure 1A). Human primary melanocytes, melan-a and melan-c mouse melanocytes were transfected with these constructs; both EGFP-CYT-TYR and ECGFP-CYT-TYR gave a perinuclear fluorescence pattern (Figure 1B). The sum of these results suggests that disruption of TYR and TYRP1 at their carboxy or amino termini labels them as mutant proteins and restricts their correct trafficking to melanosomes, perhaps by their retention in the ER and digestion by proteasomes. We examined this hypothesis by staining GFP-transfected human melanocytes with a specific ER marker (anti-human calreticulin) and characterizing them by confocal microscopy. Perinuclear co-localisation revealed partial retainment of the GFP constructs in the ER (Figure 1C).
The function of a protein usually depends upon a number of post-translational events, in particular regulation by quality control events in the ER. To be released from the ER, a protein must have reached a correctly folded conformation, called the native conformation, and when a protein is unable to reach this conformational state, the protein is selectively retained in the ER and is eventually degraded by proteasomes (Ellgaard and Helenius, 2003). TYR and TYRP1 seem to be highly sensitive to such controls, since even minor mutations in seemingly unimportant motifs lead to ER retention (Kushimoto et al., 2003; Toyofuku et al., 2001) and result in oculocutaneous albinism types 1 and type 3, respectively. Maturation in the early secretory pathway can be improved by the addition of chaperones which can operate in specific or non-specific manners, they are termed pharmacological and chemical chaperones, respectively. Pharmacological chaperones are ligands that target a specific protein; they interact with incompletely folded proteins and probably this interaction promotes the stabilization and transition to the native state. Tyrosine and DOPA, two substrates of TYR, are able to stabilize an immature, ER-retained form of the protein present in amelanotic melanoma cells, leading to the successful exit of the stabilized TYR from the ER (Halaban et al., 2001). Accordingly, we added tyrosine and DOPA to human melanocytes 5 h after transfection with E(C)GFP-CYT-TYR, but addition of either chaperone did not alter the fluorescence intensity or pattern (data not shown).
Bafilomycin A1 is a selective vacuolar-type (H+)-ATPase inhibitor that raises pH in a broad range of subcellular compartments (Ancans and Thody, 2000; Fuller et al., 2001) and can induce melanogenesis in amelanotic melanoma cells and in pink-eyed dilution mutant melanocytes by affecting early TYR trafficking and processing (Ancans and Thody, 2000; Chen et al., 2002a, 2004; Watabe et al., 2004). Bafilomycin A1 promotes TYR maturation and exit from the ER in a non-specific way, and hence functions as a chemical chaperone. Human melanocytes and melan-c melanocytes were transfected with ECGFP-CYT-TYR, and 5 h later bafilomycin A1 was added. The fluorescence was clearly brighter and displayed a granular pattern (Figure 1D). Decrease of co-localisation with the ER marker calreticulin suggested export from the ER (Figure 1E). Co-staining with the melanosomal marker NKI/BETEB (which recognizes the melanosomal protein gp100) demonstrates discrete co-localisation at the perinuclear region, but not in the dendrites (Figure 1F).
As a final approach to optimizing the targeting of fluorescently-labeled melanosomal proteins, we added the intralumenal part of TYR to ECGFP-CYT-TYR. However, Il-TYR-ECGFP-CYT-TYR fluorescence was weak and was not compatible with a melanosomal location (data not shown).
Of all plasmids tested in mouse melan-a melanocytes (e.g. different EGFP constructs of mouse Gp100, Tyr and Tyrp1; data not shown), only Mart1-EGFP showed a substantial amount of green fluorescence throughout the whole cytoplasm. Co-localization studies with HMB45 to identify stage I melanosomes or with a Tyr antibody to identify stage II melanosomes revealed some co-localization of the fluorescence (Figure 2A, 2B). Thus, Mart1-GFP is, at least in part, correctly sorted to melanosomes, and labeled melanosomes are therefore generated in this system.
Figure 2. Transfection of human and mouse melanocytes with melanosome-specific and -nonspecific GFP constructs.
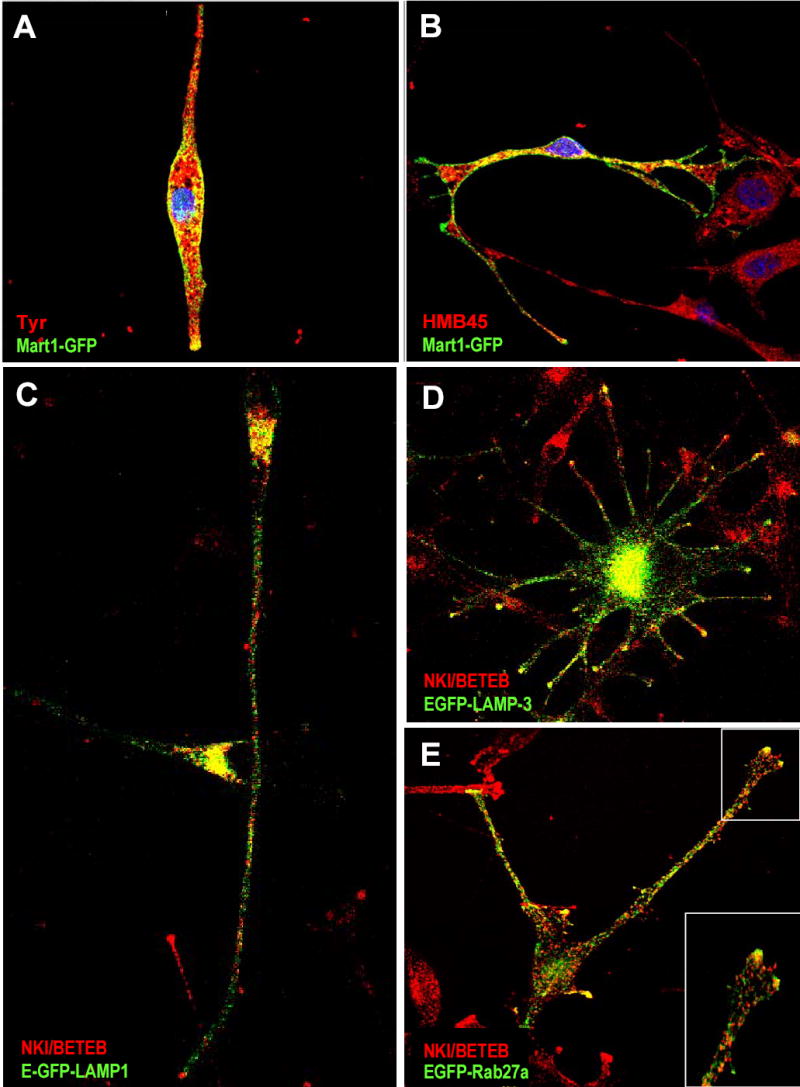
A) Co-staining of melan-a melanocytes transfected with Mart1-GFP and α-PEP7 (against Tyr). B) Co-staining of Mart1-GFP transfected melan-a melanocytes with HMB45 (against Gp100). C) Human melanocytes (culture method 2) transfected with LAMP1-GFP were stained with NKI/BETEB (against GP100); co-localization is seen in the perinuclear area, but not in the dendrites. Co-staining with α-PEP1 (against TYRP1) gives the same result (not shown). D) Human melanocytes transfected with LAMP3-GFP were stained with NKI/BETEB; co-localisation in the dendrites is discrete. E) GFP fluorescence of EGFP-RAB27a transfected human melanocytes and co-staining with NKI/BETEB (against GP100) co-localize at the cell periphery, especially at the dendrite tips.
Using transient transfection of melan-a melanocytes for co-culture with mouse SP1 keratinocytes, we were unable to detect any fluorescence in keratinocytes after 3 days of co-culture (data not shown). Additionally, we attempted to stably transfect melan-a melanocytes with different transfection methods and used pEGFP vector’s gentamycin resistance for selection. However, after several rounds of sub-cloning the GFP fluorescence of the cells had decreased to background although the cells were still resistant to the antibiotic. We therefore speculate that melan-a melanocytes might be able to suppress the expression of potentially cytotoxic GFP products (Liu et al., 1999) without losing their antibiotic resistance.
We have also examined the potential use of fluorescent proteins found in melanosomes that are not specific for those organelles. As examples, LAMP-1 and LAMP-3 are membrane glycoproteins that are shared by lysosomes and melanosomes (Dell'Angelica et al., 2000). When transfected into human melanocytes, those constructs co-localized with the melanosome-specific markers NKI/BETEB (Figure 2C, 2D) and αPEP1 (data not shown), which recognize GP100 and TYRP1, respectively. Co-localization was seen around the nucleus but not in the dendrites. Seemingly, EGFP-LAMP-1 and EGFP-LAMP-3 are not sorted to melanosomes in significant amounts.
Another example is RAB27a, a GTPase of the Ras superfamily that functions in several regulated secretory pathways. RAB27a binds the melanosomal membrane in its activated (GTP-) form and regulates actin-dependent transport at the periphery of melanocytes via interaction with the motor protein MyosinVa. RAB27a mutations are found in patients suffering from Griscelli syndrome, a disease characterized by partial albinism and grey hair, apart from a severe immunodeficiency (Bahadoran et al., 2003; Westbroek et al., 2001, 2004). Staining of melanocytes, transfected with EGFP-RAB27a, with NKI/BETEB shows co-localisation in the sublemmal region, especially at the dendrite tips (Figure 2E). This construct could be useful for quantification of pigment transfer in melanocyte-keratinocyte co-cultures provided that RAB27a is transferred to keratinocytes during pigment transfer. RAB27a does not reside on the melanosomal membrane but rather cycles between a membrane-bound and –unbound state, possibly this protein is recruited from the melanosome before transfer takes place. Another possible drawback when trying to characterize the transfer process is the fact that EGFP-RAB27a will be replaced by unlabeled RAB27a once the melanosome enters a keratinocyte. .
Fluorescence using a Cysteine-Tag
Recombinant proteins can also be labeled by inserting a small motif containing the sequence – C-C-X-X-C-C-, then exposing the cells to a membrane-permeant nonfluorescent biarsenical derivative of fluorescein, FlAsH-EDT2 (Gaietta et al., 2002). FlAsH binds the tetracysteine motif and thereby becomes strongly fluorescent. The cysteine tag was connected to the transmembrane and signal domain of mouse TYRP1 and TYR and should be located inside the melanosome. After transfection of melan-a melanocytes with those constructs, they were stained with FlAsH. There was only a slight difference in the signal of the mock-transfected cells (Figure 3A) and the cysteine tag-transfected cells (Figure 3B), and the general fluorescence signal was lower than in non-transfected SP1 keratinocytes (figure 3C). In addition, dead cells and cellular debris created a high background although Patent Blue V was routinely used as a quenching agent. We also tried varying the EDT concentration with limited success. The results for TYRP1 were similar (data not shown). We conclude that this staining system is not an effective approach to develop an assay for melanosome transfer.
Figure 3. Cysteine-tag methods to fluorescently label melanosomes and incubation with Cy3-tyramide.
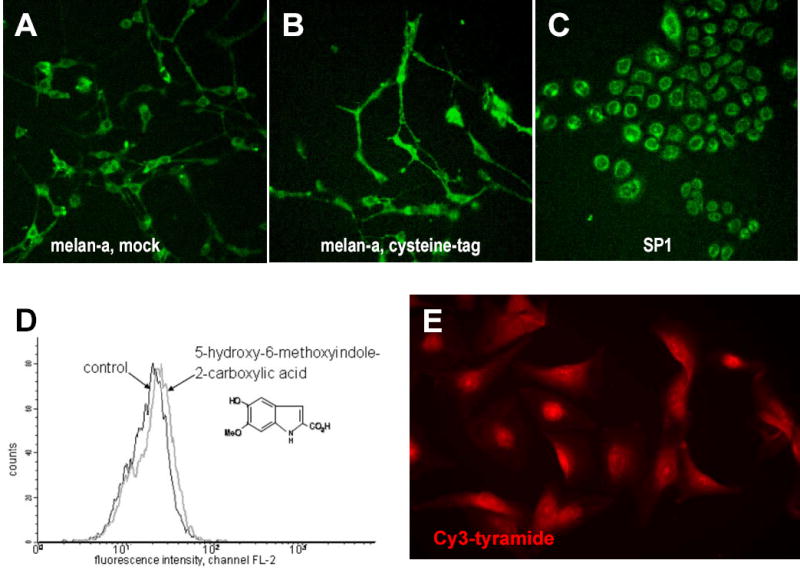
A-B) Melan-a melanocytes were transfected with mock- (A) or cysteine-tag DNA (B); staining was done with 2 μM FlAsH and 10 μM EDT 2 days after transfection. (C) SP1 keratinocytes stained as in (B). D) Melan-a melanocytes were incubated for 3 days with 5,6-dihydroxy-indole- 2-carboxylic acid and were analysed by FACS; a slight fluorescence is detected. E) Human melanocytes (culture method 2) incubated with Cy3-tyramide (25nM-5μM) for 4 h display a reticular fluorescent pattern with perinuclear accentuation.
Fluorescence using melanin intermediates
Yet another approach examined the feasibility of using auto-fluorescent melanin intermediates (Wakamatsu and Ito, 1990) which were added to cultures of melan-a melanocytes. We were unable to detect increases in fluorescence in 4 separate experiments by microscopy and the increase in fluorescence using FACS was minimal (Figure 3D). We conclude that these fluorescent melanin intermediates are not sufficiently fluorescent for use and/or are not transported efficiently into melanocytes and are therefore not an appropriate tool for analyzing melanosome transfer.
Tyramide is able to mimic tyrosine, the natural substrate of TYR, and is subsequently oxidized and deposited at centres of tyrosinase activity in histological sections (Han et al., 2002). Possibly, the deposition of tyramide is effectuated by its incorporation into melanin-like polymers. Cultures of human melanocytes were incubated with Cy3-tyramide to test whether tyramide is physiologically incorporated into melanin. The fluorescence, which was reticular with perinuclear accentuation (Figure 3E), was not compatible with incorporation of Cy3-tyramide into melanin and subsequent labeling of melanosomes.
Other Approaches - Thiouracil labeling
Having tried different live marker tools with limited success, we revisited the approach to label melanin with radioactive thiouracil. We characterized the uptake of thiouracil into primary human melanocytes with different levels of pigmentation (Figure 4A). Incorporation of thiouracil was linear over a 3 day incubation period and the incorporated thiouracil remained inside melanocytes for at least 3 more days (Figure 4B). Thiouracil incorporation by melanocytes of different donors against melanin content revealed a strong correlation (R2 = 0.86, data not shown). The incorporation was specific (as previously reported) since under similar conditions, primary human keratinocytes showed only 2% compared to uptake/binding to melanocytes. Therefore, 14C-thiouracil would be a suitable marker for melanosome transfer in co-culture with keratinocytes.
Figure 4. Identification of melanocytes by 14C-thiouracil and by phycoerythrin labeled antibodies.
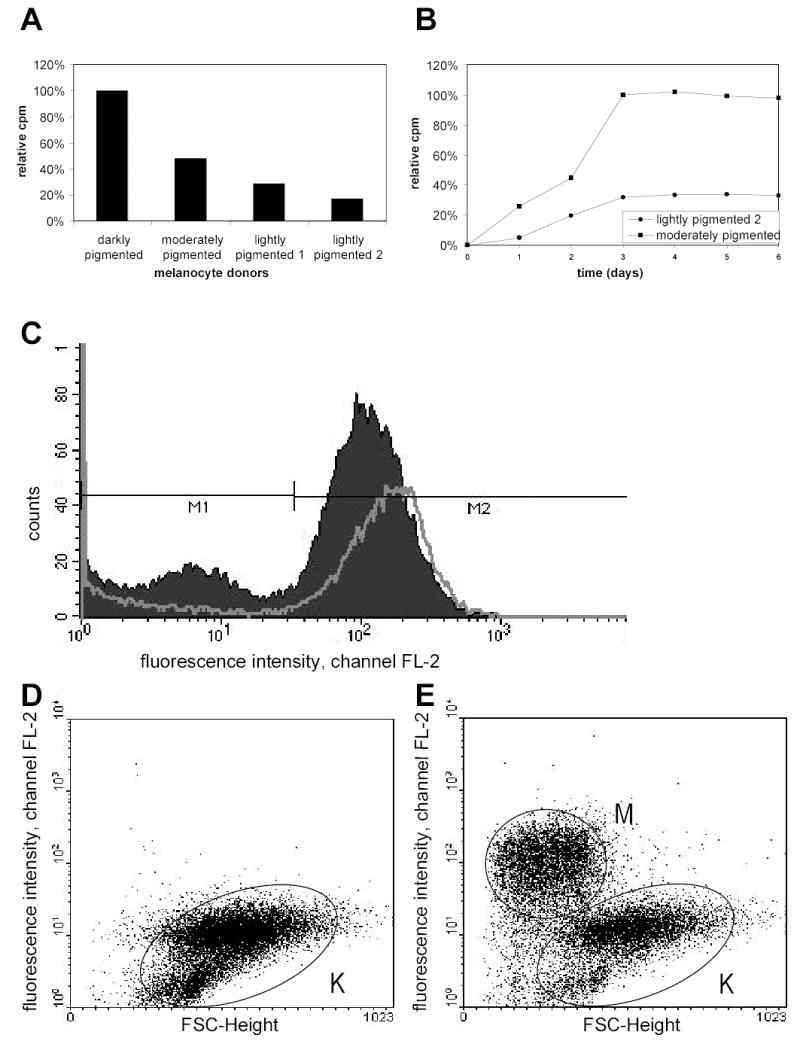
A) Primary human melanocytes with different degrees of pigmentation were incubated with 1 μCi 14C-thiouracil for 3 days; data reported show relative uptake of label. B) Two different human melanocyte monocultures were incubated with 1 μCi 14C-thiouracil for 3 days, the medium was replaced, and incorporation was measured for another 3 days. C) Keratinocytes and melanocytes in monoculture were stained with PE-labeled CD49f against keratinocyte-specific α-6 integrin, mixed and incubated with anti-PE beads from Miltenyi. Intervals M1 for melanocytes and M2 for keratinocytes were analyzed for values before and after magnetic separation. D–E) Keratinocytes and melanocytes in co-culture were stained with CD117-PE against melanocyte-specific c-kit, and incubated with anti-PE beads from Miltenyi. The negative fraction exclusively contained unlabeled cells, representing keratinocytes (K) (D). An important fraction of keratinocytes was present in the positive fraction in addition to the selected melanocytes (M) (E). (A–C, culture method 1; D–E, culture method 2).
Separation of melanocytes and keratinocytes by differential trypsinization and magnetic cell sorting
The next step then was to identify a method to separate radioactivity transferred to keratinocytes from melanocytes after their co-culture. We initially tried differential trypsination, based on the observation that melanocytes detach more quickly in the presence of trypsin than do keratinocytes from the plastic surface of culture dishes. However, about 30% of the total tyrosinase activity was detectable in the keratinocyte fraction, which demonstrated that the separation was not complete (data not shown).
Another approach to separate cells is magnetic bead separation. We tried selecting keratinocytes with CD49f against the keratinocyte-specific integrin a6 (Trempus et al., 2003). With the StemCell method, we achieved keratinocytes at 74% purity (starting from 40%) but with 83% loss after 3 washes (data not shown). Using MACS, we received the same purity of keratinocytes (Figure 4C) with only 41% loss. Assuming a value for transfer of melanin at ~10%, this degree of purity is simply too low to be useful in a melanosome transfer assay. At least 98% purity would probably be needed to obtain significant transfer results.
The other way round, melanocytes were labeled with CD117-PE against the human c-kit receptor and were positively selected by MACS. After separation of co-cultures, the negative, unlabeled fraction was free of melanocytes, as studied by FACS (Figure 5D). Cytospin preparations stained negative for NKI/BETEB, and were positive for anti-human cytokeratin (data not shown). However, a significant number of keratinocytes was retained on the column and was recovered in the positive fraction. This was confirmed by the presence of a significant percentage of CD117-negative cells in the positive fraction (Figure 5E) and an abundance of cytokeratin-positive cells in cytospin preparations of this fraction (data not shown). We tried to avoid retention of keratinocytes using Large Cell columns: a minimum of cells was present in the positive fraction (~25% of the number of melanocytes seeded) so we assumed that melanocytes were contaminating the negative fraction (this was not verified by FACS or by indirect immunofluorescence). In conclusion, we were able to isolate a pure fraction of keratinocytes by separation of co-cultures with MACS. However, this result was not satisfactory since a significant percentage of keratinocytes was present in the positive “melanocyte” fraction, and since we cannot exclude that the isolated fraction is not representative for all keratinocytes in terms of capability of receiving or retrieving melanosomes.
Figure 5. Competition of 14C-thiouracil incorporation into melanin by a thiouracil derivative and CFDA labeling of melanocytes.
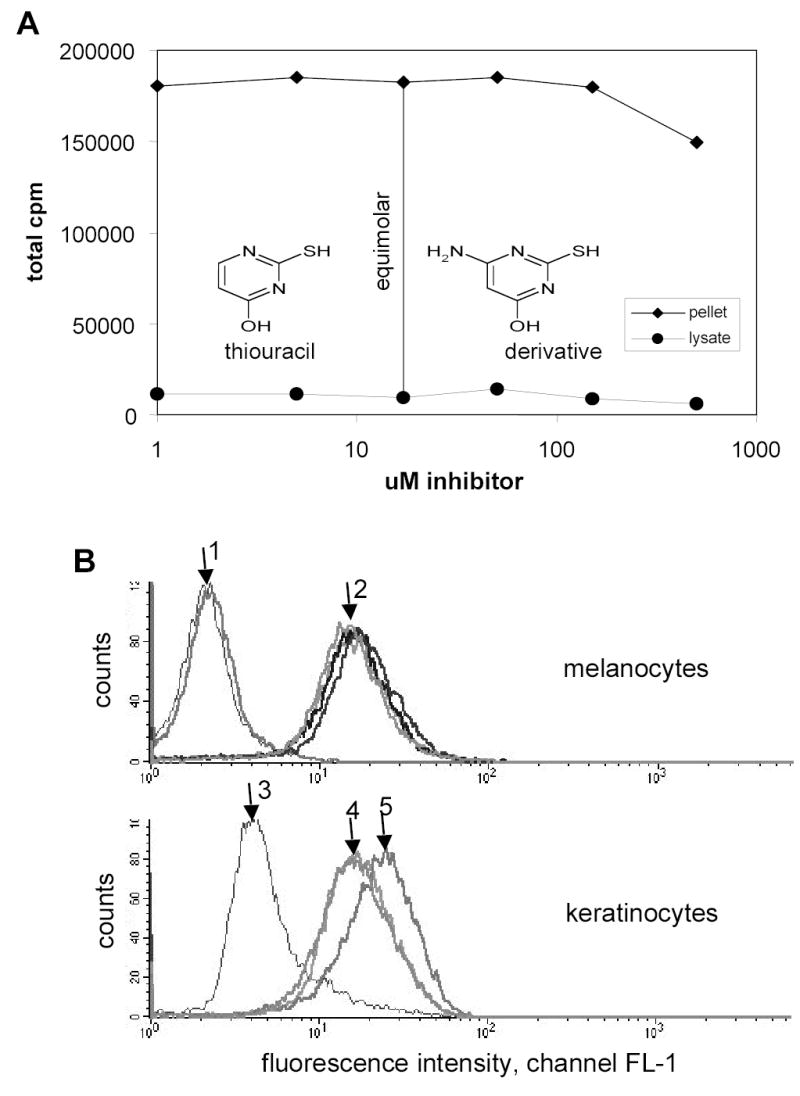
A) Human melanocytes were incubated with 1 μM 14C-thiouracil (17 μM) and different concentrations of 4-amino-6-hydroxy-2-mercaptopyrimidine for 3 days and the 14C content was measured in cell pellets and lysates by liquid scintillation counting. B) Fluorescence of human primary melanocytes and keratinocytes with or without CFDA labeling for 30 min and PE-αCD49f stain for keratinocytes after 3 days of incubation. Samples were incubated with pigmentation modifiers (10 μM forskolin or 150 μM α-lipoic acid). Upper graph: Arrow 1 shows 2 unstained melanocyte samples, arrow 2 from left to right the CFDA treated samples in combination with 10 μM forskolin-(light grey curve), 0.02% DMSO-treated control (black) and 30 μM lipoic acid (dark grey).. Lower graph: Control keratinocytes without CFDA labeling, arrow 3 shows an unstained sample, arrow 4 and 5 PE-αCD49f stained samples, with arrow 4 showing a 0.02% DMSO treated control (light grey) and a 30 μM lipoic acid (dark grey) treated sample, and arrow 5 a 10 μM forskolin treated sample. (culture method 1)
Another good option for separating keratinocytes and melanocytes would be FACS separation. This should be easily accomplished with the protocol introduced here, the major obstacle being whether one is allowed to use radioactivity in their FACS machine (which is generally not allowed).
Since radioactive thiouracil was such a sensitive and specific marker for melanin, we examined the possibility whether it was feasible to label thiouracil with a commercially available fluorescence probe rather than an isotope, which would enable us to separate melanocytes and keratinocytes by FACS. For labeling purposes, we checked 4-amino-6-hydroxy-2-mercaptopyrimidine, which has an additional primary amino group. However, a competition assay between 14C-thiouracil with said substance showed inhibition only at concentrations 100x higher than 14C-thiouracil concentrations (Figure 5A). Considering this loss of affinity results from the addition of only one amino group to the molecule, we would speculate that modifications with larger groups, such as a fluorophore, would even less favor the incorporation into newly synthesized melanin.
Unspecific CFDA labeling
Using a modified CFDA labeling method reported by Minwalla et al. (2001) for melanosomal transfer, we observed a relatively strong initial fluorescence, but that was lost rapidly and only a weak fluorescence was observed in human primary melanocytes after 5 days. The remaining melanocyte fluorescence (arrow 2 in figure 5B) was stronger than the background keratinocyte fluorescence (arrow 3), however, the background keratinocyte fluorescence increased with second antibody PE staining of the intracellular stain with a keratin marker (Minwalla et al, 2001; data not shown) as well as with our protocol to stain keratinocytes with PE pre-labeled CD49f-antibody directly (arrow 4). In addition, the fluorescence varied with incubation of test substances. Forskolin increased the background fluorescence such that an increase of fluorescence due to CFDA transfer could not be detected (arrow 5) whereas lipoic acid did not change the fluorescence properties significantly compared to the control. It must also be noted here that our media conditions and the source of primary cells were different from Minwallas’ approach The MCDB 153 medium (see Materials and methods) used in our system slowed cell growth compared to the M154 medium supplemented with different factors (Minwalla et al, 2001). We observed faster fluorescence loss with upregulated melanocyte proliferation. These results agreed with experiments using fast proliferating mouse melan-a melanocytes where CFDA fluorescence was down to backround levels 24 h after staining (data not shown). In sum, one should be aware of the limitations of the CFDA assay due to the influence of melanocyte proliferation, media conditions and test compounds.
In conclusion, this study has examined several independent approaches to establish assays to measure pigment transfer between donor melanocytes and acceptor keratinocytes. Several experimental setups, elaborated independently in our two labs, resulted in insufficient in vitro labeling of melanosomes that would allow characterization of pigment transfer processes in a sensitive and specific manner. Our hope is that others will avoid some pitfalls and perhaps use these results as a basis to establish such assays.
Materials and Methods
Materials
Chemicals were from Sigma Chemical Co (St. Louis, MO, USA) unless stated otherwise.
Tissue culture
Murine cells used included pigmented melan-a melanocytes (Bennett et al., 1987), nonpigmented melan-c melanocytes (Bennett et al., 1989) and SP-1 keratinocytes. Melan cells were maintained in RPMI 1640 medium supplemented with 5% fetal bovine serum (FBS), 50 U/ml penicillin, 50 μg/ml streptomycin, L-glutamine 0.08 % w/v sodium bicarbonate, 200 nM phorbol-12-myristate-13 acetate, and 100 μM 2-mercaptoethanol (all from Invitrogen, Carlsbad, CA, USA). SP-1 keratinocytes were grown in MEM containing 0.05 mM Ca2+, 8% Chelex treated heat inactivated FBS, 5 U/ml penicillin, 5 μg/ml streptomycin. Co-culture experiments were set up according to Lei at al. (2002) with an initial seeding ratio of keratinocytes and melanocytes being 5:1 in SP-1 medium.
Normal human neonatal epidermal melanocytes (HEMn) and keratinocytes (HEKn) were purchased from Cascade Biologics (Portland, OR, USA) and were maintained in M154 calcium free medium supplemented with Human Melanocyte Growth (HMGS) or Human Keratinocyte Growth Supplement (HKGS), 50 μg/ml streptomycin, 50 U/ml penicillin, and 0.1 mM Ca2+. For co-culture, keratinocytes were seeded in M154 medium and 24 h later melanocytes were seeded into the same wells in MCDB 153 medium (Biochrom AG, Berlin, Germany) supplemented with 0.5 ml insulin, 0.5 ml hydrocortisone, 0.5 ml transferrin, 0.5 ml epinephrine (Cambrex, East Rutherford, NJ, USA), 50 μg/ml streptomycin, 50 U/ml penicillin, 50 μl/ml GlutaMax (Invitrogen, Carlsbad, CA, USA), and 0.1 mM Ca2+, at a ratio of 2:1 for keratinocytes and melanocytes (culture method 1).
For differential trypsination, co-cultures were grown 3 days and trypsinized for 3 min at 23°C; the melanocytes were collected and the remaining cells were trypsinized for additional 7 min at 37ºC to harvest keratinocytes.
Normal human epidermal melanocytes were also obtained from neonatal foreskin and were cultured as described previously (Naeyaert et al., 1991). Normal human epidermal keratinocytes were cultured on irradiated 3T3 feeder cells according to Rheinwald and Green (1975), and were stored in liquid nitrogen. Upon thawing, they were grown in defined serum-free low-calcium keratinocyte medium (K-SFM) and used at their first or second passage. Co-cultures were established by seeding melanocytes and keratinocytes in a ratio of 3 to 10 in DMEM/Ham’s F12 (3:1), 10% fetal calf serum, 0.4 μg/ml hydrocortisone, 10−10 M cholera toxin, 5 μg/ml insulin, 8 x 10⁻⁴ M adenine, 5 μg/ml transferrin, 2 x 10⁻⁹ M triiodothyronine, 10 ng/ml epidermal growth factor and antibiotics. Culture media were obtained from Gibco BRL (Merelbeke, Belgium)(culture method 2).
Transient and stable transfection of melanocytes
Melan-a cells were seeded in 6-well dishes at a density of 500,000 cells/well 24 h prior to transfection and were transfected with Lipofectamin 2000 or Lipofectamin Plus, according to the manufacturers’ instructions (Invitrogen, Carlsbad, CA, USA). Additionally, a SV40 virus system was used as described before (Kimchi-Sarfaty et al., 2004). To select for stable transfected melan-a cells, 500 μg/ml of the antibiotic G-418 (Invitrogen, Carlsbad, CA, USA) was added to the medium. The Amaxa Nucleofectant system was also used with the reagent for neonatal human primary melanocytes and program T-20, according to the manufacturers’ instructions (Amaxa, Cologne, Germany). For transfection, 2 x 10⁶ cells were used and plated in 100 mm dishes directly after transfection. Quantification of transfection efficiency took place 48 h after transfection by FACS analysis with a FACS-Calibur (BD Biosciences, San Jose, CA, USA). In addition, 5,000 cells were seeded into 2-well LabTek chambers for analysis by confocal microscopy. To stimulate maturation of E(C)GFP-CYT-TYR constructs, bafilomycin A1 (25 nM), tyrosine (200 μM) or DOPA (50 μM) were added 5 h after transfection.
GFP constructs
Total RNA was extracted from primary human melanocytes using an RNA isolation kit (Qiagen, Venlo, the Netherlands). cDNA was prepared from total RNA using the Superscript enzyme (Invitrogen, Merelbeke, Belgium). Construction of specific oligonucleotide primers (Table 2) for PCR amplification of human TYR and TYRP1 were based on Genbank accession numbers NM_000372 and NM_000550, respectively. These primers introduced unique restriction sites at the 5′ and 3′ end of the cDNA regions of interest. Following amplification, the PCR products were digested with appropriate restriction enzymes and were subcloned into the same sites of a GFP expression vector. Expression vectors used were pEGFP-N1, pEGFP-C1 (BD Biosciences Clontech, Palo Alto, CA, USA) and pECGFP-C1. ECGFP (Genbank accession number AB041904) in the pRSETB vector was a kind gift of Dr. M. Atsushi (Brain Science Institute, Saitama, Japan). PCR was performed on this vector, introducing the restriction site NheI and the Kozak consensus sequence at the 5′ end of ECGFP and the restriction site XhoI and part of the multiple cloning site of pEGFP-C1 at the 3′ end of ECGFP. The pEGFP-C1 vector was cut with these restriction enzymes to remove EGFP, and ECGFP was cloned in its place. For the construction of IL-TYR-EGFP-CYT-TYR, the intralumenal part of TYR was cloned into the multiple cloning site of pEGFP-N1. This construct (IL-TYR-EGFP) was transformed in a methylase negative strain of E. Coli (Inv1.10, Invitrogen), and EGFP was subsequently removed by restriction with SacII and XbaI. PCR was performed on EGFP-CYT-TYR with the addition of SacII 5′ of EGFP and XbaI 3′ of CYT-TYR, and the PCR product was cloned in the empty IL-TYR-EGFP vector. Human RAB27a was cloned in the pEGFP-C1 vector at restriction sites EcoRI and KpnI. All fused sequences were in-frame, as verified by DNA sequencing. EGFP-LAMP1 and EGFP-LAMP3 were kind gifts of Dr. J. Neefjes. LAMP3 was cloned into the BamHI site of the pEGFP-C1 vector (Blott et al., 2001).
TABLE 2.
Primer summary
| Primer name | Use | sequence |
|---|---|---|
| CYS-sTyr f | mouse Tyr with Cystein tag | 5′- cgtagc(GATATC)atggtatgttgccctggttgctgctggcttcttggggc agcactg-3′ |
| sTyr r | mouse Tyr with Cystein tag | 5′-cgatac (AAGCTT)tcacagatggctctgatacag-3′ |
| sTyr f | mouse Tyr Ctrl | 5′-cgtagc(GATATC)tggcttcttggggcagca ctg-3′ |
| CYS-sTyrp1 f | mouse Tyrp1 with Cysteine tag | 5′-cgtagc(GATATC)atggtatgttgccctggttgctgcatcattaccattgctgtagtgg-3′ |
| sTyr r | mouse Tyrp1 with Cysteine tag | 5′-cgatac(AAGCTT)tcagaccatggagtggttagg-3′ |
| sTyr f | mouse Tyrp1 Ctrl | 5′-cgtagc(GATATC)atcattaccattgctgtagtg-3′ |
| Mart1 f | GFP-Mart1 and Mart1 GFP | 5′-ggaatt(CTCGAG)atgccccaagaagacattcactttg-3′ |
| GFP-Mart1 r | GFP-Mart1 | 5′-agaatt(GTCGAC)tcagggtgaataaggtggcggtgaag-3′ |
| Mart1-GFP r | Mart1-GFP | 5′-agaatt(GTCGAC)tcagggtgaataaggtggcggtgaagagag-3′ |
| GFP-Gp100 f | GFP-Gp100 | 5′-ctaaag(AGATCT)atggtgggtgtccagagaaggagcttc-3′ |
| GFP-Gp100 r | GFP-Gp100 | 5′-gtccta(GTCGAC)tcagacctgctgtccactgaggag-3′ |
| ECGFP f | ECGFP | 5′- cta(GCTAGC)gctaccggtcgccaccatggtgagcaagggcgagg- 3′ |
| ECGFP r | ECGFP | 5′-ccg(CTCGAG)atctgagtccggacttgtacagctcgtccatg-3′ |
| EGFP-TYRP1 f | EGFP-TYRP1
ECGFP-TYRP1 |
5′-ccg(CTCGAG)tgttttgcactcttatttcaagc-3′ |
| EGFP-TYRP1 r | EGFP-TYRP1
ECGFP-TYRP1 |
5′-ccg(GAATTC)ccaggtggttttgtgatacta-3′ |
| TYR-EGFP f | TYR-EGFP | 5′-ccg(CTCGAG)ggaagaatgctcctggctg-3′ |
| TYR-EGFP r | TYR-EGFP | 5′-ccg(GAATTC)ataaatggctctgatacaagc-3′ |
| TYRP1-EGFP f | TYRP1-EGFP | 5′-ccg(CTCGAG)ttgttttgcactcttatttcaag-3′ |
| TYRP1-EGFP r | TYRP1-EGFP | 5′-ccg(GAATTC)agaccacagactgattaggat-3′ |
| EGFP-CYT-TYR f | EGFP-CYT-TYR
ECGFP-CYT-TYR |
5′-cgg(GGTACC)atctggtcatggctccttgg-3′ |
| EGFP-CYT-TYR r | EGFP-CYT-TYR
ECGFP-CYT-TYR |
5′-cgc(GGATCC)taaatggctctgatacaagctg-3′ |
| IL-TYR-EGFP f | IL-TYR-EGFP | 5′-ccg(CTCGAG)ggaagaatgctcctggctg-3′ |
| IL-TYR-EGFP r | IL-TYR-EGFP | 5′-ccg(GAATTC)accagatccgactcgcttgt-3′ |
| IL-TYR-EGFP-CYT-TYR f | IL-EGFP-CYT-TYR | 5′-tcc(CCGCGG)gtcgccaccatggtgagca-3′ |
| IL-TYR-EGFP-CYT-TYR r | IL-EGFP-CYT-TYR | 5′-ctag(TCTAGA)taaatggctctgatacaagctg-3′ |
In addition, several mouse protein EGFP constructs were designed. Mouse Mart1 cDNA was received from Dr. Yutaka Kawakami (Keio University School of Medicine, Tokyo, Japan) and was amplified by PCR to indroduce XhoI (Mart1 f) and SalI restriction sites (GFP-Mart1 r and Mart1-GFP r)(Table 2). The amplified and cut product was subcloned into pEGFP-C3 and pEGFP-N3 vector (BD Biosciences Clontech, Palo Alto, CA, USA) to receive EGFP fusion proteins on the N-terminal as well as the C-terminal end of Mart1. Mouse Gp100 cDNA was a kind gift of Dr. Nicholas Restifo (National Institutes of Health, Bethesda, MD, USA) and was amplified by PCR to introduce BglII (GFP-Gp100 f) and SalI restriction sites (GFP-Gp100 r)(Table 2). The amplified and cut product was subcloned into pEGFP-C3.
Cysteine-tag constructs
Mouse Tyr cDNA was a kind gift of Dr. Hiroaki Yamamoto (Tohoku University, Sendai, Japan) and was amplified by PCR using the primers described below. The pHDMT4 vector containing mouse Tyrp1 cDNA was a kind gift of Dr. G. Schutz (German Cancer Research Center, Heidelberg, Germany). Primers were designed to artificially introduce EcoRV and HindIII recognition sites (in brackets) at the extremities for further cloning into the pCMV-Script vector (Stratagene, La Jolla, CA, USA). Also introduced was the cysteine tag sequence (Cys-Cys-Pro-Gly-Cys-Cys, underlined) on the 5′-end of a truncated Tyr/Tyrp1 sequence containing the transmembrane and the melanosome sorting sequence (CYS-sTyr/Tyrp1 f primer). As a negative control for transfection experiments, we used the amplification product of a primer without the cysteine tag sequence (sTyr/Tyrp1 f primer) with the same reverse primer (sTyr/Tyrp1 r).
Staining of cysteine-tag products
Cells were stained with 2 μM FlAsH (Fluorescein-derived bi-arsenical labeling reagent, Invitrogen, Carlsbad, CA, USA) diluted into MCDB 153 medium containing different amounts of 1,2-ethandithiol (EDT) and 1 mM Patent Blue V to reduce background staining, and 10 mM glucose (Griffin et al., 2000).
Immunofluorescence staining
Melan-a cells were stained as described previously (Toyofuku et al., 2001). Briefly, cells were transfected with Mart1-GFP and fixed with 4% paraformaldehyde for 15 min at 4ºC. After blocking for 1 h at room temperature (RT), the cells were incubated with either αPEP7 (rabbit polyclonal) or HMB45 (mouse monoclonal) antibodies overnight at 4ºC. The cells were then labeled with Texas red anti-rabbit or anti-mouse (Vector laboratories, Burlingame, CA) for 1 h at room temperature. Next, cells were counterstained with DAPI and mounted. Fluorescence signals were classified into three categories, according to whether they showed green, red, or yellow fluorescence. The latter was indicative of co-localization of the red and green fluorescence signals. Images were obtained using the LSM 510 confocal microscope (Zeiss, Wetzlar, Germany).
HEMn were stained using the protocol described by Vancoillie et al. (2000). Briefly, 24 h after transfection, cells were fixed with 3% paraformaldehyde for 20 min at room temperature. Primary antibodies used were: mouse monoclonal NKI/BETEB (1:40) (Sanbio, Uden, the Netherlands), rabbit polyclonal αPEP1 (1:200) and rabbit polyclonal anti-calreticulin (1:200) (Affinity Bio Reagents, Golden, CO, USA). Cells were incubated with the primary antibody for 2 h and, after washing, cells were stained with the secondary antibody for 1 h. Slides were mounted and viewed with a Leica TCS SP2 confocal microscope, using a 63x lens.
Fluorescent melanin intermediates
Melan-a cultures were cultivated with 4 different fluorescent melanin intermediates (Wakamatsu and Ito, 1990): 5-hydroxy-6-methoxyindole-2-carboxylic acid (5H6MI2C), 6-hydroxy-5-methoxyindole-2-carboxylic acid (6H5MI2C), 5-hydroxy-6-methoxyindole (5H6MI), and 6-hydroxy-5-methoxyindole (6H5MI) (kindly provided by Prof. Shosuke Ito, Fujita Health University School of Health Sciences, Toyoake, Aichi, Japan). Cells were trypsinized and analyzed with a FACS-Calibur (BD Biosciences, San Jose, CA, USA). Normal human epidermal melanocytes (culture method 2) were cultivated with cyanin3 linked to the amino-terminus of tyramide (Cy3-tyramide, kind gift of Dr. A. K. Raap, LUMC, the Netherlands). Medium was refreshed 24 h before the experiment. Cells were incubated with different concentrations (25 nM -5 μM) for 4 h at 37°C, washed with PBS and viewed 24 h later with an inverted Axiovert 200M Zeiss microscope.
14C-thiouracil incorporation and total melanin amount
Melanocytes were labeled with 1 μCi/ml 14C-thiouracil (Amersham, Freiburg, Germany) for 3 day. Cells were washed with PBS twice, harvested and lysed in 0.1 M Tris/HCl, pH 7.2, containing 0.01% SDS, 1% Igepal and Complete TM (Roche, Palo Alto, CA) for 1 h at 4ºC. After centrifugation at 16,000x g the pellet was completely lysed in 1 M NaOH containing 10% DMSO at 80ºC for 30 min and neutralized. Incorporated radioactivity was measured with liquid scintillation counting. For total melanin amount samples were measured at 470 nm absorption.
The inhibition of thiouracil incorporation was tested with 1 μCi/ml 14C-thiouracil (17 μM) and different concentrations of 4-amino-6-hydroxy-2-mercaptopyrimidine. Incorporation into melanin in the pellets and in the supernatants was measured by liquid scintillation counting.
FACS staining and magnetobead separation
Monocultures of keratinocytes and melanocytes were trypsinized and stained with PE-anti-CD49f antibody (dilution 1:100, BD Biosciences, San Jose, CA, USA) diluted in PBS containing 10% human serum for 30 min at room temperature in the dark, washed twice and analyzed with a FACS-Calibur (BD Biosciences, San Jose, CA, USA). For further magnetobead separation, two methods employing anti-PE beads were used, according to the manufacturers’ instructions (StemCell Technologies, Vancover, Canada; Miltenyi Biotec, Bergisch Gladbach, Germany).
Co-cultures of keratinocytes and melanocytes were also separated with the magnetobead separation kit from Miltenyi Biotec, by positive selection of melanocytes using anti-human CD117-PE (BD Biosciences). Cells were applied onto MS or Large Cell separation columns placed in the magnetic field of a MiniMACS separator. Positive and negative fractions were collected and cell numbers were determined. Samples of each fraction were analyzed in a FACScan (BD Biosciences). Samples were also used for cytospin preparation and immunocytochemistry with the melanocyte-specific antibody, NKI/BETEB, and the keratinocyte-specific antibody, anti-human Cytokeratin clone LP34 (DakoCytomation, Glostrup, Denmark).
CFDA staining
Melanocytes were stained with CFDA (Molecular Probes, Eugene, OR, USA) for 30 min, washed twice with PBS and seeded with keratinocytes as detailed before (culture method 1). Medium was changed after 24 h and various compounds were added. Co-cultures were trypsinized after 3 more days, washed once with PBS and stained with PE-anti CD49f antibody as detailed above.
Acknowledgments
We thank Harald Peeters for help with FACS analysis, Frans Van Nieuwpoort and Martine De Mil for cell culture and Marie-Chantal Herteleer for technical assistance. This work was supported by a grant from the University of Ghent (B/03851).
Footnotes
Werner Berens and Karolien Van Den Bossche contributed equally to this work.
This research was published in Pigment Cell Research, Vol. 18, pp. 370-81 (2005). The definitive version is available at www.blackwell-synergy.com: http://www.blackwell-synergy.com/doi/full/10.1111/j.1600-0749.2005.00263.x
References
- Adams SR, Campbell RE, Gross LA, Martin BR, Walkup GK, Yao Y, Llopis J, Tsien RY. New biarsenical ligands and tetracysteine motifs for protein labeling in vitro and in vivo: synthesis and biological applications. J Am Chem Soc. 2002;124:6063–6076. doi: 10.1021/ja017687n. [DOI] [PubMed] [Google Scholar]
- Ancans J, Thody AJ. Activation of melanogenesis by vacuolar type H(+)-ATPase inhibitors in amelanotic, tyrosinase positive human and mouse melanoma cells. FEBS Lett. 2000;478:57–60. doi: 10.1016/s0014-5793(00)01795-6. [DOI] [PubMed] [Google Scholar]
- Babiarz-Magee L, Chen N, Seiberg M, Lin CB. The expression and activation of protease-activated receptor-2 correlate with skin color. Pigment Cell Res. 2004;17:241–251. doi: 10.1111/j.1600-0749.2004.00133.x. [DOI] [PubMed] [Google Scholar]
- Bahadoran P, Busca R, Chiaverini C, Westbroek W, Lambert J, Bille K, Valony G, Fukuda M, Naeyaert JM, Ortonne JP, Ballotti R. Characterization of the molecular defects in Rab27a, caused by RAB27A missense mutations found in patients with Griscelli syndrome. J Biol Chem. 2003;278:11386–11392. doi: 10.1074/jbc.M211996200. [DOI] [PubMed] [Google Scholar]
- Basrur V, Yang F, Kushimoto T, Higashimoto Y, Yasumoto K, Valencia J, Muller J, Vieira WD, Watabe H, Shabanowitz J, et al. Proteomic analysis of early melanosomes: identification of novel melanosomal proteins. J Proteome Res 2003;2:69–79. doi: 10.1021/pr025562r. [DOI] [PubMed] [Google Scholar]
- Bennett DC, Cooper PJ, Dexter TJ, Devlin LM, Heasman J, Nester B. Cloned mouse melanocyte lines carrying the germline mutations albino and brown: complementation in culture. Development. 1989;105:379–385. doi: 10.1242/dev.105.2.379. [DOI] [PubMed] [Google Scholar]
- Bennett DC, Cooper PJ, Hart IR. A line of non-tumorigenic mouse melanocytes, syngeneic with the B16 melanoma and requiring a tumour promoter for growth. Int J Cancer. 1987;39:414–418. doi: 10.1002/ijc.2910390324. [DOI] [PubMed] [Google Scholar]
- Blott EJ, Bossi G, Clark R, Zvelebil M, Griffiths GM. Fas ligand is targeted to secretory lysosomes via a proline-rich domain in its cytoplasmic tail. J Cell Sci. 2001;114:2405–2416. doi: 10.1242/jcs.114.13.2405. [DOI] [PubMed] [Google Scholar]
- Chen K, Manga P, Orlow SJ. Pink-eyed dilution protein controls the processing of tyrosinase. Mol Biol Cell. 2002a;13:1953–1964. doi: 10.1091/mbc.02-02-0022.. [DOI] [PMC free article] [PubMed] [Google Scholar]
- Chen K, Minwalla L, Ni L, Orlow SJ. Correction of defective early tyrosinase processing by bafilomycin A1 and monensin in pink-eyed dilution melanocytes. Pigment Cell Res. 2004;17:36–42. doi: 10.1046/j.1600-0749.2003.00106.x. [DOI] [PubMed] [Google Scholar]
- Chen Y, Samaraweera P, Sun TT, Kreibich G, Orlow SJ. Rab27b association with melanosomes: dominant negative mutants disrupt melanosomal movement. J Invest Dermatol. 2002b;118:933–940. doi: 10.1046/j.1523-1747.2002.01754.x. [DOI] [PubMed] [Google Scholar]
- Cubitt AB, Heim R, Adams SR, Boyd AE, Gross LA, Tsien RY. Understanding, improving and using green fluorescent proteins. Trends Biochem Sci. 1995;20:448–455. doi: 10.1016/s0968-0004(00)89099-4. [DOI] [PubMed] [Google Scholar]
- Dell’Angelica EC, Mullins C, Caplan S, Bonifacino JS. Lysosome-related organelles. Faseb J. 2000;14:1265–1278. doi: 10.1096/fj.14.10.1265. [DOI] [PubMed] [Google Scholar]
- Ellgaard L, Helenius A. Quality control in the endoplasmic reticulum. Nat Rev Mol Cell Biol. 2003;4:181–191. doi: 10.1038/nrm1052. [DOI] [PubMed] [Google Scholar]
- Fuller BB, Spaulding DT, Smith DR. Regulation of the catalytic activity of preexisting tyrosinase in black and Caucasian human melanocyte cell cultures. Exp Cell Res. 2001;262:197–208. doi: 10.1006/excr.2000.5092. [DOI] [PubMed] [Google Scholar]
- Gaietta G, Deerinck TJ, Adams SR, Bouwer J, Tour O, Laird DW, Sosinsky GE, Tsien RY, Ellisman MH. Multicolor and electron microscopic imaging of connexin trafficking. Science. 2002;296:503–507. doi: 10.1126/science.1068793. [DOI] [PubMed] [Google Scholar]
- Griffin BA, Adams SR, Jones J, Tsien RY. Fluorescent labeling of recombinant proteins in living cells with FlAsH. Methods Enzymol. 2000;327:565–578. doi: 10.1016/s0076-6879(00)27302-3. [DOI] [PubMed] [Google Scholar]
- Halaban R, Cheng E, Svedine S, Aron R, Hebert DN. Proper folding and endoplasmic reticulum to golgi transport of tyrosinase are induced by its substrates, DOPA and tyrosine. J Biol Chem. 2001;276:11933–11938. doi: 10.1074/jbc.M008703200. [DOI] [PubMed] [Google Scholar]
- Han R, Baden HP, Brissette JL, Weiner L. Redefining the skin’s pigmentary system with a novel tyrosinase assay. Pigment Cell Res. 2002;15:290–297. doi: 10.1034/j.1600-0749.2002.02027.x. [DOI] [PubMed] [Google Scholar]
- Hoashi, T., Watabe, H., Muller, J., Yamaguchi, Y., Vieira, W. D., and Hearing, V. J. (2005). Mart-1 is required for the function of melanosomal matrix protein PMEL17/GP100 and the maturation of melanosomes. J Biol Chem. in press [DOI] [PubMed]
- Inouye S, Tsuji FI. Evidence for redox forms of the Aequorea green fluorescent protein. FEBS Lett. 1994;351:211–214. doi: 10.1016/0014-5793(94)00859-0. [DOI] [PubMed] [Google Scholar]
- Kimchi-Sarfaty C, Alexander NS, Brittain S, Ali S, Gottesman MM. Transduction of multiple cell types using improved conditions for gene delivery and expression of SV40 pseudovirions packaged in vitro. Biotechniques. 2004;37:270–275. doi: 10.2144/04372RR04. [DOI] [PubMed] [Google Scholar]
- Kushimoto T, Valencia JC, Costin GE, Toyofuku K, Watabe H, Yasumoto K, Rouzaud F, Vieira WD, Hearing VJ. The Seiji memorial lecture: the melanosome: an ideal model to study cellular differentiation. Pigment Cell Res. 2003;16:237–244. doi: 10.1034/j.1600-0749.2003.00034.x. [DOI] [PubMed] [Google Scholar]
- Lei TC, Virador VM, Vieira WD, Hearing VJ. A melanocyte-keratinocyte coculture model to assess regulators of pigmentation in vitro. Anal Biochem. 2002;305:260–268. doi: 10.1006/abio.2002.5665. [DOI] [PubMed] [Google Scholar]
- Liu HS, Jan MS, Chou CK, Chen PH, Ke NJ. Is green fluorescent protein toxic to the living cells? Biochem Biophys Res Commun 1999;260:712–717. doi: 10.1006/bbrc.1999.0954. [DOI] [PubMed] [Google Scholar]
- Minwalla L, Zhao Y, Cornelius J, Babcock GF, Wickett RR, Le Poole IC, Boissy RE. Inhibition of melanosome transfer from melanocytes to keratinocytes by lectins and neoglycoproteins in an in vitro model system. Pigment Cell Res. 2001;14:185–194. doi: 10.1034/j.1600-0749.2001.140308.x. [DOI] [PubMed] [Google Scholar]
- Naeyaert JM, Eller M, Gordon PR, Park HY, Gilchrest BA. Pigment content of cultured human melanocytes does not correlate with tyrosinase message level. Br J Dermatol. 1991;125:297–303. doi: 10.1111/j.1365-2133.1991.tb14161.x. [DOI] [PubMed] [Google Scholar]
- Napolitano A, Palumbo A, d’Ischia M, Prota G. Mechanism of selective incorporation of the melanoma seeker 2-thiouracil into growing melanin. J Med Chem. 1996;39:5192–5201. doi: 10.1021/jm9605243. [DOI] [PubMed] [Google Scholar]
- Palumbo A, Napolitano A, De Martino L, Vieira W, Hearing VJ. Specific incorporation of 2-thiouracil into biological melanins. Biochim Biophys Acta. 1994;1200:271–276. doi: 10.1016/0304-4165(94)90167-8. [DOI] [PubMed] [Google Scholar]
- Rheinwald JG, Green H. Serial cultivation of strains of human epidermal keratinocytes: the formation of keratinizing colonies from single cells. Cell. 1975;6:331–343. doi: 10.1016/s0092-8674(75)80001-8. [DOI] [PubMed] [Google Scholar]
- Sawano A, Miyawaki A. Directed evolution of green fluorescent protein by a new versatile PCR strategy for site-directed and semi-random mutagenesis. Nucleic Acids Res. 2000;28:E78. doi: 10.1093/nar/28.16.e78. [DOI] [PMC free article] [PubMed] [Google Scholar]
- Seiberg M. Keratinocyte-melanocyte interactions during melanosome transfer. Pigment Cell Res. 2001;14:236–242. doi: 10.1034/j.1600-0749.2001.140402.x. [DOI] [PubMed] [Google Scholar]
- Sharlow ER, Paine CS, Babiarz L, Eisinger M, Shapiro S, Seiberg M. The protease-activated receptor-2 upregulates keratinocyte phagocytosis. J Cell Sci. 2000;113(Pt 17):3093–3101. doi: 10.1242/jcs.113.17.3093. [DOI] [PubMed] [Google Scholar]
- Tadokoro, T., Yamaguchi, Y., Batzer, J., Coelho, S. G., Zmudzka, B. Z., Miller, S. A., Wolber, R., Beer, J. Z., and Hearing, V. J. (2005). Mechanisms of Skin Tanning in Different Racial/Ethnic Groups in Response to Ultraviolet Radiation. J Invest Dermatol. in press. [DOI] [PubMed]
- Toyofuku K, Wada I, Valencia JC, Kushimoto T, Ferrans VJ, Hearing VJ. Oculocutaneous albinism types 1 and 3 are ER retention diseases: mutation of tyrosinase or Tyrp1 can affect the processing of both mutant and wild-type proteins. Faseb J. 2001;15:2149–2161. doi: 10.1096/fj.01-0216com. [DOI] [PubMed] [Google Scholar]
- Trempus CS, Morris RJ, Bortner CD, Cotsarelis G, Faircloth RS, Reece JM, Tennant RW. Enrichment for living murine keratinocytes from the hair follicle bulge with the cell surface marker CD34. J Invest Dermatol. 2003;120:501–511. doi: 10.1046/j.1523-1747.2003.12088.x. [DOI] [PubMed] [Google Scholar]
- Vancoillie G, Lambert J, Mulder A, Koerten HK, Mommaas AM, Van Oostveldt P, Naeyaert JM. Kinesin and kinectin can associate with the melanosomal surface and form a link with microtubules in normal human melanocytes. J Invest Dermatol. 2000;114:421–429. doi: 10.1046/j.1523-1747.2000.00896.x. [DOI] [PubMed] [Google Scholar]
- Virador VM, Muller J, Wu X, Abdel-Malek ZA, Yu ZX, Ferrans VJ, Kobayashi N, Wakamatsu K, Ito S, Hammer JA, Hearing VJ. Influence of alpha-melanocyte-stimulating hormone and ultraviolet radiation on the transfer of melanosomes to keratinocytes. Faseb J. 2002;16:105–107. doi: 10.1096/fj.01-0518fje. [DOI] [PubMed] [Google Scholar]
- Wakamatsu K, Ito S. Identification of ester glucuronide and sulfate conjugates of 5-hydroxy-6-methoxyindole-2-carboxylic acid and 6-hydroxy-5-methoxyindole-2-carboxylic acid in melanoma urine. J Dermatol Sci. 1990;1:253–259. doi: 10.1016/0923-1811(90)90117-v. [DOI] [PubMed] [Google Scholar]
- Watabe H, Valencia JC, Yasumoto K, Kushimoto T, Ando H, Muller J, Vieira WD, Mizoguchi M, Appella E, Hearing VJ. Regulation of tyrosinase processing and trafficking by organellar pH and by proteasome activity. J Biol Chem. 2004;279:7971–7981. doi: 10.1074/jbc.M309714200. [DOI] [PubMed] [Google Scholar]
- Westbroek W, Lambert J, Bahadoran P, Busca R, Herteleer MC, Smit N, Mommaas M, Ballotti R, Naeyaert JM. Interactions of human Myosin Va isoforms, endogenously expressed in human melanocytes, are tightly regulated by the tail domain. J Invest Dermatol. 2003;120:465–475. doi: 10.1046/j.1523-1747.2003.12068.x. [DOI] [PubMed] [Google Scholar]
- Westbroek W, Lambert J, De Schepper S, Kleta R, Van Den Bossche K, Seabra MC, Huizing M, Mommaas M, Naeyaert JM. Rab27b is up-regulated in human Griscelli syndrome type II melanocytes and linked to the actin cytoskeleton via exon F-Myosin Va transcripts. Pigment Cell Res. 2004;17:498–505. doi: 10.1111/j.1600-0749.2004.00173.x. [DOI] [PubMed] [Google Scholar]
- Westbroek W, Lambert J, Naeyaert JM. The dilute locus and Griscelli syndrome: gateways towards a better understanding of melanosome transport. Pigment Cell Res. 2001;14:320–327. doi: 10.1034/j.1600-0749.2001.140503.x. [DOI] [PubMed] [Google Scholar]
- Whittaker JR. Biosynthesis of a thouracil pheomelanin in embryonic pigment cells exposed to thouracil. J Biol Chem. 1971;246:6217–6226. [PubMed] [Google Scholar]
- Yasumoto K, Watabe H, Valencia JC, Kushimoto T, Kobayashi T, Appella E, Hearing VJ. Epitope mapping of the melanosomal matrix protein gp100 (PMEL17): rapid processing in the endoplasmic reticulum and glycosylation in the early Golgi compartment. J Biol Chem. 2004;279:28330–28338. doi: 10.1074/jbc.M401269200. [DOI] [PubMed] [Google Scholar]
- Yoon TJ, Lei TC, Yamaguchi Y, Batzer J, Wolber R, Hearing VJ. Reconstituted 3-dimensional human skin of various ethnic origins as an in vitro model for studies of pigmentation. Anal Biochem. 2003;318:260–269. doi: 10.1016/s0003-2697(03)00172-6. [DOI] [PubMed] [Google Scholar]