Abstract
A recombinant rabies virus (RV) carrying two identical glycoprotein (G) genes (SPBNGA-GA) was constructed and used to determine the effect of RV G overexpression on cell viability and immunity. Immunoprecipitation analysis and flow cytometry showed that tissue culture cells infected with SPBNGA-GA produced, on average, twice as much RV G as cells infected with RV carrying only a single RV G gene (SPBNGA). The overexpression of RV G in SPBNGA-GA-infected NA cells was paralleled by a significant increase in caspase 3 activity followed by a marked decrease in mitochondrial respiration, neither of which was observed in SPBNGA-infected cells. Furthermore, fluorescence staining and confocal microscopy revealed an increased extent of apoptosis and markedly reduced neurofilament and F actin in SPBNGA-GA-infected primary neuron cultures compared with neuronal cells infected with SPBNGA, supporting the concept that RV G or motifs of the RV G gene trigger the apoptosis cascade. Mice immunized with SPBNGA-GA showed substantially higher antibody titers against the RV G and against the nucleoprotein than SPBNGA-immunized mice, suggesting that the speed or extent of apoptosis directly determines the magnitude of the antibody response.
The rabies virus (RV) glycoprotein (G) is the major contributor to pathogenicity of the virus but is also the major antigen responsible for the induction of protective immunity. The RV G facilitates the interaction with appropriate cell surface molecules that can mediate rapid virus uptake by neuronal cells (6, 8, 26) and is essential for efficient virus budding through interaction with the RV RNP-M complex (14, 15). On the other hand, the RV G is also the predominant viral antigen that induces the production of virus-neutralizing antibodies (VNA), the major effectors against rabies (3, 9). The capacity of G to trigger the production of VNA depends largely on the integrity of the G protein spikes, which are composed of trimers of RV G (5). For example, soluble RV G, which lacks the cytoplasmic domain but which otherwise embodies the complete antigenic structure of G, is a very poor immunogen compared to intact virus particles (7). However, besides the structural features of RV G, a variety of other factors, in particular host cell factors, such as cytokines, contribute significantly to the development of immunity against rabies (11). Several events that are involved in the pathogenesis of rabies may also play a pivotal role in induction of antiviral immunity (20), a notion supported by the observations that the pathogenicity of a particular RV variant appears to correlate inversely with RV G expression levels and that increased G accumulation correlates with the induction of apoptosis (10, 17). These findings, together with the well-known fact that nonpathogenic RV strains, not pathogenic RV strains, induce a strong antiviral immune response (29), suggest an association between RV G expression, apoptosis, RV pathogenicity, and antiviral immunity.
Several observations suggest that enhanced apoptosis contributes to the induction of immune responses. For example, the apoptotic death of cells after viral infection can trigger powerful innate and adaptive immune responses (21) and cell injury leads to release of endogenous adjuvants that stimulate cytotoxic T-cell responses (27). Moreover, apoptotic cells can trigger the maturation and antigen-presenting function of dendritic cells, and cells undergoing massive apoptosis are believed to release factors that induce the activation of class I- and class II-restricted T cells by mature dendritic cells (2, 22). It has also been shown that apoptotic bodies have an exceptional ability to deliver antigens to professional antigen-presenting cells (23). Finally, our recent study demonstrated that infection with a recombinant RV expressing proapoptotic protein cytochrome c induced a strong increase in the antiviral immune response coupled with a marked reduction in pathogenicity (20).
Although the mechanism(s) by which the RV G can cause apoptosis is not known, the quantity of G expressed on the cell surface appears to be a critical factor in triggering apoptosis pathways. The finding that infections with highly pathogenic RVs, in particular street RVs such as the silver-haired bat-associated RV, result in much lower G expression in infected neurons and cause significantly less apoptotic cell death in neurons than infection with less-pathogenic RVs (32) supports the quantitative importance of RV G. However, since the Gs of the pathogenic RVs differ substantially in their amino acid sequences from those of the highly proapoptotic attenuated RVs (19), a role for qualitative attributes of G in determining its apoptogenic properties cannot be excluded.
In this study, we used reverse genetics to construct a recombinant RV that contains two identical G genes. Infection with this recombinant virus resulted in significantly higher G expression levels, which were paralleled by enhanced apoptosis and a significantly increased immune response against rabies.
MATERIALS AND METHODS
Viruses, viral antigens, and cells.
CVS-N2c is a subclone of the mouse-adapted CVS-24 RV (16). The recombinant RV SN10 was generated from a SAD B19 cDNA clone as described previously (18, 24, 25). RV G and RV RNP were isolated from purified SN10 virus or SN10-infected cells as described previously (4). Neuroblastoma NA cells of A/J mouse origin were grown at 37°C in RPMI 1640 medium supplemented with 10% fetal bovine serum (FBS). BSR cells, a cloned line derived from BHK-21 cells, were grown at 37°C in Dulbecco's modified Eagle's medium supplemented with 10% FBS. Primary neuron cultures were prepared from the hippocampi of prenatal Swiss Webster mice as described previously (17).
Construction of highly attenuated RVs expressing one or two identical G proteins.
To further reduce the pathogenicity of previously described RV vaccine vector SPBN (13), the SPBN G gene was replaced with a similar G gene encoding a single amino acid exchange, Arg333→Glu333 (AGA→GAG). For this approach, the RV G gene was amplified by PCR using Vent polymerase (New England Biolabs, Beverly, Mass.) from SN10-333 (18) and cloned into SPBN. The resulting plasmid was designated pSPBN-GA. To construct a recombinant RV expressing two identical RV Gs, the G gene was amplified by PCR using Vent polymerase, with SN10-333 as a template, and primers SN-10 BsiWI (sense; CGATGTATACGTACGAAGATGTTCCTCAGCTCTCCTG [BsiWI site underlined, start codon in boldface]), and SN-10 NheI (antisense; CTTATCAGCTAGCTAGCTAGTTACAGTCTGTCTCACCCCCA [NheI site underlined, stop codon in boldface]. The PCR product was digested with BsiWI and NheI (New England Biolabs) and ligated to pSPBNGA, which had been digested previously with BsiWI and NheI. The resulting plasmid was designated pSPBNGA-GA (Fig. 1). The sequences of both GA genes were confirmed by restriction analysis and DNA sequencing.
FIG. 1.
Schematic diagram of RV recombinant virus carrying an extra homologous G gene. The SPBNGA vector was derived from SPBN. The G gene was replaced with a similar G gene encoding an amino acid exchange from Arg333 to Glu333 (SPBNGA). SPBNGA-GA contains the same G as SPBNGA in duplicate.
Recombinant viruses were rescued as described previously (18, 24, 25). Briefly, BSR-T7 cells were transfected with a calcium phosphate transfection kit (Stratagene, La Jolla, Calif.) with 5.0 μg of pSPBNGA or pSPBNGA-GA and 5.0 μg of pTIT-N, 2.5 μg of pTIT-P, 2.5 μg of pTIT-L, and 2.0 μg of pTIT-G. After a 3-day incubation, supernatants were transferred onto BSR cells, and incubation continued for 3 days at 37°C. Cells were examined for the presence of rescued virus by immunostaining with fluorescein isothiocyanate (FITC)-labeled anti-RV N protein antibody (Centocor, Malvern, Pa.). The correct nucleotide sequences of the inserted genes were confirmed by reverse transcription-PCR and DNA sequencing.
Virus infectivity assay.
Infectivity assays were performed at 34 or 37°C on monolayers of NA or BSR cells in 96-well plates as described previously (29). All titrations were carried out in triplicate.
Immunoprecipitation analysis.
NA cells grown in T 25 tissue culture flasks were infected with SPBNGA or SPBNGA-GA at a multiplicity of infection (MOI) of 5 and incubated for 24 h with [35S]methionine (10 μCi/ml) at 37°C. A mixture of monoclonal antibodies against the RV G, N, and NS proteins (16) and a polyclonal rabbit antibody against actin (Sigma, St. Louis, Mo.) were used for immunoprecipitation. The labeled immunocomplexes were adsorbed to protein A-Sepharose beads (rProtein A Sepharose Fast Flow; Amersham Pharmacia Biotech, Piscataway, N.J.) and analyzed by sodium dodecyl sulfate-10% polyacrylamide gel electrophoresis. The gel was dried and analyzed with a storage phosphor screen and a molecular imager (FX Pro Plus; Bio-Rad, Hercules, Calif.) and QuantityOne software (Bio-Rad).
Flow cytometry.
NA cells were infected with recombinant RVs at a MOI of 1 and incubated for 24 or 48 h at 34°C. Cells were suspended in phosphate-buffered saline (PBS) containing 50 mM EDTA, pelleted at 130 × g for 5 min, resuspended in 50 μl of PBS, and fixed in suspension by addition of 500 μl of 4% paraformaldehyde solution. After 20 min, cells were washed twice with PBS containing 10 mM glycine and 1% bovine serum albumin and incubated with rabbit anti-RV G antiserum (1:400) followed by a fluorescein isothiocyanate (FITC)-conjugated affinity-purified goat anti-rabbit antibody (1:200; Jackson ImmunoResearch Laboratories Inc., West Grove, Pa.). Flow cytometry was performed on an EPICS profile analyzer.
Mitochondrial respiration assay.
The mitochondrion-dependent reduction of MTT (3-[4,5-dimethylthiazol-2-yl]2,5-diphenyltetrazolium bromide) (Sigma) was used as an indicator of mitochondrial respiration (28). At 24 and 48 h postinfection (p.i.), NA cells were incubated with 0.2 mg of MTT/ml for 1 h at 37°C and lysed with dimethyl sulfoxide. The extent of reduction of MTT to formazan was quantitated by measurement of optical density at 550 nm using a microplate reader.
Caspase 3 activity assay.
Caspase activity was measured as the cleavage of the fluorogenic tetrapeptide amino-4-methylcoumarin conjugate (DEVD-AMC) with a caspase 3 assay kit (BD Pharmingen, San Diego, Calif.). At 24 and 48 h p.i., 106 RV-infected NA cells were trypsinized, washed with ice-cold PBS, and lysed with lysis buffer consisting of 10 mM HEPES, 2 mM EDTA, 0.1% CHAPS {3-[(3-cholamidopropyl)-dimethylammonio]-1-propanesulfonate}, 1 mM phenylmethylsulfonyl fluoride, 10 μg of pepstatin A/ml, 10 μg of aprotinin/ml, and 20 μg of leupeptin/ml (pH 7.2). After centrifugation in an Eppendorf centrifuge at 16,000 × g for 1 min, 200 μl of supernatant was added to 200 μl of reaction buffer (200 mM HEPES, 20% sucrose, 0.1% CHAPS, 5 μl of 1 M dithiothreitol/ml, pH 7.25) supplemented with 2 μl of caspase 3 substrate or caspase 3 inhibitor/ml. The reaction mixture was incubated for 1 h at 37°C, and fluorescence was measured with a fluorimeter using 400-nm excitation and 505-nm emission wavelengths.
Fluorescence staining and confocal microscopy.
Primary neuron cultures were infected with SPBNGA and SPBNGA-GA at a MOI of 5 and incubated at 37°C. To detect DNA strand breaks indicative of apoptotic cell death, the infected neurons were fixed with 4% paraformaldehyde at 24 and 48 h p.i. and subjected to a terminal deoxynucleotidyltransferase-mediated dUTP-biotin nick end labeling (TUNEL) assay as described previously (17). For immunofluorescence analysis, infected neurons were fixed with 4% paraformaldehyde at 24 and 48 h p.i., permeabilized by incubation with 0.1% Triton X-100, and stained with a FITC-labeled anti-RV N protein monoclonal antibody (Centocor) as described previously (17). To visualize neurofilaments, the infected neurons were fixed and permeabilized as described above and incubated with monoclonal antibodies anti-MAP2 clone AP-20 (Sigma) and FITC-labeled polyclonal rabbit anti-mouse immunoglobulin G antibodies (Jackson ImmunoResearch Laboratories Inc.). Polymerized and nonpolymerized actins (F and G) were detected with rhodamine-conjugated phalloidin and Oregon green 488 DNase I (Molecular Probes, Eugene, Oreg.), respectively, according to the manufacturer's recommendations. Fluorescence-labeled cells were analyzed by confocal microscopy, and images were processed with Confocal Assistant (version 4.02) software.
Immunization and virus challenge.
Groups of 10 8- to 10-week-old female Swiss Webster mice (Taconic Farms, Germantown, N.Y.) were inoculated intramuscularly (i.m.) with 100 μl of serial 10-fold dilutions of live recombinant RVs. After 10 days, blood was collected from each mouse and the animals were injected intracranially (i.c.) under isoflurane anesthesia with 10 μl containing 100 50% lethal doses (LD50) of CVS-N2c. Mice were observed for 4 weeks for clinical signs of rabies. Mice that showed definitive clinical signs of rabies such as paralysis, tremors, and spasms were euthanized by CO2 intoxication.
Survivorship rates obtained with the different vaccine dilutions for the different vaccination groups were compared, and the 50% effective dose (ED50) was calculated as described previously (31).
VNA assay.
Mice were bled from the retro-orbital sinus under isoflurane inhalation anesthesia, and about 100 μl of blood was collected from each mouse. Mouse sera were tested for the presence of neutralizing antibodies (VNA) with the rapid fluorescence inhibition test as described previously (29). Neutralization titers, defined as the inverse of the highest serum dilution that neutralizes 50% of the challenge virus, were normalized to international units using the World Health Organization anti-RV antibody standard. Geometric mean titers (GMT) were calculated from individual titers of 10 mice that received identical concentrations of the same vaccine virus.
ELISA of anti-RV G and anti-RV RNP antibody titers.
RV G- and RV N-specific antibodies present in mice after vaccination with various recombinant viruses were assessed in direct enzyme-linked immunosorbent assays (ELISA) using RV G or RV RNP at a concentration of 1 μg/ml as the trapping antigens. Antigen-coated MaxiSorp surface plates (Nunc, Roskilde, Denmark) were incubated with serial dilutions of antibody obtained from SPBNGA- and SPBNGA-GA-immunized mice, and the amount of bound antibody was determined with horseradish peroxidase-conjugated anti-mouse immunoglobulin G (ICN Biomedicals, Inc., Costa Mesa, Calif.). O-Phenylendiaminedihydrochloride (Sigma) was used for color development of peroxidase-conjugated antibodies, and the activity was read at 400 nm. Data were analyzed with DeltaSoft ELISA software (Bio Metallics, Inc., Princeton, N.J.).
RESULTS
Growth of recombinant viruses and RV G protein expression in vitro.
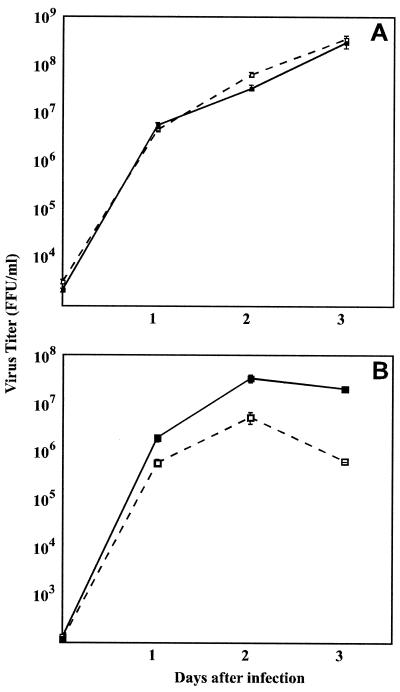
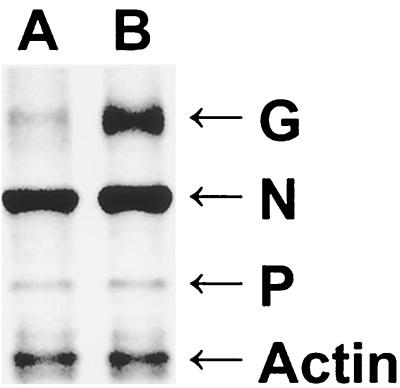
Comparison of the time courses of recombinant virus production in BSR cells infected with SPBNGA or SPBNGA-GA (Fig. 2A) revealed no differences, indicating that the insertion of an additional GA gene did not affect virus replication. In NA cells, however, fewer infectious SPBNGA-GA particles than SPBNGA particles were produced (Fig. 2B). Immunoprecipitation analysis of RV G expressed in infected NA cells indicated markedly higher expression levels in SPBNGA-GA-infected cells than in SPBNGA-infected cells (Fig. 3). In SPBNGA-infected cells the G/N ratio was 0.16 and the G/P ratio was 1.9 while in SPBNGA-GA-infected cells the G/N ratio was 0.25 and the G/P ratio was 6.9, indicating an at least 1.6-fold-higher G expression level in SPBNGA-GA-infected cells due to the additional G gene.
FIG. 2.
Production of recombinant and parental RV strains in BSR cells (A) and NA cells (B). Cells were infected with SPBNGA (solid squares) and SPBNGA-GA (open squares) at a MOI of 5 and incubated at 37°C. Viruses were harvested at days 1, 2, and 3 p.i. and titrated by a fluorescence staining method. Data are means ± standard errors of six virus titer determinations.
FIG. 3.
Immunoprecipitation analysis of the RV G and N proteins produced in BSR cells infected with SPBNGA (lane A) or SPBNGA-GA (lane B). Infected cells were labeled with [35S]methionine, lysed, and subjected to immunoprecipitation with a mixture of monoclonal antibodies against the RV G, N, and NS proteins (16) and a polyclonal antibody against actin. Immune complexes were analyzed by sodium dodecyl sulfate-10% polyacrylamide gel electrophoresis. The gel was dried and analyzed with a storage phosphor screen and a laser scanner.
Flow cytometry to measure the relative cell surface expression of G on NA cells at 24 and 48 h p.i. revealed 1.9-times-higher and 1.7-times-higher cell surface expression levels, respectively, in SPBNGA-GA-infected cells than in SPBNGA-infected cells (Fig. 4; compare panels D and E with B and C). Thus, an increase in RV G production is reflected in a higher accumulation of G on the cell surface.
FIG. 4.
Cell surface expression of RV G on NA cells. Cells were infected with SPBNGA (B and C) or SPBNGA-GA (D and E) or were not infected (A). At 24 (B and D) and 48 h p.i. (C and E), cells were incubated with a polyclonal rabbit anti-RV G antiserum, followed by a FITC-conjugated anti-rabbit antibody. Surface expression was determined by flow cytometry, and fluorescence intensity was plotted. The geometric mean (GM) fluorescence intensity is given in each panel.
Effect of G overexpression on cell viability.
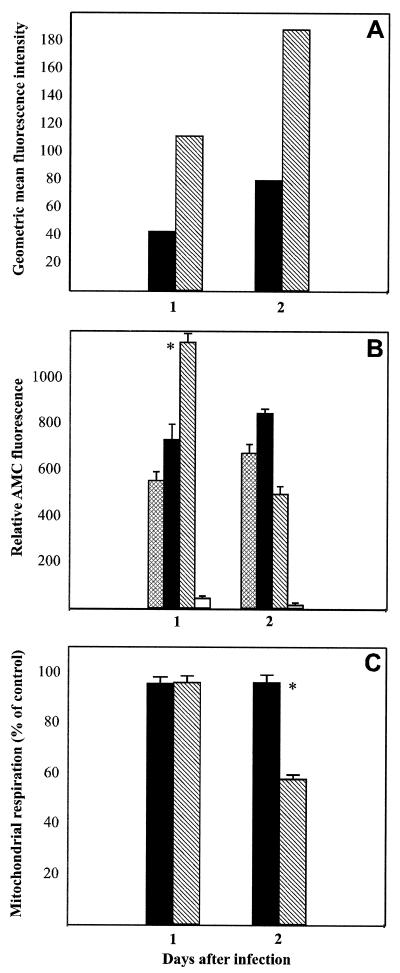
To analyze the effects of overexpressed G protein on cell viability, we compared levels of cell surface expression of G (Fig. 5A) with caspase activity (Fig. 5B) and mitochondrial respiration (Fig. 5C) in infected NA cells at 1 and 2 days p.i. Caspase 3 activity, as determined by the formation of fluorogenic tetrapeptide amino-4-methylcoumarin, in SPBNGA-infected cells was increased by 32% compared to that in uninfected cells at 1 day p.i., with no significant change at 2 days p.i. in SPBNGA-infected cells. By contrast, caspase 3 activity was significantly increased (by 87%; P < 0.01) in SPBNGA-GA-infected cells at 1 day p.i. but was markedly decreased at 2 days p.i. (by 35% compared with that in uninfected cells). Whereas no significant differences between SPBNGA- and SPBNGA-GA-infected NA cells in mitochondrial respiration were detected at 1 day p.i., SPBNGA-GA-infected cells revealed a 40% decrease (P < 0.01) in mitochondrial respiration at 2 days p.i. while SPBNGA-infected NA cells remained unchanged. Comparison of the values obtained from the caspase and the mitochondrial assays with the expression levels of G protein strongly suggests an association between the level of G protein cell surface expression and the extent of cell injury. The decrease in mitochondrial respiration seen in SPBNGA-GA-infected NA cells was prevented by addition of caspase 3 inhibitors to the culture medium (data not shown), suggesting that the cytotoxic effect observed in these cells is primarily due to activation of the apoptosis cascade.
FIG. 5.
Effect of RV G overexpression on caspase 3 activity and mitochondrial respiration in NA cells at 1 and 2 days p.i. The geometric mean fluorescence of RV G (A) on the surfaces of cells infected with SPBNGA (filled bars) and SPBNGA-GA (hatched bars) was compared with caspase 3 activity (B) measured in lysates of uninfected (cross-hatched bars), SPBNGA-infected (filled bars), and SPBNGA-GA-infected NA cells (hatched bars). Caspase 3 activity determined in lysates of SPBNGA-GA-infected NA cells in the presence of a caspase 3 inhibitor (open bars) served as a control for the specificity of the reaction. (C) Mitochondrial respiration in cells infected with SPBNGA (filled bars) or SPBNGA-GA (hatched bars) was determined. Error bars, standard errors; ∗, significant differences (P < 0.01) in caspase 3 activity or mitochondrial respiration.
Effect of RV G overexpression on the morphology of cultured primary neuronal cells.
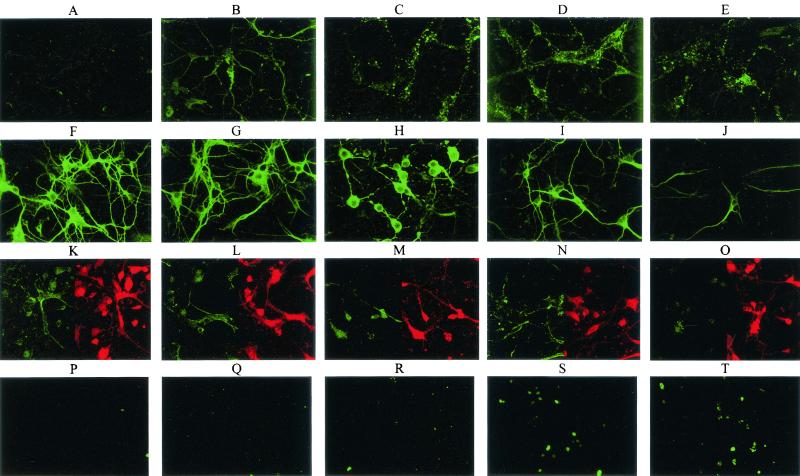
Immunofluorescence analysis in combination with confocal microscopy of N protein expression in SPBNGA-GA-infected primary hippocampal neuron cultures revealed large N protein-positive inclusion bodies in the cell body cytoplasm and only limited N protein-specific staining in neuronal processes at 24 h p.i (Fig. 6D). In contrast, SPBNGA-infected neurons showed a finer granular N-protein staining pattern, which extended into the neuronal processes (Fig. 6B). Although almost no N protein staining of neuronal processes in either SPBNGA- or SPBNGA-GA-infected neurons could be visualized at 48 h p.i., the degeneration of cell bodies was much more pronounced in SPBNGA-GA-infected neurons (Fig. 6C and E). These differences in the N protein staining patterns are most likely caused by fragmentation of neurites due to the more rapid induction of apoptosis. Whereas no substantial changes in neurofilament staining in SPBNGA-infected neurons (Fig. 6G) compared to that in uninfected neurons (Fig. 6F) were detected at 24 h p.i., neurofilament staining was already markedly reduced at this time in SPBNGA-GA-infected neurons, particularly in the neuronal processes (Fig. 6I). Double immunofluorescence analysis of F and G actin in uninfected and infected neurons (Fig. 6K to O) revealed a strong reduction of F actin staining in SPBNGA-GA-infected neurons at 48 h p.i. (Fig. 6O), which was not seen in SPBNGA-infected neurons (Fig. 6M).
FIG. 6.
Confocal fluorescence microscopy analysis of RV N protein (A to E), neurofilament (F to J), and F actin and G actin (red and green, respectively; K to O) and TUNEL analysis (P to T) of uninfected primary neuron cultures (A, F, K, and P), SPBNGA-infected primary neuron cultures at 24 (B, G, L, and Q) and 48 h p.i. (C, H, M, and R), and SPBNGA-GA-infected primary neuron cultures at 24 (D, I, N, and S) and 48 h p.i. (E, J, O, and T).
TUNEL staining visualized a large number of positive nuclei in SPBNGA-GA-infected neurons at 24 and 48 h p.i. (Fig. 6S and T), whereas only a few stained nuclei were detected in SPBNGA-infected neurons at the same time points (Fig. 6Q and R).
Effect of RV G overexpression on immunity.
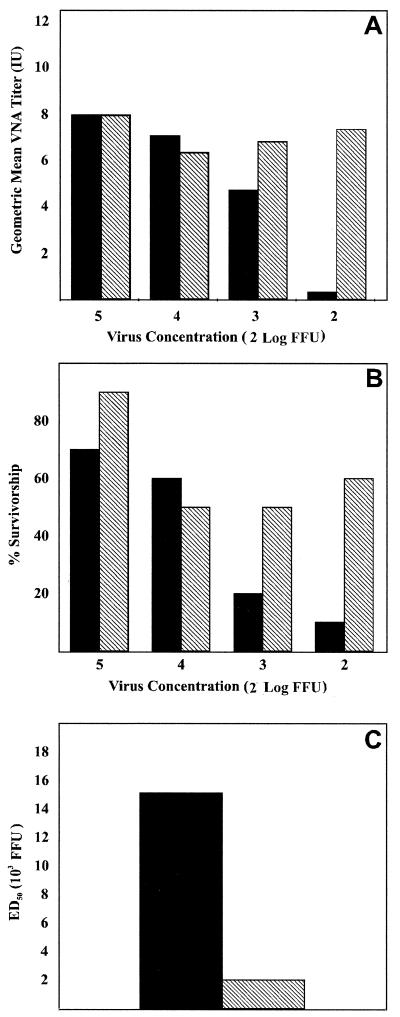
Analysis of the VNA responses in mice inoculated i.m. with serial dilutions of SPBNGA or SPBNGA-GA (Fig. 7A) indicated no major differences in VNA GMT for mice that received 105 and 104 focus-forming units (FFU); however, while the VNA GMT of mice immunized with 103 and 102 FFU of SPBNGA strongly decreased in a dose-dependent manner, the VNA GMT of mice immunized with the same concentrations of SPBNGA-GA remained essentially unchanged. Indeed, the VNA GMT of mice immunized with 102 FFU of SPBNGA-GA was 24 times higher than that of mice immunized with the same amount of SPBNGA. These data are paralleled by the results of a virus challenge experiment which demonstrated that survivorship in mice vaccinated i.m. with 103 and 102 FFU of SPBNGA-GA and challenged i.c. with 100 LD50 of CVS-N2c virus was markedly higher than that in mice immunized with SPBNGA (Fig. 7B). The ED50 calculated from the mortality rates in the different vaccine dilution groups (Fig. 7C) indicated an eightfold-higher efficacy of SPBNGA-GA than of SPBNGA, clearly demonstrating that overexpression of RV G strongly enhances the protective immunity against rabies.
FIG. 7.
Immunogenicity of SPBNGA and SPBNGA-GA after i.m. immunization of mice. (A) Groups of 10 mice were injected with serial 10-fold dilutions of the recombinant RVs. After 10 days, blood samples were obtained and VNA titers of mice immunized with SPBNGA (filled bars) or SPBNGA-GA (hatched bars) were determined by using the rapid fluorescence inhibition test (30). Titers were normalized to international units by using the World Health Organization standard and are given as GMT. (B) Two weeks after immunization, mice were infected i.c. with 100 LD50 of CVS-N2c and observed for 4 weeks, and survivorship in mice immunized with SPBNGA (filled bars) or SPBNGA-GA (hatched bars) was recorded. (C) The ED50 values were calculated from the survivorship rates in the two vaccination groups as described previously (31).
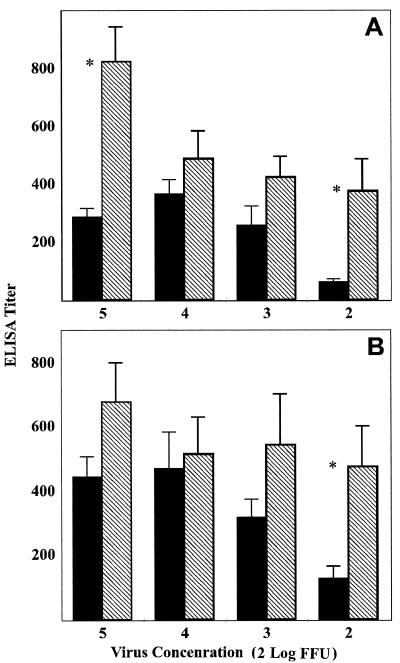
ELISA analysis of antibodies directed against RV G and RV RNP showed that mean anti-G antibody titers were higher in SPBNGA-GA-immunized mice than in SPBNGA-immunized mice regardless of the dose of virus used for immunization and that, as was the case for VNA GMT, differences in anti-G antibody titers were maximal in the mice that received the smallest amount of virus (Fig. 8A). Similar differences between SPBNGA- and SPBNGA-GA-immunized mice in anti-N antibody titers were seen, indicating that overexpression of RV G enhances the immune response not only against the homologous RV G but also against heterologous antigens such as the RV RNP.
FIG. 8.
Comparison of titers of antibodies specific for RV G (A) or RV RNP (B) produced in mice immunized with different concentrations of SPBNGA (filled bars) or SPBNGA-GA (hatched bars). Antibody titers were determined by direct ELISA using RV G or RV RNP as the trapping antigen. Error bars, standard errors; ∗, statistically significant differences (P ≤ 0.01) between antibody titers induced by SPBNGA and SPBNGA-GA.
DISCUSSION
This study was premised on the apparent link between the immunogenicity of a particular RV and its ability to induce apoptosis. To examine the role of RV G expression levels in induction of the apoptotic process, we used a recombinant virus in which the pseudogene of the RV genome is replaced by an additional homologous RV G gene. Virus production of the recombinant virus carrying two RV G genes in BSR cells did not differ from that of the recombinant virus carrying only a single G gene, indicating that the introduction of an extra G gene did not affect virus replication. The lower virus titers produced in SPBNGA-GA-infected cells than in SPBNGA-infected NA cells are most likely due to a higher potential of these cells to undergo apoptosis.
Immunoprecipitation experiments revealed twofold-higher expression levels of G protein in BSR cells infected with SPBNGA-GA than in SPBNGA-infected BSR cells, consistent with flow cytometry analysis demonstrating greater G expression on the surfaces of NA cells infected with SPBNGA-GA than on the surfaces of SPBNGA-infected cells. Although increased RV G expression might theoretically be achieved by changing the order of the G gene relative to the transcription promoter, as shown for vesicular stomatitis virus (1), we were unable to rescue infectious viruses from RV full-length cDNA clones in which the position of the G gene was in closer proximity to the leader sequence. This failure might reflect cell death due to high G expression levels before infectious virus particles are produced, consistent with the decrease in production of infectious virus accompanied by increased cell injury observed in NA cells infected with SPBNGA-GA compared with that in SPBNGA-infected cells. The reduced viability of SPBNGA-GA-infected NA cells at 48 h p.i., as indicated by the marked decrease in mitochondrial respiration, was preceded by a strong increase in caspase 3 activity at 24 h p.i., suggesting that the observed cell injury most likely results from the activation of the apoptosis cascade. Such a process might also be responsible for the strong decrease in caspase 3 activity at 48 h p.i., probably through autocatalytic degradation of the enzyme. The conclusion that apoptosis is the primary mechanism involved in RV G-mediated cell injury and death is supported by the results of morphological studies using cultured primary neurons. In particular, the decrease in F actin staining after infection with SPBNGA-GA is consistent with apoptosis-induced depolymerization of the actin filaments (12). Furthermore, the number of TUNEL-positive nuclei in SPBNGA-GA-infected neurons increased greatly compared with numbers in uninfected and SPBNGA-infected neurons. Although these findings support the notion that overexpressed RV G leads to activation of the apoptosis cascade, we cannot exclude the possibility that duplication of the RV G gene itself could be sufficient to alter apoptosis induction irrespective of the G protein level. Therefore, the precise mechanism by which the RV G gene mediates the apoptosis signaling process remains largely unknown. We speculate that RV G expression exceeding a certain threshold severely perturbs the cell membrane, resulting in the activation of signaling proteins.
Mice immunized i.m. with 103 and 102 FFU of SPBNGA-GA developed markedly higher VNA titers than mice immunized with the same number of infectious virus particles of SPBNGA. The higher VNA titers in SPBNGA-GA-immunized mice conferred greater protection against a lethal i.c. challenge infection with the highly pathogenic RV strain CVS-N2c. Survivorship in mice immunized with SPBNGA-GA was markedly higher than that in mice that received SPBNGA, with ED50 values eight times lower in the SPBNGA-GA group. Because RV G is the major viral antigen responsible for the induction of VNA and protective immunity, the increased immunogenicity of SPBNGA-GA might rest solely in the elevated expression levels of its G. However, comparison of anti-G and anti-N antibody titers from ELISA of sera obtained from SPBNGA- and SPBNGA-GA-immunized mice revealed similar differences in anti-N and anti-G antibody titers induced by the two viruses. Since the major phenotypic difference between SPBNGA- and SPBNGA-GA-infected cells is in the induction of apoptosis, it seems highly likely that the elevated apotogenic activity of SPBNGA-GA accounts for its increased immunogenicity. Alternatively, there is still a possibility that the larger genome of SPBNGA-GA could have resulted in an increase of interferon levels, which in turn could also have contributed to the enhanced antibody response.
In both G genes of SPBNGA-GA the three nucleotides of the codon for Arg at position 333 were mutated to encode Glu, rendering the virus nonpathogenic for immunocompetent mice (8, 26). The strong increase in immunogenicity coupled with a loss of pathogenicity makes SPBNGA-GA a superb candidate for a live RV vaccine.
Acknowledgments
This work was supported by Public Health Service grant AI45097.
REFERENCES
- 1.Ball, L. A., C. R. Pringle, B. Flanagan, V. P. Perepelista, and G. W. Wertz. 1999. Phenotypic consequences of rearranging the P, M, and G genes of vesicular stomatitis virus. J. Virol. 73:4705-4712. [DOI] [PMC free article] [PubMed] [Google Scholar]
- 2.Chattergoon, M. A., J. J. Kim, J. S. Yang, T. M. Robinson, D. J. Lee, T. Dentchev, D. M. Wilson, V. Ayyavoo, and D. B. Weiner. 2000. Targeted antigen delivery to antigen-presenting cells including dendritic cells by engineered Fas-mediated apoptosis. Nat. Biotechnol. 18:974-979. [DOI] [PubMed] [Google Scholar]
- 3.Cox, J. H., B. Dietzschold, and L. G. Schneider. 1977. Rabies virus glycoprotein II. Biological and serological characterization. Infect. Immun. 16:754-759. [DOI] [PMC free article] [PubMed] [Google Scholar]
- 4.Dietzschold, B. 1996. Techniques for the purification of rabies virus, its subunits and recombinant products, p. 175-179. In C. E. Rupprecht, B. Dietzschold, and H. Koprowski (ed.), Lyssaviruses. Springer-Verlag, Berlin, Germany.
- 5.Dietzschold, B., T. J. Wiktor, R. MacFarlan, and A. Varrichio. 1982. Antigenic structure of rabies virus glycoprotein: ordering and immunological characterization of the large CNBr cleavage fragments. J. Virol. 44:595-602. [DOI] [PMC free article] [PubMed] [Google Scholar]
- 6.Dietzschold, B., T. J. Wiktor, J. Q. Trojanowski, R. I. Macfarlan, W. H. Wunner, M. J. Torres-Anjel, and H. Koprowski. 1985. Differences in cell-to-cell spread of pathogenic and apathogenic rabies virus in vivo and in vitro. J. Virol. 56:12-18. [DOI] [PMC free article] [PubMed] [Google Scholar]
- 7.Dietzschold, B., T. J. Wiktor, W. H. Wunner, and A. Varrichio. 1982. Chemical and immunological analysis of the rabies soluble glycoprotein. Virology 124:330-337. [DOI] [PubMed] [Google Scholar]
- 8.Dietzschold, B., W. H. Wunner, T. J. Wiktor, A. D. Lopes, M. Lafon, C. L. Smith, and H. Koprowski. 1983. Characterization of an antigenic determinant of the glycoprotein that correlates with pathogenicity of rabies virus. Proc. Natl. Acad. Sci. USA 80:70-74. [DOI] [PMC free article] [PubMed] [Google Scholar]
- 9.Foley, H. D., J. P. McGettigan, C. Siler, B. Dietzschold, and M. Schnell. 2000. A recombinant rabies virus expressing vesicular stomatitis virus glycoprotein fails to protect against rabies virus infection. Proc. Natl. Acad. Sci. USA 97:14680-14685. [DOI] [PMC free article] [PubMed] [Google Scholar]
- 10.Galelli, A., L. Baloul, and M. Lafon. 2000. Abortive rabies virus central nervous infection is controlled by T lymphocyte local recruitment and induction of apoptosis. J. Neurovirol. 6:359-372. [DOI] [PubMed] [Google Scholar]
- 11.Hooper, D. C., K. Morimoto, M. Bette, E. Weihe, H. Koprowski, and B. Dietzschold. 1998. Collaboration of antibody and inflammation in the clearance of rabies virus from the central nervous system. J. Virol. 72:3711-3719. [DOI] [PMC free article] [PubMed] [Google Scholar]
- 12.Kothakota, S. T., C. Azuma, A. Reinhard, J. Klippel, K. Tang, T. J. Chu, M. W. McGarry, K. Kirschner, D. J. Koths, D. J. Kwiatkowski, and L. T. Williams. 1997. Caspase-3-generated fragment of gelsolin: effector of morphological change in apoptosis. Science 278:294-297. [DOI] [PubMed] [Google Scholar]
- 13.McGettigan, J. P., S. Sarma, J. M. Orenstein, R. J. Pomerantz, and M. J. Schnell. 2001. Expression and immunogenicity of human immunodeficiency virus type I Gag expressed by a replication-competent rhabdovirus-based vaccine vector. J. Virol. 75:8724-8732. [DOI] [PMC free article] [PubMed] [Google Scholar]
- 14.Mebatsion, T., M. Koenig, and K.-K. Conzelmann. 1996. Budding of rabies virus particles in the absence of the spike glycoprotein. Cell 84:941-951. [DOI] [PubMed] [Google Scholar]
- 15.Mebatsion, T., F. Weiland, and K.-K. Conzelmann. 1999. Matrix protein of rabies virus is responsible for the assembly and budding of bullet-shaped particles and interacts with the transmembrane spike glycoprotein G. J. Virol. 73:242-250. [DOI] [PMC free article] [PubMed] [Google Scholar]
- 16.Morimoto, K., D. C. Hooper, H. Carbaugh, Z. F. Fu, H. Koprowski, and B. Dietzschold. 1998. Rabies virus quasispecies: implications for pathogenesis. Proc. Natl. Acad. Sci. USA 95:3152-3156. [DOI] [PMC free article] [PubMed] [Google Scholar]
- 17.Morimoto, K., D. C. Hooper, S. Spitsin, H. Koprowski, and B. Dietzschold. 1999. Pathogenicity of different rabies virus variants inversely correlates with apoptosis and rabies virus glycoprotein expression in infected primary neuron cultures. J. Virol. 73:510-517. [DOI] [PMC free article] [PubMed] [Google Scholar]
- 18.Morimoto, K., J. P. McGettigan, D. C. Hooper, H. D. Foley, B. Dietzschold, and M. J. Schnell 2001. Engineering novel modified live rabies vaccines using reverse genetics. Vaccine 19:3543-3551. [DOI] [PubMed] [Google Scholar]
- 19.Morimoto, K., M. Patel, S. Corisdeo, D. C. Hooper, Z. F. Fu, C. E. Rupprecht, and B. Dietzschold. 1996. Characterization of a unique variant of bat rabies virus responsible for newly emerging human cases in North America. Proc. Natl. Acad. Sci. USA 93:5653-5658. [DOI] [PMC free article] [PubMed] [Google Scholar]
- 20.Pulmanausahakul, R., M. Faber, K. Morimoto, S. Spitsin, E. Weihe, D. C. Hooper, M. J. Schnell, and B. Dietzschold. 2001. Overexpression of cytochrome c by a rabies recombinant virus attenuates pathogenicity and enhances antiviral immunity. J. Virol. 75:10800-10807 [DOI] [PMC free article] [PubMed] [Google Scholar]
- 21.Restifo, N. P. 2000. Building better vaccines: how apoptotic cell death can induce inflammation and active innate and adaptive immunity. Curr. Opin. Immunol. 12:597-603. [DOI] [PMC free article] [PubMed] [Google Scholar]
- 22.Rovere, P., C. Vallinoto, A. Bodanza, M. C. Crosti, M. Rescigno, P. R. Castagnoli, C. Rugarli, and A. A. Manfredi. 1998. Cutting edge: bystander apoptosis triggers dendritic cell maturation and antigen-presenting function. J. Immunol. 161:4467-4471. [PubMed] [Google Scholar]
- 23.Sasaki, S., R. R. Amara, A. E. Oran, J. M. Smith, and H. L. Robinson. 2001. Apoptosis-mediated enhancement of DNA-raised immune responses by mutant caspases. Nat. Biotechnol. 19:543-547. [DOI] [PubMed] [Google Scholar]
- 24.Schnell, M. J., H. D. Foley, C. A. Siler, J. P. McGettigan, B. Dietzschold, and R. J. Pomerantz. 2000. Recombinant rabies virus as potential live-viral vaccines for HIV-1. Proc. Natl. Acad. Sci. USA 97:3544-3549. [DOI] [PMC free article] [PubMed] [Google Scholar]
- 25.Schnell, M. J., T. Mebatsion, and K.-K. Conzelmann. 1994. Infectious rabies viruses from cloned cDNA. EMBO J. 13:4195-4203. [DOI] [PMC free article] [PubMed] [Google Scholar]
- 26.Seif, I., P. Coulon, P. E. Rollin, and A. Flamand. 1985. Rabies virulence: effect on pathogenicity and sequence characterization of rabies virus mutations affecting antigenic site III of the glycoprotein. J. Virol. 53:926-934. [DOI] [PMC free article] [PubMed] [Google Scholar]
- 27.Shi, Y., W. Zheng, and K. L. Rock. 2000. Cell injury releases endogenous adjuvants that stimulate cytotoxic T cells. Proc. Natl. Acad. Sci. USA 97:14590-14595. [DOI] [PMC free article] [PubMed] [Google Scholar]
- 28.Virag, L., G. S. Scott, S. Cuzzocrea, D. Marmer, A. L. Salzman, and C. Szabo. 1998. Peroxynitrite-induced thymocyte apoptosis: the role of caspases and poly(ADP-ribose) synthetase (PARS) activation. Immunology 94:345-355. [DOI] [PMC free article] [PubMed] [Google Scholar]
- 29.Wiktor, T. J., P. C. Doherty, and H. Koprowski. 1977. In vitro evidence of cell-mediated immunity after exposure of mice to both live and inactivated rabies virus. Proc. Natl. Acad. Sci. USA 74:334-338. [DOI] [PMC free article] [PubMed] [Google Scholar]
- 30.Wiktor, T. J., R. I. MacFarlan, C. M. Foggin, and H. Koprowski. 1984. Antigenic analysis of rabies and Mokola virus from Zimbabwe using monoclonal antibodies. Dev. Biol. Stand. 57:199-221. [PubMed] [Google Scholar]
- 31.Wilbur, L. A., and M. F. A. Aubert. 1996. The NIH test for potency, p. 360-368. In F.-X. Meslin, M. M. Kaplan, and H. Koprowski (ed.), Laboratory techniques in rabies. World Health Organization, Geneva, Switzerland.
- 32.Yan, X., M. Prosniak, M. T. Curtis, M. L. Weiss, M. Faber, B. Dietzschold, and Z. F. Fu. 2001. Silver-haired bat rabies virus variant does not induce apoptosis in the brain of experimentally infected mice. J. Neurovirol. 7:518-527. [DOI] [PubMed] [Google Scholar]


