Abstract
Recombinant vaccinia viruses (rVV) have been extensively used as vaccines, but there is little information about the total magnitude of the VV-specific T-cell response and how this compares to the immune response to the foreign gene(s) expressed by the rVV. To address this issue, we quantitated the T-cell responses to both the viral vector and the insert following the infection of mice with VV expressing a cytotoxic T lymphocyte (CTL) epitope (NP118-126) from lymphocytic choriomeningitis virus (LCMV). The LCMV epitope-specific response was quantitated by intracellular cytokine staining after stimulation with the specific peptide. To analyze the total VV-specific response, we developed a simple intracellular cytokine staining assay using VV-infected major histocompatibility complex class I and II matched cells as stimulators. Using this approach, we made the following determinations. (i) VV-NP118 induced potent and long-lasting CD8 and CD4 T-cell responses to the vector; at the peak of the response (∼1 week), there were ∼107 VV-specific CD8 T cells (25% of the CD8 T cells) and ∼106 VV-specific CD4 T cells (∼5% of the CD4 T cells) in the spleen. These numbers decreased to ∼5 × 10⁵ CD8 T cells (∼5% frequency) and ∼105 CD4 T cells (∼0.5% frequency), respectively, by day 30 and were then stably maintained at these levels for >300 days. The size of this VV-specific T-cell response was comparable to that of the T-cell response induced following an acute LCMV infection. (ii) VV-specific CD8 and CD4 T cells were capable of producing gamma interferon (IFN-γ), tumor necrosis factor alpha (TNF-α), and interleukin-2; all cells were able to make IFN-γ, a subset produced both IFN-γ and TNF-α, and another subset produced all three cytokines. (iii) The CD8 T-cell response to the foreign gene (LCMV NP118-126 epitope) was coordinately regulated with the response to the vector during all three phases (expansion, contraction, and memory) of the T-cell response. The total number of CD8 T cells responding to NP118-126 were ∼20- to 30-fold lower than the number responding to the VV vector (∼1% at the peak and 0.2% in memory). This study provides a better understanding of T-cell immunity induced by VV-based vaccines, and in addition, the technique described in the study can be readily extended to other viral vectors to determine the ratio of the T-cell response to the insert versus the vector. This information will be useful in optimizing prime-boost regimens for vaccination.
Recombinant vaccinia viruses expressing foreign genes from different pathogens have been extensively used in various experimental studies and also in clinical trials (2, 20). Despite the widespread use of vaccinia virus (VV) as a viral vector, there is little to no information available about the total size of the VV-specific T-cell response. The major impediment to such studies has been the absence of well-defined CD4 and CD8 T-cell epitopes of VV. This has prevented a detailed quantitative analysis of T-cell immunity to VV. Although there is information about the longevity of VV-specific immune responses (4, 11, 14), a kinetic analysis of VV-specific T-cell immunity has not been done. In the case of rVV and other poxvirus-based viral vectors, such as canarypox virus and modified vaccinia virus Ankara (1, 16, 20), it is not known whether the response to the foreign epitope is coordinately regulated with the response to the vector or if it follows a different course.
In this study we have developed a simple intracellular cytokine staining assay using VV-infected syngeneic cell lines expressing major histocompatibility complex (MHC) class I and II proteins to quantitate VV-specific CD8 and CD4 T-cell responses. Using this assay, we have monitored the magnitude and duration of T-cell responses to the vector (i.e., VV) and also to the foreign epitope following infection of mice with recombinant vaccinia virus (rVV) expressing the NP118-126 cytotoxic T lymphocyte (CTL) epitope of lymphocytic choriomeningitis virus (LCMV).
MATERIALS AND METHODS
Mice and virus.
BALB/cByJ (BALB/c) mice were purchased from The Jackson Laboratory (Bar Harbor, Maine). BALB/c mice (4- to 6-week-old females) were used in both the LCMV and VV studies. Virus stocks were prepared as described previously (6, 18). For acute LCMV infection, mice were immunized intraperitoneally (i.p.) with 2 × 10⁵ PFU of LCMV-Armstrong (7, 10). For VV experiments, mice were injected with 2 × 10⁶ PFU of recombinant VV-NP118 (NP118-126 is encoded as a minigene [18]) or wild-type VV (VV-WT) i.p. Effector responses were analyzed in the spleens of infected mice on day 8 postinfection for LCMV and day 7 postinfection for VV, while memory responses were analyzed >60 days after infection.
Cell lines and in vitro infections.
Both BALB clone 7 (BALB Cl7) and A-20 cells were used in these experiments. BALB Cl7 cells, an H-2d MHC class I-expressing fibroblast line, were maintained in Eagle's minimal essential medium supplemented with 10% fetal calf serum, 2 mM l-glutamine, and antibiotics. A-20 cells are B-cell lymphoma cells that express both major histocompatibility complex class I and II proteins of the H-2d haplotype. These cells were maintained in RPMI 1640 medium supplemented with 10% fetal calf serum, 2 mM l-glutamine, and antibiotics (complete RPMI).
For LCMV infections, both BALB Cl7 and A-20 cells were infected at a multiplicity of infection (MOI) of 0.5; BALB Cl7 cells were infected with LCMV clone 13, and A-20 cells were infected with LCMV-t1b (6, 8, 9). At 24 h postinfection, the cells were harvested, resuspended in complete RPMI, and used to stimulate mouse splenocytes.
For VV infection of BALB Cl7 and A-20 cells, both were infected with VV-WT at an MOI of approximately 1. To stimulate for intracellular cytokine staining, cells were harvested between 8 and 12 h after infection, resuspended in complete RPMI, and used to stimulate mouse splenocytes. For enzyme-linked immunospot (ELISPOT) analysis, A-20 cells were harvested 2 h postinfection and used for stimulations. For the VV-specific 51Cr release assay, BALB Cl7 cells were infected 1 h prior to the assay with VV-WT at an MOI of ∼10 (at the time of 51Cr labeling). These cells were washed three times following the 1-h incubation and then used as target cells in a 5-h 51Cr release assay, as previously described (10).
Cell surface staining and flow cytometry.
Cell surface staining was performed as previously described (10, 19). Briefly, single-cell suspensions of splenocytes from mice were stained in phosphate-buffered saline (PBS) containing 2% bovine serum albumin and 0.2% sodium azide (FACS buffer) with antibodies specific for CD8α (clone 53-6.7), CD4 (clone RM4-5), and lymphocyte function-associated antigen 1 (LFA-1; CD11a). Cells were washed with FACS buffer and fixed in PBS containing 2% paraformaldehyde (PFA). Samples were acquired on a Becton Dickinson FACSCalibur flow cytometer (San Jose, Calif.), and analysis was performed using CellQuest software (Becton Dickinson). All antibodies were purchased from Pharmingen (San Diego, Calif.).
Intracellular cytokine stimulation and staining.
Single-cell suspensions of splenocytes were prepared from immunized mice and used as effector cells. In a 96-well flat-bottomed plate, either 106 splenocytes were incubated with medium or the LCMV NP118-126 peptide (0.1 μg/ml final concentration) or 8 × 10⁵ splenocytes were incubated with 3 × 10⁵ to 4 × 10⁵ cells from the uninfected or virus-infected cell lines. All stimulations were performed for 5 h at 37°C, in the presence of human interleukin-2 (IL-2; Pharmingen) and brefeldin A (Golgi Plug; Pharmingen) at the previously published concentrations (10, 19).
After the 5-h incubation, intracellular cytokine staining was performed as previously described (10, 19). First, the cell surface was stained with anti-CD8α (clone 53-6.7) and anti-CD4 (clone RM4-5) monoclonal antibodies (MAbs). The cells were then fixed and permeabilized (Cytofix/Cytoperm kit; Pharmingen) and subsequently stained intracellularly with anti-gamma interferon (IFN-γ), anti-tumor necrosis factor alpha (TNF-α), or anti-IL-2 MAbs. Samples were fixed in PBS containing 2% PFA and analyzed as described above. All antibodies were purchased from Pharmingen.
IFN-γ ELISPOT assay.
IFN-γ ELISPOT assays were performed as previously described (10) with the following modifications. Splenocytes from VV-NP118-infected mice were stimulated with either medium alone, LCMV NP118-126 peptide (0.1 μg/ml final concentration), 2.5 × 10⁵ uninfected A-20 cells, or 2.5 × 10⁵ VV-infected A-20 cells (infected 2 h earlier at an MOI of ∼1). Cultures were incubated at 37°C for 36 h, after which time the assay was developed as previously described (10).
RESULTS
VV infection of mice induces activation and expansion of CD8 and CD4 T cells.
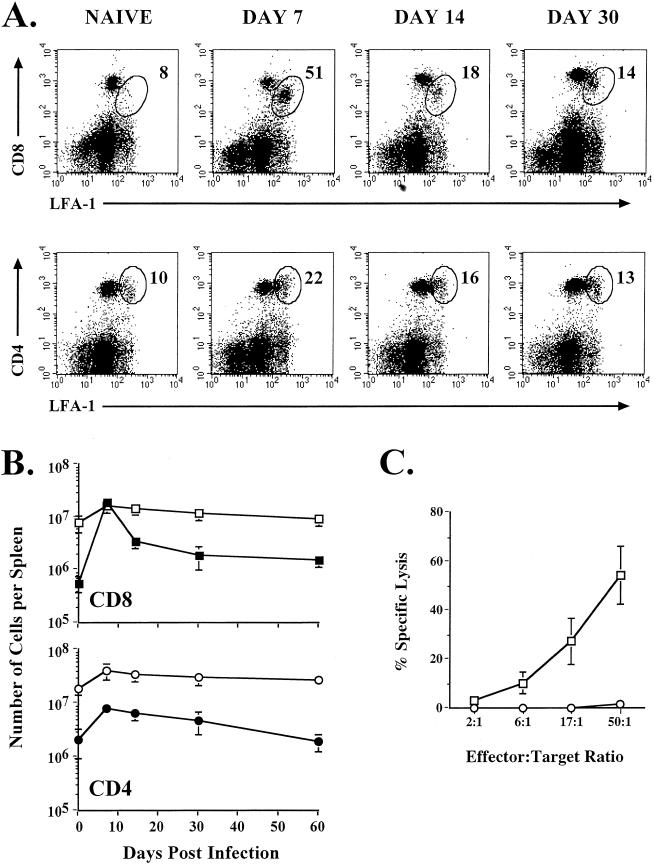
Following immunization of mice with VV, there is a substantial increase in the number of cells in the spleen, suggesting activation and clonal expansion of T and B cells. To assess the extent of T-cell activation, we stained T cells for their expression of the activation marker LFA-1 (CD11a). Splenocytes from VV-infected BALB/c mice were analyzed on days 7, 14, 30, and 60 after immunization, and the frequencies of CD8 and CD4 T cells that upregulated LFA-1 were determined (Fig. 1A and B). At the peak of the T-cell response (day 7 after infection), as many as 50% of the CD8 T cells and 20% of the CD4 T cells were LFA-1hi. This represents at least a 40-fold increase in the number of LFA-1hi CD8 T cells by day 7 postinfection, resulting in approximately 2 × 10⁷ LFA-1hi CD8 T cells. These CD8 T cells also displayed high levels of direct ex vivo cytolytic activity (Fig. 1C). The number of activated CD8 and CD4 T cells decreased over time and returned to almost baseline levels by day 30. At this time, 14% of the CD8 T cells and 13% of the CD4 T cells were LFA-1hi.
FIG. 1.
Activation and expansion of T cells following VV infection. (A) BALB/c mice were infected with VV and analyzed on the indicated days after infection by staining splenocytes with CD8α, CD4, and CD11a MAbs. The percentages of the CD8 or CD4 T-cell populations that were LFA-1hi are indicated in the upper right corners of the corresponding panels. (B) Total numbers of CD8 and CD4 T cells in the spleen that were LFA-1hi (closed symbols) or LFA-1lo (open symbols) were determined. (C) Direct ex vivo CTL activity was measured on day 7 postinfection. Killing was assayed on 51Cr-labeled uninfected (○) or VV-infected (□) target cells. Error bars indicate standard deviations.
Detection of virus-specific CD8 T cells by using infected cell lines.
We knew that VV infection of mice induced strong activation of CD8 T cells and that these CD8 T cells exhibited high levels of direct ex vivo cytotoxicity; therefore, we wanted to know the frequency of VV-specific CD8 T cells at this time. Because of the lack of known MHC class I restricted VV epitopes, we did not have a method for quantitating the specific VV CD8 T-cell responses. To overcome this, we set out to design an assay to quantitate total virus-specific CD8 T-cell responses by using virus-infected cell lines in combination with intracellular cytokine staining. To establish this intracellular cytokine staining assay using MHC class I-matched virus-infected cells, we initially used the well-characterized system of LCMV infection of mice. Infection of BALB/c mice with LCMV induces a massive virus-specific CD8 T-cell response that is focused at one immunodominant epitope, NP118-126. At the peak of the CD8 T-cell response (day 8 after infection), approximately 50% of the CD8 T cells are specific for this epitope (Fig. 2A) (10). We tested the ability of LCMV-infected BALB Cl7 cells to stimulate splenocytes from these same mice to produce IFN-γ. As shown in Fig. 2B, the LCMV-infected fibroblast line worked as well as the NP118-126 peptide to stimulate the LCMV-specific CD8 T cells to produce IFN-γ, and this could be readily detected by intracellular cytokine staining.
FIG. 2.
Intracellular cytokine staining of LCMV- and VV-specific CD8 T cells using virus-infected cells as stimulators. BALB/c mice were infected with either LCMV or VV-WT, and the CD8 T-cell response in the spleen was analyzed on day 8 or day 7 after infection, respectively. Splenocytes from infected mice were stimulated in vitro for 5 h, and then intracellular IFN-γ staining was performed. (A and B) Splenocytes from day 8 LCMV-infected BALB/c mice either were not stimulated or were stimulated with the LCMV NP118-126 peptide (A) or uninfected, LCMV-infected, or VV-WT-infected BALB Cl7 cells (B). (C) Splenocytes collected from BALB/c mice day 7 after VV infection were stimulated with uninfected, LCMV-infected, or VV-WT-infected BALB Cl7 cells. The frequencies of the CD8 T cells that stained IFN-γ+ are indicated in the upper right corners of the corresponding panels.
Knowing that virus-infected BALB Cl7 cells worked well to stimulate the LCMV-specific CD8 T cells, we used the same approach to determine the VV-specific CD8 T-cell response. BALB/c mice were immunized with VV, and at the peak of the effector response, virus-specific CD8 T cells were analyzed in the spleen. BALB Cl7 cells were infected in vitro with VV, harvested 12 h later, and used to stimulate splenocytes from VV-infected mice. As shown in Fig. 2C, we found that VV infection of mice elicited a potent virus-specific CD8 T-cell response. At day 7 postinfection, up to 30% of the CD8 T cells from VV-infected mice produced IFN-γ following stimulation with VV-infected BALB Cl7 cells. The production of IFN-γ was specific for VV, because it was not seen after stimulation with uninfected or LCMV-infected BALB Cl7 cells (Fig. 2C). Therefore, VV infection of BALB/c mice generates a potent, virus-specific CD8 T-cell response, and this response can be readily detected using virus-infected syngeneic cell lines.
Analyzing virus-specific CD4 T-cell responses.
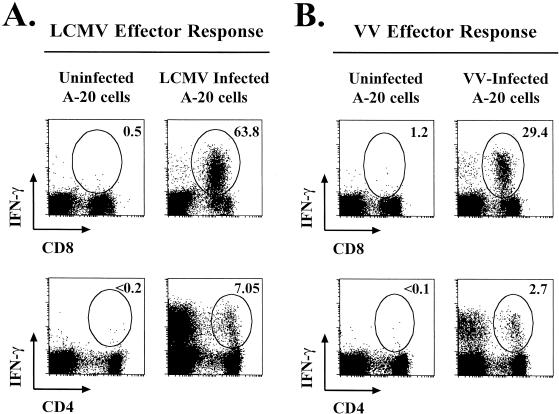
We also wanted to analyze virus-specific CD4 T-cell responses after infection, so we again used the technique described above, except that we infected A-20 cells, a B-cell lymphoma line that expresses both MHC class I and II molecules. As shown in Fig. 3, both LCMV-specific CD8 and CD4 T cells were detectable following stimulation with LCMV-infected A-20 cells, indicating that this cell line could efficiently present viral epitopes to both CD8 and CD4 T cells. We next determined VV-specific CD8 and CD4 T-cell responses by using VV-infected A-20 cells. At the peak of the effector T-cell response, approximately 30% of the CD8 T cells were VV specific (Fig. 3B); these data confirm results obtained after stimulation with VV-infected BALB Cl7 cells (Fig. 2C). VV-specific effector CD4 T-cell responses were also analyzed. On day 7 after VV infection, ∼3% of the CD4 T cells were VV specific, as shown by intracellular IFN-γ staining (Fig. 3B). These data show that VV infection of mice elicits both virus-specific CD8 and CD4 T-cell responses.
FIG. 3.
LCMV- and VV-specific CD4 and CD8 T-cell responses. LCMV-specific T-cell responses were analyzed on day 8 after infection (A), and VV-specific T-cell responses were analyzed on day 7 after infection (B). Splenocytes from infected mice were stimulated with uninfected A-20 cells (B-cell line expressing both MHC class I and II molecules), LCMV-infected A-20 cells, or VV-infected A-20 cells, and intracellular IFN-γ staining was performed to determine the frequencies of virus-specific CD8 and CD4 T cells. The percentages of the CD8 or CD4 T cells that were IFN-γ+ are indicated in the upper right corners of the corresponding panels.
Virus-specific T cells produce multiple cytokines in response to antigen.
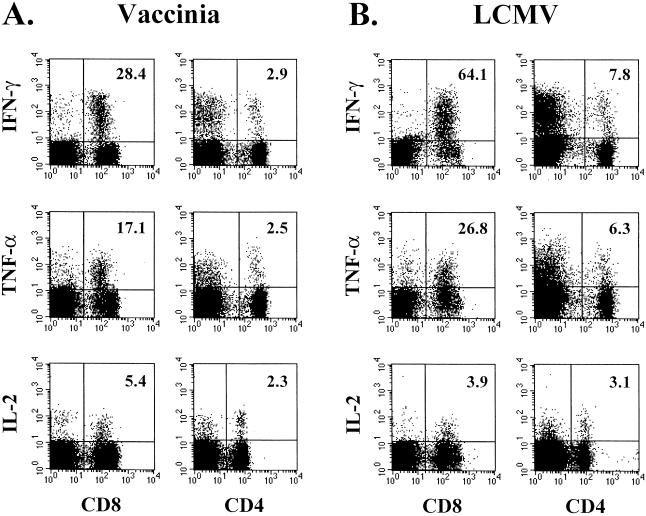
The above experiments analyzed virus-specific T cells by the production of the antiviral cytokine IFN-γ. It is also important to know what other cytokines are produced by virus-specific T cells. Therefore, we analyzed the ability of virus-specific effector CD8 T cells to make the cytokines TNF-α and IL-2, in addition to IFN-γ. Figure 4 shows that both the VV- and LCMV-specific effector CD8 T cells were able to produce all three cytokines, although at differing frequencies. Following stimulation with VV-infected A-20 cells, 28% of the CD8 T cells produced IFN-γ, 17% made TNF-α, and only 5.4% produced IL-2. A similar pattern of cytokine production was seen for the LCMV-specific effector CD8 T cells. Furthermore, we wanted to determine the cytokine profiles of the VV- and LCMV-specific effector CD4 T cells. After both VV and LCMV infection of mice, the virus-specific effector CD4 T cells were capable of producing IFN-γ, TNF-α, and IL-2; the frequency of cells making each cytokine is shown in Fig. 4. As seen with the virus-specific CD8 T cells, the frequency of the CD4 T cells producing IFN-γ was higher than the frequency of those making TNF-α or IL-2, whereas the differences in frequencies were not as dramatic as those for the CD8 T cells.
FIG. 4.
IFN-γ, TNF-α, and IL-2 production by virus-specific CD8 and CD4 T cells. Splenocytes collected from BALB/c mice on day 7 after VV infection (A) or on day 8 after LCMV infection (B) were stimulated with the corresponding virus-infected A-20 cells for 5 h in vitro. Cell surfaces were stained with anti-CD8α or anti-CD4, and then cells were intracellularly stained with anti-IFN-γ, anti-TNF-α, or anti-IL-2. The percentages of CD8 or CD4 T cells producing each cytokine are indicated in the upper right corners of the corresponding panels.
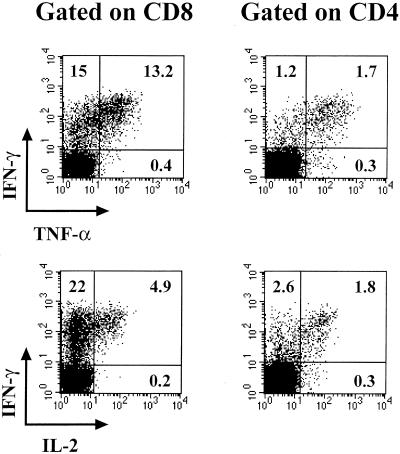
Dual staining for intracellular cytokines was performed on VV-specific effector CD8 and CD4 T cells to determine if there were three entirely different populations of virus-specific T cells or if there were subsets within the IFN-γ-producing population. In general, the VV-specific CD8 and CD4 T cells all produced IFN-γ (Fig. 5). The virus-specific CD8 and CD4 T cells can be divided into three separate subsets based on the cytokine pattern: IFN-γ+ only (single producers), IFN-γ+ TNF-α+ (double producers), and IFN-γ+ TNF-α+ IL-2+ (triple producers). Table 1 shows the percentages of the total VV-specific CD8 and CD4 T cells that could be divided into each of these populations. Approximately 50% of the VV-specific CD8 and CD4 T cells produced only IFN-γ. Of the remaining VV-specific CD8 T cells, about 25% were double producers (IFN-γ+ TNF-α+) and 16% were triple producers (IFN-γ+ TNF-α+ IL-2+). For the other VV-specific CD4 T cells, only 8% were double producers while 41% were triple producers. Together, these data show that virus-specific T cells are capable of producing multiple cytokines, however, IFN-γ is the major cytokine made by both the VV-specific CD8 and CD4 T cells.
FIG. 5.
Three populations of virus-specific effector T cells. Splenocytes collected from BALB/c mice on day 7 after VV infection were stimulated in vitro with VV-infected A-20 cells and costained intracellularly for either IFN-γ and TNF-α (top panels) or IFN-γ and IL-2 (bottom panels). The data shown are gated on either CD8 or CD4 T cells, and the numbers within the panels represent the frequencies of the CD8 or CD4 T cells producing each cytokine.
TABLE 1.
Cytokine-producing T-cell subset frequenciesa
| Cytokine(s) produced | % CD8 | % CD4 |
|---|---|---|
| IFN-γ | 59 | 51 |
| IFN-γ, TNF-α | 25 | 8 |
| IFN-γ, TNF-α, IL-2 | 16 | 41 |
The frequencies of VV-specific CD8 and CD4 T cells producing the indicated cytokine profiles were determined at the peak of the T-cell response (day 7 postinfection) by intracellular cytokine staining.
In vivo dynamics of VV- and LCMV-specific CD8 and CD4 T-cell responses.
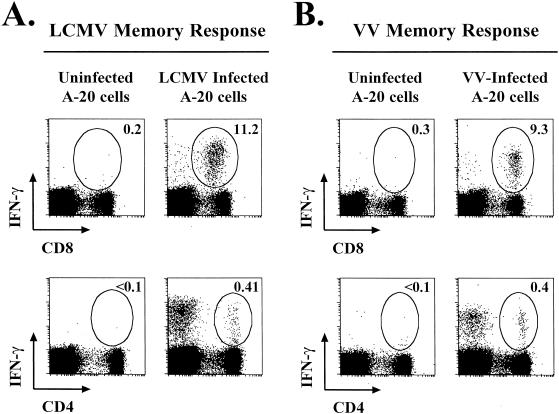
We next analyzed the duration of VV-specific CD4 and CD8 T-cell responses. VV-specific memory T-cell responses were determined at late time points after infection (after day 200). As shown in Fig. 6, VV-specific CD8 and CD4 T cells were maintained at increased frequencies in immune mice. Between 6 and 12% of the CD8 T cells were specific for VV, and this memory was maintained for all time points analyzed (up to 300 days postinfection). VV-specific CD4 memory was also sustained at these late time points; between 0.3 and 0.5% of the CD4 T cells were specific for VV (Fig. 6B). Together, these data show that VV infection of mice induces a potent, virus-specific effector T-cell response that gives rise to long-lived VV-specific CD8 and CD4 T-cell memory.
FIG. 6.
Virus-specific memory CD8 and CD4 T-cell responses. Memory CD8 and CD4 T-cell responses were determined more than 200 days following LCMV (A) or VV (B) infection. Responses were analyzed by intracellular IFN-γ staining after stimulation with virus-infected A-20 cells. The percentages of CD8 and CD4 T cells producing IFN-γ are indicated in the upper right corners of the corresponding panels.
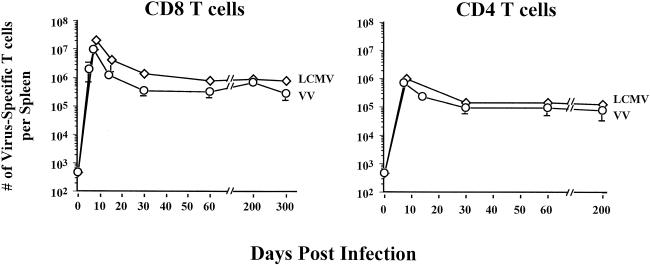
Taking all data together, we were able to enumerate the VV-specific T cells, through all phases of the antiviral T-cell response, and compare these responses to those elicited after an acute LCMV infection. We assessed both VV- and LCMV-specific T cells by using intracellular IFN-γ staining because we had previously determined that all of the virus-specific T cells produced IFN-γ. As shown in Fig. 7, the kinetics and magnitudes of the VV-specific CD8 and CD4 T-cell responses paralleled those of LCMV-specific CD8 and CD4 T cells. At the peak of the effector T-cell response to VV (day 7), there were ∼107 specific CD8 T cells and ∼106 specific CD4 T cells; this is comparable to the size of the LCMV-specific T-cell response at its peak. As with other acute infections, the VV-specific T cells passed through a contraction phase, in which ≥90% of the VV-specific T cells underwent cell death, resulting in a stable pool of VV-specific memory T cells. In VV-immune mice, there were approximately 6 × 10⁵ to 7 × 10⁵ VV-specific CD8 T cells and 1.5 × 10⁵ VV-specific CD4 T cells, and these levels of memory persisted for >200 days (Fig. 7). These data show that massive virus-specific T-cell responses are seen following VV infection of mice and that the magnitude of this response is similar to that induced by LCMV infection. Also, these data demonstrate that infection of mice with VV generates a stable pool of VV-specific memory CD8 and CD4 T cells.
FIG. 7.
Kinetics of virus-specific CD4 and CD8 T-cell responses. The total numbers of VV (○)- and LCMV (⋄)-specific CD8 and CD4 T cells were quantitated by intracellular IFN-γ staining on the indicated days after infection. The error bars indicate standard deviations.
Comparison of specific T-cell responses induced against the VV vector and an inserted epitope.
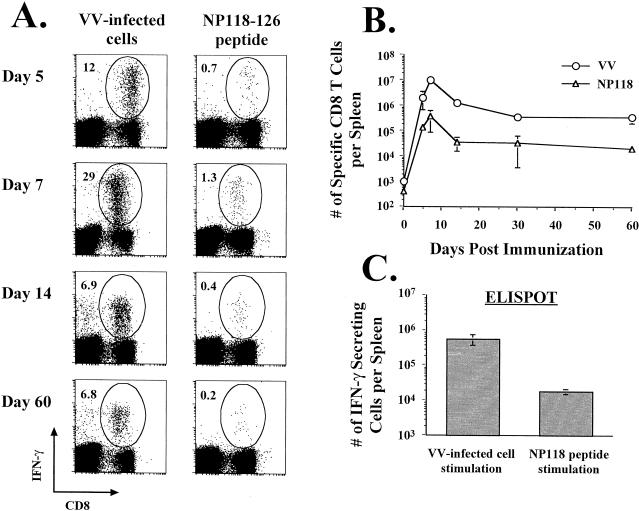
Following immunization with rVV, which expresses a foreign gene(s), antigen-specific T-cell responses are induced to the inserted gene. What is not known is the relationship between the specific T-cell response elicited by the rVV backbone and that directed against the gene of choice. We examined this by immunizing naive BALB/c mice with an rVV expressing the dominant NP118-126 epitope of LCMV (18) and measuring both the NP118- and VV-specific CD8 T-cell responses (Fig. 8). As early as day 5 after infection, both NP118- and VV-specific CD8 T cells could be detected, with a much higher frequency of VV-specific T cells (0.7% NP118 specific versus 12% VV specific). At the peaks of both of these responses (day 7), the VV-specific CD8 T-cell response was approximately 20-fold greater than the NP118-specific response. These differences in responses were maintained in the memory population; at day 200, there were about 7 × 10⁵ to 8 × 10⁵ VV-specific CD8 T cells and only 2 × 10⁴ to 4 × 10⁴ NP118-specific CD8 T cells (Fig. 8B and C). These data bring to light the impressive magnitude of the specific immune response elicited by the rVV backbone compared to that directed against the inserted gene.
FIG. 8.
Comparison of CD8 T-cell responses to the vector with those to the foreign epitope. BALB/c mice were immunized with VV-NP118, and the frequencies (A) and numbers (B) of VV-specific and NP118-specific CD8 T cells were determined by intracellular IFN-γ staining (A and B) or by IFN-γ ELISPOT analysis (C). In panel A, the results for one representative mouse are shown at each time point (n ≥ 8 mice per time point), and the percentages of CD8 T cells producing IFN-γ are indicated in the upper left corners of the corresponding panels. (C) The VV- and NP118-specific memory T-cell responses in mice infected with VV-NP118 >200 days earlier were quantitated by IFN-γ ELISPOT analysis. The error bars represent standard deviations.
DISCUSSION
In this study, we showed that there is a massive virus-specific T-cell response elicited following acute VV infection of BALB/c mice. We analyzed the VV-specific T-cell responses at different times after infection and found that they were comparable in magnitude to those induced by an acute LCMV infection (10). To perform the analysis of VV-specific T cells, we developed an assay that allowed for the quantitation of virus-specific T-cell responses, because the CD8 and CD4 T-cell epitopes are not known for VV. We found that by using virus-infected cell lines expressing both MHC class I and II molecules we could stimulate the specific T cells to produce cytokines, which could be detected by intracellular cytokine staining. Stimulation with uninfected or irrelevant-virus-infected cells did not induce cytokine production; therefore, this technique is specific. Using this simple method, we were able to quantitate the CD8 and CD4 T-cell responses to both LCMV and VV. In the future, an approach similar to this one might aid in the analysis of other virus-specific T-cell responses, especially when the CD8 and CD4 epitopes are not known (6a, 9a).
Following infection of BALB/c mice with VV, direct ex vivo CTL activity could be detected, and there was a dramatic increase in the proportion of the CD8 T cells that upregulated the activation marker LFA-1. Using VV-infected cell lines, we were able to detect VV-specific CD8 and CD4 T cells by determining the production of IFN-γ, and these IFN-γ-producing cells were in fact LFA-1hi (data not shown). We found that at the peak of the T-cell response, as many as 30% of the CD8 T cells (approximately 107 cells) were specific for VV epitopes. There was also a significant VV-specific CD4 T-cell response, consisting of ∼3% of the CD4 T cells in the spleen (∼106 specific CD4 T cells). Furthermore, we were able to detect VV-specific memory CD8 and CD4 T cells that persisted at elevated frequencies for more than 200 days postinfection. As many as 10% of the CD8 T cells and 0.4% of the CD4 T cells were specific for VV at these late time points. In all, these data show that acute infection of mice with VV induces a potent antiviral effector T-cell response and VV-specific T-cell memory.
In addition to quantitating the VV-specific T-cell responses, the cytokine profiles of the VV-specific effector T cells were determined. We showed that a subset population of VV-specific T cells could produce multiple cytokines. Recently published reports have shown similar findings following LCMV infection of mice (15, 17). Slifka and Whitton showed that a proportion of the LCMV-specific effector CD8 T cells made both IFN-γ and TNF-α (15). Moreover, Varga and Welsh showed that LCMV-specific CD4 T cells were capable of producing IFN-γ, TNF-α, and IL-2 (17). We have shown that there are three different populations of VV-specific T cells on day 7 after VV infection: the single producers (IFN-γ+ only), the double producers (IFN-γ+ and TNF-α+), and the triple producers (IFN-γ+, TNF-α+, and IL-2+). All three of these groups of cells were capable of making IFN-γ, while the production of TNF-α and IL-2 differed. More than 50% of the VV-specific CD8 T cells could make only IFN-γ, but <20% were able to produce all three cytokines. The VV-specific CD4 T cells displayed a slightly different pattern of cytokine production. Again, close to 50% of the VV-specific CD4 T cells were single producers, whereas >40% made IFN-γ, TNF-α, and IL-2. It is interesting that the proportion of the virus-specific CD4 T cells that produced IL-2 was much greater than the fraction of the virus-specific CD8 T cells that made IL-2. This may be due to the differential roles that these cells play in an antiviral immune response. For example, one of the major functions of the virus-specific CD4 T cells may be to make IL-2, whereas it may be more important for the virus-specific CD8 T cells to produce IFN-γ and TNF-α (i.e., effector molecules) rather than IL-2.
The implications of this study are important for the future design of vaccines. In designing vaccines, not only will it be important to know the magnitude of the immune response that is elicited against the inserted gene of choice, but it will also be important to know how strong a response is generated against the viral vector (20). Using an rVV expressing an LCMV epitope, we have shown that the CD8 T-cell response to the foreign epitope is coordinately regulated with the response to the VV vector but the response directed against VV is much greater in magnitude than the response against the inserted epitope. If the same vaccine were used to prime and subsequently boost specific immune responses, it is likely that there would be an increase in the responses specific for both the inserted gene and the virus backbone (13). It is also possible that the antiviral response that is specific for the viral vector could prevent the boosting of the response specific for the inserted gene. Moreover, preexisting memory against the virus backbone may inhibit its use as a viral vector for other vaccination purposes. Therefore, using vaccine constructs that possess limited replication within the host, such as modified VV Ankara, may be most efficient for vaccination purposes, because they are less apt to induce immunity against themselves but can still prime protective immunity against the gene of choice (5, 11, 12). Also, a recent report has described unexpected interactions between memory T cells specific for heterologous viruses (3). In the future, it will be important to study the immune response directed against the vector, along with that specific for the gene of choice (13, 20). This information will be crucial for designing efficient vaccination regimens, such as different priming and boosting combinations.
Acknowledgments
This work was supported by NIH grant AI30048 to R.A.
We thank Patryce Mahar, Dan Heard, and Kaja Madhavi Krishna for their technical assistance, Casey Weaver for reagents, and members of the Ahmed lab for helpful discussions.
REFERENCES
- 1.Altenburger, W., C. P. Suter, and J. Altenburger. 1989. Partial deletion of the human host range gene in the attenuated vaccinia virus MVA. Arch. Virol. 105:15-27. [DOI] [PubMed] [Google Scholar]
- 2.Carroll, M. W., and B. Moss. 1997. Poxviruses as expression vectors. Curr. Opin. Biotechnol. 8:573-577. [DOI] [PubMed] [Google Scholar]
- 3.Chen, H. D., A. E. Fraire, I. Joris, M. A. Brehm, R. M. Welsh, and L. K. Selin. 2001. Memory CD8+ T cells in heterologous antiviral immunity and immunopathology in the lung. Nat. Immunol. 2:1067-1076. [DOI] [PubMed] [Google Scholar]
- 4.Demkowicz, W. E., Jr., and F. A. Ennis. 1993. Vaccinia virus-specific CD8+ cytotoxic T lymphocytes in humans. J. Virol. 67:1538-1544. [DOI] [PMC free article] [PubMed] [Google Scholar]
- 5.Hanke, T., T. J. Blanchard, J. Schneider, C. M. Hannan, M. Becker, S. C. Gilbert, A. V. Hill, G. L. Smith, and A. McMichael. 1998. Enhancement of MHC class I-restricted peptide-specific T cell induction by a DNA prime/MVA boost vaccination regime. Vaccine 16:439-445. [DOI] [PubMed] [Google Scholar]
- 6.King, C. C., R. de Fries, S. R. Kolhekar, and R. Ahmed. 1990. In vivo selection of lymphocyte-tropic and macrophage-tropic variants of lymphocytic choriomeningitis virus during persistent infection. J. Virol. 64:5611-5616. [DOI] [PMC free article] [PubMed] [Google Scholar]
- 6a.Larsson, M., X. Jin, B. Ramratnam, G. S. Ogg, J. Engelmayer, M. A. Demoitie, A. J. McMichael, W. I. Cox, R. M. Steinman, D. Nixon, and N. Bhardwaj. 1999. A recombinant vaccinia virus based ELISPOT assay detects high frequencies of Pol-specific CD8 T cells in HIV-1-positive individuals. AIDS 13:767-777. [DOI] [PubMed] [Google Scholar]
- 7.Lau, L. L., B. D. Jamieson, T. Somasundaram, and R. Ahmed. 1994. Cytotoxic T-cell memory without antigen. Nature 369:648-652. [DOI] [PubMed] [Google Scholar]
- 8.Matloubian, M., S. R. Kolhekar, T. Somasundaram, and R. Ahmed. 1993. Molecular determinants of macrophage tropism and viral persistence: importance of single amino acid changes in the polymerase and glycoprotein of lymphocytic choriomeningitis virus. J. Virol. 67:7340-7349. [DOI] [PMC free article] [PubMed] [Google Scholar]
- 9.Matloubian, M., T. Somasundaram, S. R. Kolhekar, R. Selvakumar, and R. Ahmed. 1990. Genetic basis of viral persistence: single amino acid change in the viral glycoprotein affects ability of lymphocytic choriomeningitis virus to persist in adult mice. J. Exp. Med. 172:1043-1048. [DOI] [PMC free article] [PubMed] [Google Scholar]
- 9a.Moretto, W. J., L. A. Drohan, and D. F. Nixon. 2000. Rapid quantification of SIV-specific CD8 T cell responses with recombinant vaccinia virus ELISPOT or cytokine flow cytometry. AIDS 14:2625-2627. [DOI] [PubMed] [Google Scholar]
- 10.Murali-Krishna, K., J. D. Altman, M. Suresh, D. J. Sourdive, A. J. Zajac, J. D. Miller, J. Slansky, and R. Ahmed. 1998. Counting antigen-specific CD8 T cells: a reevaluation of bystander activation during viral infection. Immunity 8:177-187. [DOI] [PubMed] [Google Scholar]
- 11.Ramirez, J. C., M. M. Gherardi, and M. Esteban. 2000. Biology of attenuated modified vaccinia virus Ankara recombinant vector in mice: virus fate and activation of B- and T-cell immune responses in comparison with the Western Reserve strain and advantages as a vaccine. J. Virol. 74:923-933. [DOI] [PMC free article] [PubMed] [Google Scholar]
- 12.Ramirez, J. C., M. M. Gherardi, D. Rodriguez, and M. Esteban. 2000. Attenuated modified vaccinia virus Ankara can be used as an immunizing agent under conditions of preexisting immunity to the vector. J. Virol. 74:7651-7655. [DOI] [PMC free article] [PubMed] [Google Scholar]
- 13.Ramshaw, I. A., and A. J. Ramsay. 2000. The prime-boost strategy: exciting prospects for improved vaccination. Immunol. Today 21:163-165. [DOI] [PubMed] [Google Scholar]
- 14.Schaffner, J. W., U. Dittmer, A. Otteken, C. Coulibaly, W. Bodemer, G. Voss, and G. Hunsmann. 1994. Comparison of humoral immunity and induction of proliferating T lymphocytes in vaccinia virus-infected rabbits and rhesus macaques. Am. J. Vet. Res. 55:1250-1255. [PubMed] [Google Scholar]
- 15.Slifka, M. K., and J. L. Whitton. 2000. Activated and memory CD8+ T cells can be distinguished by their cytokine profiles and phenotypic markers. J. Immunol. 164:208-216. [DOI] [PubMed] [Google Scholar]
- 16.Sutter, G., and B. Moss. 1992. Nonreplicating vaccinia vector efficiently expresses recombinant genes. Proc. Natl. Acad. Sci. USA 89:10847-10851. [DOI] [PMC free article] [PubMed] [Google Scholar]
- 17.Varga, S. M., and R. M. Welsh. 2000. High frequency of virus-specific interleukin-2-producing CD4+ T cells and Th1 dominance during lymphocytic choriomeningitis virus infection. J. Virol. 74:4429-4432. [DOI] [PMC free article] [PubMed] [Google Scholar]
- 18.Whitton, J. L., N. Sheng, M. B. Oldstone, and T. A. McKee. 1993. A “string-of-beads” vaccine, comprising linked minigenes, confers protection from lethal-dose virus challenge. J. Virol. 67:348-352. [DOI] [PMC free article] [PubMed] [Google Scholar]
- 19.Zajac, A. J., R. E. Vance, W. Held, D. J. Sourdive, J. D. Altman, D. H. Raulet, and R. Ahmed. 1999. Impaired anti-viral T cell responses due to expression of the Ly49A inhibitory receptor. J. Immunol. 163:5526-5534. [PubMed] [Google Scholar]
- 20.Zavala, F., M. Rodrigues, D. Rodriguez, J. R. Rodriguez, R. S. Nussenzweig, and M. Esteban. 2001. A striking property of recombinant poxviruses: efficient inducers of in vivo expansion of primed CD8+ T cells. Virology 280:155-159. [DOI] [PubMed] [Google Scholar]


