

Abstract
Abstract. Reviewed are the methods aimed to detect DNA damage in individual cells, estimate its extent and relate it to cell cycle phase and induction of apoptosis. They include the assays that reveal DNA fragmentation during apoptosis, as well as DNA damage induced by genotoxic agents. DNA fragmentation that occurs in the course of apoptosis is detected by selective extraction of degraded DNA. DNA in chromatin of apoptotic cells shows also increased propensity to undergo denaturation. The most common assay of DNA fragmentation relies on labelling DNA strand breaks with fluorochrome‐tagged deoxynucleotides. The induction of double‐strand DNA breaks (DSBs) by genotoxic agents provides a signal for histone H2AX phosphorylation on Ser139; the phosphorylated H2AX is named γH2AX. Also, ATM‐kinase is activated through its autophosphorylation on Ser1981. Immunocytochemical detection of γH2AX and/or ATM‐Ser1981(P) are sensitive probes to reveal induction of DSBs. When used concurrently with analysis of cellular DNA content and caspase‐3 activation, they allow one to correlate the extent of DNA damage with the cell cycle phase and with activation of the apoptotic pathway. The presented data reveal cell cycle phase‐specific patterns of H2AX phosphorylation and ATM autophosphorylation in response to induction of DSBs by ionizing radiation, topoisomerase I and II inhibitors and carcinogens. Detection of DNA damage in tumour cells during radio‐ or chemotherapy may provide an early marker predictive of response to treatment.
DNA FRAGMENTATION DURING APOPTOSIS
Involvement of different nucleases in DNA fragmentation
Condensation of chromatin and internucleosomal DNA fragmentation, together with cell shrinkage and shedding of apoptotic bodies (‘blebbing’), are widely recognized hallmarks of apoptosis (Kerr et al. 1972; Arends et al. 1990; Nagata 2000; Nagata et al. 2003). Several nucleases have been identified as contributing towards DNA degradation; their activity is modulated by divalent cations. Depending on cation concentration, three distinct steps of DNA fragmentation, likely mediated by different enzymes, can be identified: (i) in the presence of Mg2+ (2 mm, DNA is fragmented to about 0.05–1 megabase (Mb)‐size sections (type‐I, high molecular weight DNA fragmentation)); (ii) at low (nanomolar) Ca2+ concentration, nuclear DNA is cleaved into intermediate (∼300 kb) fragments (type‐II, intermediate DNA fragmentation); (iii) at micromolar levels of Ca2+, internucleosomal (type‐III) DNA fragmentation takes place leading to formation of DNA sections of the size of mono and oligonucleosomes, which form a characteristic ‘DNA‐ladder’ pattern during electrophoresis (Arends et al. 1990).
Among the nucleases associated with DNA fragmentation during apoptosis, the best characterized is CAD (caspase‐activated DNase) with its inhibitor ICAD (inhibitor of CAD) in mice, and its human homologue DFF40/DFF45 (DNA fragmentation factor) (Enari et al. 1998). CAD and ICAD (or DFF40 and DFF45) remain inactive in a complex with its respective inhibitor until proteolytic cleavage of the inhibitor by activated caspase during apoptosis leads to their activation (Fig. 1). These DNases then translocate to the nucleus where they cleave DNA between nucleosomes. In some human tissues, DNase‐X appears to substitute of DFP40 (Los et al. 2000). CIDE‐A and CIDE‐B (CIDE: cell death‐inducing DFF45‐like effector) show significant similarity with DFF45 and, when overexpressed, induce apoptosis (Inohara et al. 1998). Also involved in DNA fragmentation during apoptosis is DNase‐I, initially crystallized by Kunitz (1950). Its activity is modulated by Ca2+ and Mg2+ and inhibited by Zn2+ (Walker et al. 1994). DNase‐I is localized in the perinuclear space (Peitsch 1993) and its overexpression induces apoptosis (Polzar et al. 1993). Other nucleases linked to apoptotic DNA fragmentation are human DNAS1L3 (Boulares et al. 2002; Boulares & Ren 2004), NUC18 (Gaido & Cidlowski 1991) and NUC70 (Urbano et al. 1998), all activated by Ca2+ and Mg2+ and blocked by Zn2+. Acidic endonucleases such as DNase‐II (Barry & Eastman 1993) and L‐DNase‐II (Scovassi & Torriglia 2003) also appear to be involved in DNA degradation during apoptosis. It should also be mentioned that AIF (apoptosis inducing factor), the protein which is released from the intermembrane compartment of mitochondria, is also capable of inducing chromatin condensation and DNA cleavage on megabase‐size fragments (Susin et al. 1999).
Figure 1.

Internucleosomal fragmentation of DNA during apoptosis makes it possible to identify apoptotic cells based on a deficit in their DNA content. Caspase‐activated DNase (CAD), one of the enzymes that cleaves DNA during apoptosis, remains in complex (ICAD) with its inhibitor until it is activated by effector caspase‐3 or ‐7 (a). Internucleosomal DNA fragmentation by CAD leads to formation of DNA fragments of the discrete size of mono (∼200 bp) and oligo‐nucleosomes (b) which are revealed as a characteristic ‘laddering’ pattern during electrophoresis (c). The small‐size DNA fragments are extracted during the staining procedure and apoptotic cells (Ap) can then be identified on DNA content frequency histograms as cells with a fractional DNA content (‘sub‐G1’).
Detection of cells with fractional DNA content after extraction of low molecular weight DNA
When apoptotic cells are fixed in precipitating fixatives such as ethanol, methanol or acetone, or permeabilized by detergent, the small‐size fragments of DNA, the product of internucleosomal DNA cleavage during apoptosis, are often extracted from the cells during their staining in aqueous solutions (Fig. 1). As a consequence of DNA loss, apoptotic cells end up with deficit in their DNA content, and when stained with a DNA‐specific fluorochrome they can be recognized as having a fractional DNA content. On DNA content frequency histograms, they often form a characteristic, ‘sub‐G1’ or ‘hypodiploid’ peak (Umansky et al. 1981; Nicoletti et al. 1991; Gong et al. 1994). Shedding apoptotic bodies containing fragments of nuclear chromatin additionally contributes to the loss of DNA from apoptotic cells. Identification of a sub‐G1 cell population is usually carried out to estimate the frequency of apoptotic cells (apoptotic index; AI) (Darzynkiewicz et al. 1992). Commercially available software designed to deconvolute DNA frequency histograms to estimate the proportion of cells in particular phases of the cell cycle often allows one to quantify the percentage of apoptotic cells in the ‘sub‐G1’ peak.
It is desirable that the ‘sub‐G1’ peak representing apoptotic cells should be separated from the G1 peak of the non‐apoptotic cell population, with no overlap between them (Fig. 1e). However, the degree of extraction of fragmented DNA varies depending on the extent of DNA degradation (duration of apoptosis), the number of cell washings, pH and salt concentration of the washing and staining buffers. Although extraction of DNA from apoptotic cells can be enhanced by rinsing cells in high molarity buffer prior to staining (Gong et al. 1994), separation of the ‘sub‐G1’ peak is not always achievable. Furthermore, when DNA fragmentation during apoptosis terminates at 50–300 kb fragments and does not proceed to internucleosomal sized fragments (Oberhammer et al. 1993), little DNA can be extracted and this approach fails to identify apoptotic cells in such instances. It should also be noted that the extraction of DNA from apoptotic G2, M or S phase may not be adequate to have them at the ‘sub‐G1’ peak position as they may end up as ‘sub‐G2M’ or ‘sub‐S’ peaks, located on DNA content histograms in place of S‐ and G1‐phase peaks, respectively. Figure 2b illustrates such a case when the NF‐κB inhibitor parthenolide initially arrested HL‐60 cells in G1 and G2M, after which both populations underwent apoptosis giving rise to the populations marked Ap1 and Ap2, respectively (Pozarowski et al. 2003). Figure 2(c and d) also demonstrate that bivariate analysis of cellular DNA and RNA content, which allows one to distinguish G0 from G1 cells based on differences in their RNA content (1976, 1980), also makes it possible to reveal whether G0 or G1 cells preferentially undergo apoptosis (Bruno et al. 1992).
Figure 2.

Detection of apoptotic cells based on a deficit in their DNA content following differential staining of cellular DNA and RNA with the metachromatic dye acridine orange (AO; Darzynkiewicz et al. 1976). (a, b) Human leukaemic HL‐60 cells, untreated (a) and treated for 7 h with 30 µm of the NF‐κB inhibitor parthenolide (b). Parthenolide induces transient arrest in G2/M phase followed by apoptosis (Pozarowski et al. 2003). Note two distinct clusters of cells with fractional DNA content representing the cells that underwent apoptosis while in G1‐ (Ap1) or in G2/M‐phase (Ap2). On the DNA content frequency histogram these cells are represented by a distinct ‘sub‐G1’and an early S peak, respectively (arrows). (c, d) Human peripheral blood lymphocytes incubated for 3 days in the absence (c) and presence of the polyvalent mitogen phytohemagglutin (PHA), together with the cytotoxic ribonuclease onconase (d) (Halicka et al. 2002). Non‐stimulated (G0) cells have minimal RNA content which distinguishes them from G1 cells (1976, 1980). Mitogenic stimulation with PHA causes so‐called ‘activation‐induced apoptosis’ which is amplified by onconase (Halicka et al. 2002). Note that the cells with fractional DNA content (Ap) have low RNA content which indicates that the cells that preferentially underwent ‘activation‐induced apoptosis’ were G0 lymphocytes. Bivariate analysis of DNA and RNA content, thus, allows one to distinguish whether apoptosis is selective to G1 (c) or G0 (d) cells (Bruno et al. 1992).
Instead of fixation, hypotonic solutions containing detergent are often used to make cells permeable to the dye in DNA staining protocols (Nicoletti et al. 1991). Such treatment causes lysis of the plasma membrane which leads to significant bias in estimation of the apoptotic index. The bias stems from the fact that nuclei of apoptotic cells are often fragmented and therefore several chromatin fragments are released from a single lysed cell. Furthermore, lysis of mitotic cells releases individual chromosomes or chromosome aggregates. In the case of micronucleation (e.g. after cell irradiation or treatment with clastogens) the micronuclei are released as well. Each nuclear fragment, chromosome, or micronucleus is recorded by a flow cytometer as an individual object characterized by a ‘sub‐G1’ DNA content, and therefore often erroneously classified as an individual apoptotic cell. This bias is particularly evident when a logarithmic scale is used to display DNA content on the histograms, which allows one to record events with as little as 1%, or even 0.1% of the DNA content of a G1 cell. Such events certainly cannot be classified as individual apoptotic nuclei, and their percentage grossly exceeds the actual percentage of apoptotic cells in the sample. It should be noted, however, that cell permeabilization with detergent in isotonic solution, particularly in the presence of serum proteins (e.g. as in the protocols for differential staining of RNA and DNA with acridine orange (AO)) (Darzynkiewicz et al. 1976; Traganos et al. 1977) does not lyse the cells and therefore can be used to quantify apoptotic cells, identifying them as cells with a fractional DNA content (Fig. 1).
Increased propensity of DNA to undergo denaturation
Free DNA in aqueous solutions at physiological pH and ionic strength has a double‐stranded structure. Its exposure to heat, acid or alkali causes the two strands to unwind and separate. This is known as DNA denaturation or melting and is the consequence of destruction of the hydrogen bonding between the paired bases of the opposite strands. The sensitivity of free DNA to denaturation depends on its GC/AT ratio, because, as a result of an additional hydrogen bond, the GC pair confers increased stability compared with AT. In nuclear chromatin, DNA is additionally stabilized by interactions with histones and other proteins and the degree of stability depends on chromatin structure (Darzynkiewicz 1990). The cytometric method for assaying the sensitivity of DNA in situ to denaturation utilizes the metachromatic property of AO. Namely, following cell fixation, permeabilization and removal of RNA by incubation with RNase, cells are treated with heat or acid to induce partial denaturation of DNA and subsequently stained with AO. The dye binding to denatured single‐stranded (ss) DNA sections gives rise to red fluorescence (> 600 nm) while AO that intercalates into double‐stranded (ds) DNA sections fluoresces green (530 nm) (Fig. 3a; Darzynkiewicz 1990). There are significant differences in DNA resistance to denaturation between various cell types as well as between cells in different phases of the cell cycle (Darzynkiewicz et al. 1977). Generally, DNA in condensed chromatin (heterochromatin) is more susceptible to undergo denaturation compared with DNA in dispersed chromatin (euchromatin). Hence, the cells with condensed chromatin such as mitotic and G0 cells can be distinguished from interphase cells after their exposure to heat or acid and staining with AO (Fig. 3b). The uneven pattern of chromatin condensation along individual chromosomes manifests as differences in DNA susceptibility to denaturation as reflected by green‐red fluorescence chromosome banding (Dobrucki & Darzynkiewicz 2001). However, fragmented DNA in condensed chromatin of apoptotic cells is particularly susceptible to DNA denaturation (Fig. 3c). Identification of apoptotic cells based on the sensitivity of DNA to undergo denaturation measured as AO metachromasia by flow cytometry provided nearly identical estimates of apoptotic index as their distinction based on DNA fragmentation assays (Hotz et al. 1994). Interestingly, DNA in chromatin of abnormal and infertile sperm cells that shows fragmentation typical of apoptosis is also highly sensitive to denaturation (Gorczyca et al. 1993b). In fact, the increased propensity of DNA in sperm cells to acid‐induced denaturation measured by AO‐flow cytometry is now a widely used marker in infertility assays (Evenson et al. 1999). The damaged DNA in nuclei of cells subjected to ionizing radiation, similar to that in apoptotic cells, is also highly susceptible to denaturation and AO‐cytometry has been used to the estimate extent of the damage vis‐à‐vis radiation dose (Rydberg 1984).
Figure 3.
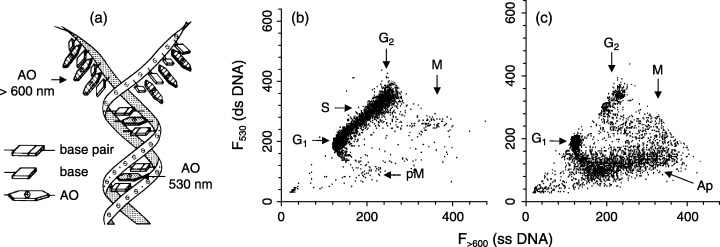
Decreased resistance of DNA in chromatin of apoptotic cells to HCl‐induced denaturation. The metachromatic dye acridine orange (AO) differentially stains double‐stranded versus denatured DNA. Namely, the dye fluoresces green (∼530 nm) when it intercalates between the neighbouring base pairs of the double‐stranded DNA, while its binding to single‐stranded DNA sections leads to red fluorescence (> 600 nm) (a). (b, c) Untreated (b) and topotecan‐treated (c) HL‐60 cells; their RNA was removed by incubation with RNase and DNA was subjected to partial denaturation by HCl‐treatment and stained with AO (Darzynkiewicz et al. 1977). The shift from 530 to > 600 nm emission reflects DNA denaturation. In the untreated culture (b) the mitotic (M) and immediately post‐mitiotic (pM) cells show an increased propensity to denaturation compared with interphase cells. The DNA topoisomerase I inhibitor topotecan induces apoptosis preferentially in S‐phase cells (Del Bino et al. 1991). Compared with non‐apoptotic cells, the cells undergoing apoptosis (Ap) show markedly decreased 530 nm‐ and increased > 600 nm fluorescence, indicative of extensive of DNA denaturation (c).
It should be noted that, as an alternative to the AO‐methodology, the presence of denatured DNA in chromatin can be detected immunocytochemically using antibodies reactive with ssDNA; this approach has been used to identify apoptotic cells by flow cytometry as well (Frankfurt 1999). However, whether using AO or immunocytochemical detection of DNA single strandedness as a marker of DNA damage during apoptosis, caution should be exercised to distinguish live cells with highly condensed chromatin such as mitotic or G0 cells from cells that undergo apoptosis. The distinction is particularly difficult, for instance, when cells that initially were arrested in mitosis, e.g. by microtubule poisons such as taxol or vinca alkaloids, subsequently die by apoptosis. The morphology of these cells has to be then assessed by microscopy to distinguish live from apoptotic mitotic cells. Chromosomes of the latter lose their structural framework and resemble spherical droplets of structureless chromatin which often coalesce with each other (1992, 1997).
Detection of DNA strand breaks (TUNEL assay)
Fragmentation of DNA during apoptosis generates a large number of DNA nicks (single‐strand breaks) and double‐strand breaks (DSBs) in the nucleus (Arends et al. 1990; Oberhammer et al. 1993). The nicks may be labelled by attaching fluorochrome‐tagged triphosphodeoxynucleotides in a reaction catalysed by exogenous DNA polymerase I (in situ nick translation, ISNT; Darzynkiewicz et al. 1992; Gold et al. 1994). The 3′‐OH termini in DSBs, in turn, can be labelled in a reaction employing terminal deoxynucleotidyltransferase (TdT; 1992, 1993a; Li & Darzynkiewicz 1995; 1995, 1996). The assay is often called ‘TUNEL’ from ‘TDT‐mediated dUTP‐biotin nick‐end labelling’ (Gavrieli et al. 1992). This acronym is a misnomer as DSBs rather than DNA nicks are labelled in this reaction. Several variants of this assay, as shown in Fig. 4, have been developed (Li et al. 1995). Of all the variants, the one based on incorporation of BrdUTP (Fig. 5) appears to be the most advantageous, in terms of high sensitivity, low cost and simplicity (Li & Darzynkiewicz 1995). In this variant, BrdU attached to DSBs (as poly BrdU) is detected with an FITC‐conjugated anti‐BrdU antibody. In fact, the very same antibody is used as the one that serves to detect BrdU incorporated during DNA replication (Dolbeare et al. 1983). However, poly BrdU at the site of DSBs is accessible to the antibody without the need for DNA denaturation, which otherwise is required to detect the precursor incorporated during DNA replication.
Figure 4.

Detection of DNA fragmentation during apoptosis using different variants of the assay of detection of DNA strand breaks by fluorochrome‐labelling‐3′OH termini in the reaction catalysed by exogenous terminal deoxynucleotidyl transferase (TdT). Bivariate distributions (contour maps) of DNA content versus DNA strand‐break labelling showing HL‐60 cells treated with 0.15 µm of the DNA topoisomerase I inhibitor camptothecin, which preferentially induces apoptosis of S‐phase cells (Del Bino et al. 1991). The three panels to the left illustrate indirect labelling, utilizing either BrdU (see Figure 5), digoxygenin‐conjugated dUTP (d‐dUTP), or biotinylated dUTP (b‐dUTP). The two right panels show cell distributions after a single‐step labelling with either BODIPY or FITC‐conjugated dUTP. The numbers show an n‐fold separation (note exponential scale) of the G1 versus apoptotic peak values of fluorescence intensity, in respective variants of the assay (Li & Darzynkiewicz 1995).
Figure 5.
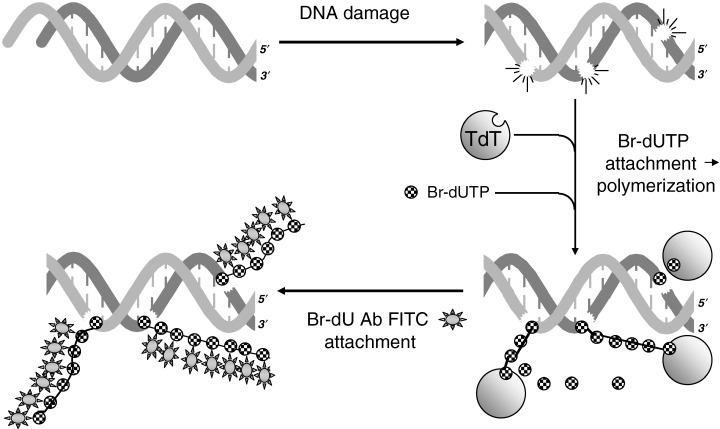
Schematic illustration of DNA strand‐break labelling by TdT‐mediated Br‐dUTP attachment to 3′OH ends and polymerization, followed by immunocytochemical (FITC) detection of BrdU.
The detection of DSBs by this assay requires prefixation of cells with a crosslinking agent such as formaldehyde. Unlike precipitating fixatives, formaldehyde prevents the extraction of small DNA fragments. Labelling DSBs in this procedure, which is accomplished with fluorescein‐conjugated anti‐BrdU antibody (Fig. 5), can be combined with the staining of DNA with another colour fluorochrome (e.g. PI, red fluorescence). Multiparameter cytometry of cells that are differentially stained for DNA strand breaks and for DNA allows one to distinguish apoptotic from non‐apoptotic cell subpopulations and to reveal the cell cycle distribution in these subpopulations, respectively (1992, 1993a). As is evident in Fig. 4, for example, camptothecin preferentially induces apoptosis of S‐phase cells. It should be noted, however, that, as a result of prior shedding of apoptotic bodies (which may contain nuclear fragments), or as a result of extensive DNA fragmentation such that even after fixation with formaldehyde, minute DNA fragments cannot be retained and therefore cells at later stages of apoptosis may have diminished DNA content. Such late apoptotic cells may have a sub‐G1 DNA content and be highly positive in the TUNEL assay. A variety of kits which represent all the variants of the assay as illustrated in Fig. 4, are commercially available. The TUNEL assay has been found particularly useful in clinical studies, to reveal the extent of apoptosis in relation to cell cycle phase during treatment of leukaemias (Gorczyca et al. 1993a; Halicka et al. 1997).
DETECTION OF DNA DAMAGE INDUCED BY GENOTOXIC AGENTS
The comet assay
Compared with the severity of DNA damage during apoptosis which generates an overabundance of DNA strand breaks, the DNA damage induced by genotoxic agents, including pharmacological doses of radiation and anti‐tumour drugs, is less extensive and therefore more difficult to be directly assayed by cytometry. Unless DNA damage is very extensive, the TUNEL assay is not sensitive enough to detect it. As mentioned earlier in this review, the detection of DNA propensity to undergo denaturation as measured by AO metachromasia, has been shown to detect DNA damage induced by ionizing radiation (Rydberg 1984), but this methodology has not been accepted in wider practice. During the past two decades, analysis of DNA damage in individual cells was essentially limited to a single‐cell‐DNA gel electrophoresis technique, the so‐called ‘comet’ assay. Individual cells with damaged DNA embedded in agarose gels, when subjected to an electric field, generate a characteristic pattern of DNA distribution which, after staining with a fluorochrome, results in an image that resembles a comet. The extent and length of the comet's tail correlates with the severity of DNA damage (Ostling & Johanson 1984). By using different electrophoresis buffers and lysing conditions, several variants of this methodology have been developed, including assays designed to detect DSBs and single‐strand breaks (SSBs) (Singh & Stephens 1998; Olive 2002). To obtain quantitative estimates of DNA damage, the extent and length of the comet tail can be evaluated by fluorescence image analysis, or by laser scanning cytometry (Bacso & Eliason 2001; Petersen et al. 2000; Chandna 2004). While in principle it is possible to measure fluorescence intensity integrated over the comet to obtain information about total DNA content of the measured cell and thereby identify the cell's position in the cell cycle, this approach has not been used in practice to correlate DNA damage with the cell cycle phase.
Immunocytochemical detection of DNA adducts
Antibodies have been successfully developed to detect a variety of DNA adducts induced by different genotoxic agents. Thus, for example, DNA adducts were visualized in mouse tissues and human blood cells following treatment with ben[a]pyrene or its diolepoxide (Van Schooten et al. 1991). Also, the methylated bases O6‐methylguanine and 7‐methylguanine were immunocytochemically identified in rodent tissues after exposure to the tobacco‐specific nitrosamine‐4(methylnitrosamino)‐1‐(3‐pyridyl)‐1‐butanone (Van Benthem et al. 1994). The list of different DNA adducts which can be detected immunocytochemically is extensive (den Engelse et al. 1990; Meijer et al. 1997; Mistry et al. 2003), but it is not in the scope of this review to cover this topic. Potentially, all these adducts that can be immnunocytochemically identified can be studied by multiparameter cytometry with respect to cell cycle phase specificity and induction of apoptosis. As yet, however, such studies have been isolated (Shinozaki et al. 1998).
Histone H2AX phosphorylation as a marker of DNA double‐strand breaks (DSBs)
DNA damage that involves formation of DSBs induces phosphorylation of Ser139 at the carboxy terminus of histone H2AX (Rogakou et al. 1998; Sedelnikova et al. 2002), one of several variants of the nucleosome core histone H2A (West & Bonner 1980; Thatcher & Gorovsky 1994; Pehrson & Fuji 1998), the gene for which it codes being located on chromosome 11 (11q23.2–23.3; Ivanova et al. 1994). Phosphorylation takes place on H2AX molecules in megabase chromatin domains flanking the DSBs (Fig. 7), and is mediated by the PI‐3‐like protein kinases, ATM‐ (Rogakou et al. 1998; Anderson et al. 2001; Burma et al. 2001; Sedelnikova et al. 2002), ATR‐ (Furuta et al. 2003), and/or DNA‐dependent protein kinase (DNA‐PK) (Park et al. 2003; Wang et al. 2005). The Ser139 phosphorylated H2AX has been named γH2AX (Rogakou et al. 1999). Development of an antibody specific to γH2AX made it possible to detect H2AX phosphorylation and thus to assay immunocytochemically DNA damage and repair in situ, in chromatin of individual cells (Banath & Olive 2003). Compared with the alternative method of DNA damage assessment which is based on analysis of electrophoretic mobility of DNA released from individual cells, the comet assay, the immunocytochemical approach is less cumbersome and offers much greater sensitivity (Huang et al. 2004). Shortly after induction of DSBs, e.g. by ionizing radiation or other genotoxic agents, the presence of γH2AX in chromatin can be detected with this antibody in the form of discrete nuclear foci (Fig. 7) (Rogakou et al. 1999; Sedelnikova et al. 2002; Sedelnikova et al. 2003). Because each focus represents a single DSB (Sedelnikova et al. 2002) their frequency is considered to report the incidence of DSBs. Several checkpoint and DNA repair proteins such as Rad50, Rad51 and Brca1 co‐localize with γH2AX (Paull et al. 2000). It was recently proposed that phosphorylated H2AX may function as an anchor holding broken DNA ends in close proximity in chromatin, facilitating their repair (Bassing & Alt 2004). γH2AX also mediates translocation of the p53 binding protein 1 (53BP1) to the radiation‐induced foci (Anderson et al. 2001).
Figure 7.

The variant histone H2AX, present at low levels in nucleosomes throughout the genome, becomes phosphorylated by kinases such as ATM when DNA double‐strand breaks (DSBs) occur in their vicinity. Variety of other molecules involved in DNA repair are subsequently recruited to the site of the DNA damage.
The loss of H2AX in mice leads to genomic instability; H2AX(–/–) mice are radiation sensitive, growth retarded, and immunodeficient (Celeste et al. 2002). Even H2AX haploinsufficiency compromises genetic integrity, enhancing susceptibility to cancer when p53 remains non‐functional (Celeste et al. 2003a). Thus, H2AX appears to be a guardian of genomic integrity and both its alleles are required for optimal protection against carcinogenesis (Bassing et al. 2003). It should be noted, however, that, while the translocation of repair and signalling proteins to DSBs is not abrogated in H2AX(–/–) cells, these proteins do not assemble in chromatin to form the characteristic irradiation‐induced nuclear foci (Celeste et al. 2003b).
Western blotting and detection of γH2AX immunofluorescene (IF) provide two major approaches to analyse H2AX phosphorylation. Measurement of γH2AX IF by multiparameter flow or laser‐scanning cytometry (Anderson et al. 2001; Banath & Olive 2003; Huang et al. 2003; 2003a, 2003b; Bassing & Alt 2004; Huang et al. 2004; Olive 2004) is particularly advantageous. The major benefit of the cytometric approach stems from the fact that H2AX phosphorylation in situ, in chromatin of individual cells, can be measured with high sensitivity and accuracy and the expression of γH2AX can be directly correlated, within the same cells, with their DNA content, induction of apoptosis or any other cell attribute of interest. Large cell numbers, thus, may be rapidly analysed and the data provide information on the extent of H2AX phosphorylation with respect to their cell cycle phase, commitment to die in response to DNA damage and their surface immunophenotype, amongst others. Cytometry also allows one to analyse intercellular variability in H2AX phosphorylation within cell populations and to identify rare cell subpopulations, otherwise undetectable by western blotting. The review which follows is focused on applications of multiparameter cytometry in analysis of H2AX phosphorylation as a reporter of the presence of DSBs.
Intrinsic (‘programmed’) H2AX phosphorylation
Histone H2AX is phosphorylated on Ser139, not only in response to DNA damage caused by environmental genotoxic factors, but also in healthy, untreated cells. This has been called ‘intrinsic’, ‘programmed’ or ‘scheduled’ H2AX phosphorylation (Banath & Olive 2003; Huang et al. 2004). One instance of such phosphorylation occurs in response to transient formation of DSBs in the course of V(D)J and class‐switch recombination in immune system development (Downs et al. 2000; Jackson 2001; Modesti & Kanaar 2001; Fernandez‐Capetillo et al. 2002). H2AX is also phosphorylated, in the absence of externally induced damage to DNA, during cell cycle progression, particularly during DNA replication (Fig. 6; MacPhail et al. 2003b). As is evident in Fig. 6, the extent of H2AX phosphorylation during the cell cycle varies significantly depending on cell line (2003a, 2003b). In some cell types, such as A549 and NHBE, significant expression of γH2AX is observed, not only in S‐phase cells, but also cells in G2M. The nuclear γH2AX IF foci reflecting the intrinsic H2AX phosphorylation are generally smaller in size and less distinct compared with foci that are formed upon induction of DNA damage by extrinsic factors (Fig. 8; Huang et al. 2004). The multitude of DSBs generated in the course of DNA fragmentation during apoptosis (Huang et al. 2004) also induces extensive H2AX phosphorylation (MacPhail et al. 2003b).
Figure 6.
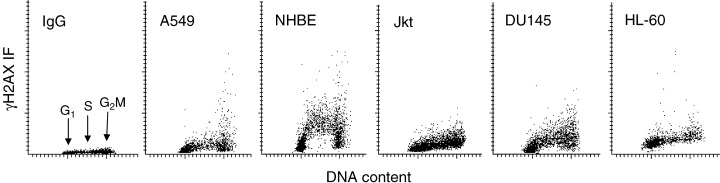
Variable level of ‘programmed’γH2AX expression in different cell types. Bivariate distributions (scatterplots) representing DNA content versus γH2AX IF of human cells from untreated exponentially growing lung carcinoma A549, normal bronchial epithelial (NHBE), T‐cell leukaemic Jurkat (Jkt), prostate carcinoma DU145 and promyelocytic leukaemic HL‐60 cell cultures. IgG shows the negative isotype control (A549 cells). Note differences in extent and in pattern of γH2AX expression vis‐à‐vis the cell cycle phase in different cell types. NHBE cells in S‐phase of the cycle exhibit particularly high expression of γH2AX.
Figure 8.

Induction of γH2AX foci in MCF‐7 cells after exposure to 0.15 µm DNA topoisomerase I inhibitor topotecan (Tpt) for 4 h. The cells were stained with DNA fluorochrome DAPI and immunostained with FITC‐tagged γH2AX Ab. (a) Emission of DAPI, (b) of FITC‐labelled γH2AX and (c) of both (merged image). The nucleus of the cell in the upper left of (b) shows numerous typical γH2AX foci, each thought to represent a single DSB. The pattern of γH2AX‐Ab IF of the cells below and to the right in (b) is typical of the intrinsic (‘programmed’) labelling. The cell with γH2AX Ab foci (upper left) most likely was in S‐phase, as it is the collisions between DNA progressing replication forks and DNA topoisomerase I–DNA complexes stabilized by Tpt that induce DSBs (Hsiang et al. 1989; Del Bino et al. 1991).
To assess H2AX phosphorylation induced by external genotoxic factors, one has therefore to account for the extent of the ‘intrinsic’ expression of γH2AX in the untreated cells. This is often done by subtracting the mean values of γH2AX IF of the G1, S and G2/M subpopulations of untreated cells from the respective means of γH2AX IF of the same type cells that were exposed to the factors damaging their DNA (Huang et al. 2003). The differential (ΔγH2AX IF) provides an estimate of the damage‐induced increase in intensity of γH2AX IF for a particular phase of the cell cycle.
Parallel with the doubling of DNA content, histone content also doubles throughout the cell cycle and therefore the ratio of histone to DNA content remains invariable in the cell (Marzluff & Duronio 2002). As a consequence of higher histone content, the cells in S and G2/M with the same degree of H2AX phosphorylation (the same per cent of phosphorylated H2AX molecules per total H2AX molecules) therefore have 1.5‐ and 2.0‐fold higher integrated value of γH2AX IF compared to G1 cells. To assess the degree of H2AX phosphorylation, and thus to make γH2AX IF independent of histone doubling during the cycle, the data may be normalized by presenting it as γH2AX IF per unit of DNA (histone). This is accomplished by dividing the mean S‐phase and G2/M‐phase γH2AX IF by 1.5 and 2.0, respectively (Huang et al. 2003). After such normalization, the difference in H2AX IF during the cell cycle reveals the degree of γH2AX phosphorylation, i.e. the ratio of phosphorylated H2AX per total number of H2AX molecules within each cell. Similarly, by comparing H2AX phosphorylation in cells of different DNA ploidy, data should be standardized to express γH2AX IF per unit of DNA rather than per cell.
Phosphorylation of γH2AX and of ATM kinase induced by genotoxic agents
As mentioned, induction of DSBs by genotoxic agents activates protein kinases that phosphorylate H2AX on Ser139. Figure 9 illustrates the cell cycle phase‐related differences in response of individual cells to UV‐B light irradiation. As it is evident, the exposure of HL‐60 cells to UV light, regardless of the dose of radiation (57 J/m2−3.45 kJ/m2), led to induction of γH2AX predominantly in S‐phase cells. At the lowest dose of exposure, the induction was distinctly more pronounced in early, compared with mid‐ or late‐S‐phase cell (Halicka et al. 2005). A large proportion of G1 and G2/M cells (below the marked threshold) showed no increase in expression of γH2AX, even at the highest doses of exposure to UV light. This pattern of cell response to UV is consistent with earlier reports describing formation of DSBs (H2AX phosphorylation detected by western blotting) in DNA replicating cells after exposure to UV radiation (Kaina 1998; McGregor 1999; Dunkern & Kaina 2002; Squires et al. 2004). The mechanism of DSB induction by UV involves a collision (stalling) of the replication forks at the sites of the UV‐induced base adducts (Dunkern & Kaina 2002; Kaina 1998; McGregor 1999). This mechanism very much resembles that caused by DNA topoisomerase inhibitors, in which the collisions occurring at sites of stabilization of the DNA topoisomerase attached to DNA by the inhibitor (‘cleavable complexes’), trigger nuclease activation (Hsiang et al. 1989), and in turn, apoptosis (Del Bino et al. 1991). Suppression of DNA replication by the DNA polymerase inhibitor aphidicolin has prevented the UV‐induced H2AX phosphorylation in these cells (Halicka et al. 2005). However, aphidocolin itself induced a moderate degree of H2AX phosphorylation in early S‐phase cells.
Figure 9.

Induction of γH2AX in HL‐60 cells exposed to different doses of UV light. Exponentially growing HL‐60 cells, untreated (Ctrl) or exposed to different doses of UV‐B light as indicated in the captions, were transferred back to the culture for 1 h, and then fixed. The expression of γH2AX IF was measured concurrently with cellular DNA content by flow cytometry (Halicka et al. 2005), and the data are shown as bivariate γH2AX IF versus DNA content distributions. Over 97% cells from the non‐irradiated (Ctrl) culture had γH2AX IF below the threshold marked by the dashed line. The inset in the left panel shows the cellular DNA content frequency histogram of the untreated cells; the cells from the UV irradiated cultures displayed essentially identical histograms.
It should be noted that the induction of γH2AX assayed by cytometry provides a sensitive and convenient means to measure the extent of DNA damage following exposure to X‐irradiation (2003a, 2003b). The pioneering studies by Olive and her collaborators (Banath & Olive 2003; 2003a, 2003b) provided evidence that DSBs induced by X‐radiation could be detected and conveniently measured using multiparameter flow and image cytometry. These authors proposed that this assay could be used as a surrogate for cell killing in viability tests for agents that generate DSBs (Banath & Olive 2003). Similar to our findings on response of cells to UV‐B irradiation (Fig. 9; Halicka et al. 2005), X‐irradiation also induced H2AX phosphorylation preferentially in S‐phase cells (MacPhail et al. 2003a).
DSBs induced in cells that reproduce are potentially carcinogenic/mutagenic lesions. Thus, cytometric assays of H2AX phosphorylation can be used to assess the extent of genotoxic effects following cell contact with carcinogens. Figure 10 shows response of A549 human pulmonary adenocarcinoma cells to tobacco smoke. Whereas 10 min of exposure to whole smoke had little effect on the cells, longer exposure times led to increased DNA DSBs as detected by increased levels of γH2AX that showed little cell cycle phase specificity (Albino et al. 2004).
Figure 10.
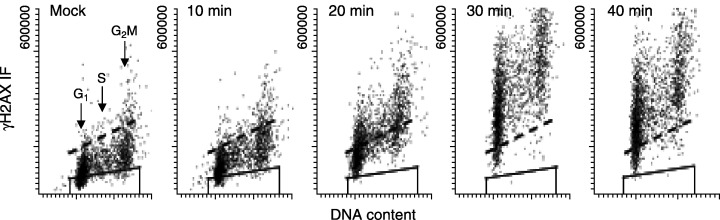
Induction of H2AX phosphorylation in A549 cells exposed to tobacco smoke for different time intervals. A549 human pulmonary adenocarcinoma cells were exposed to smoke from a standard cigarette (35 mL puff/250 mL air) for 0 (mock) to 40 min at 10 min intervals. The cells were then washed in phosphate‐buffered saline (PBS) and re‐suspended in fresh medium for an additional 1 h, at which time the cells on slides were fixed in 70% ethanol. DNA DSBs were detected by binding of FITC‐labelled Ab to γH2AX while cellular DNA was labelled with DAPI. Cellular fluorescence was measured with laser scanning cytometry. The trapezoid in each panel represents the background (IgG) fluorescence, while the dashed line indicates the extent of ‘intrinsinc’γH2AX IF associated with this cell line. Little change in γH2AX could be observed at 10 min, although at longer exposure times virtually all cells demonstrated evidence of DNA DSBs (for details see Albino et al. 2004).
Inhibitors of DNA topoisomerase I and II (topo1 and topo2) are among the most clinically effective anti‐tumour drugs. Most of them bind to DNA by intercalation between adjacent base pairs that leads to formation of a covalent link between topo1 or topo2 and DNA (Hsiang et al. 1989), thereby stabilizing otherwise cleavable complexes between DNA and topoisomerases. In DNA replicating cells, this causes the collision between the progressing DNA replication fork and such a stabilized complex and, in turn, to conversion of the complex into secondary lesions that consist of DSBs (Hsiang et al. 1989). Collisions with the cleavable complexes also occur during transcription, between the progressing RNA polymerase molecule and the inhibitor‐stabilized topo1 or topo2 cleavable complex located on the template strand within the DNA region being transcribed (D’Arpa et al. 1990). The RNA polymerase collisions, similar to the collisions of the DNA replication fork, are also converted into DSBs (Wu & Liu 1997). In both instances, the secondary DSBs are presumed to be recognized by the cell as lethal and trigger apoptosis (Hsiang et al. 1989; D’Arpa et al. 1990; Wu & Liu 1997). Predominantly S‐phase cells undergo apoptosis upon exposure to topo1 or topo2 inhibitors (1990, 1991; Gorczyca et al. 1993c). Phosphorylation of H2AX in the cells treated with topo inhibitors reveals the presence of DSBs induced by these drugs, and therefore is expected to be predictive of their cytotoxicity. Bivariate analysis of γH2AX expression vis‐à‐vis cellular DNA content can pinpoint the cell cycle phase that is the most sensitive in terms of induction of these lesions. Figure 11 illustrates the effect topo1 inhibitor topotecan (Tpt) on H2AX phosphorylation in HL‐60 cells. It is apparent that, compared with cells in G1 phase, the cells in S and G2M were much more sensitive in their response to Tpt by the induction of H2AX phosphorylation. It is also apparent that, in the presence of the protein (serine/threonine) phosphatase inhibitor calyculin A, the intensity of γH2AX IF was markedly elevated after 3 h, but was essentially unchanged after 1 h. There is an equilibrium between the rate of phosphorylation of histone H2AX after DNA damage, and its dephosphorylation that occurs as DNA repair progresses (Furuya et al. 1997). The data in Fig. 11 suggest that, while no significant dephosphorylation of H2AX took place during the first hour of treatment with Tpt, a significant degree of dephosphorylation occurred between 1 and 3 h in the absence of calyculin A. To assess the cumulative H2AX phosphorylation as a yardstick of the total number of DSBs generated by the treatment, one has to incubate the cells in the presence of the protein phosphatase inhibitor, to prevent γH2AX dephosphorylation. One has to be cautious in data interpretation, however, because inhibitors such as calyculin A or okadaic acid are cytotoxic and prolonged (> 3 h) incubation with them causes premature chromatin condensation followed by apoptosis (manuscript in preparation).
Figure 11.

Induction of H2AX phosphorylation in HL‐60 cells cultured in the presence of topotecan (Tpt); effect of calyculin A. The bivariate distributions of γH2AX expression in relation to cell cycle phase of untreated HL‐60 cells (Ctrl) and the cells cultured with 0.15 µm of Tpt in the absence and presence of 10 nm of the phosphatase inhibitor, calyculin A (Cal) for 1 or 3 h. Over 95% of the cells from the non‐treated (Ctrl) culture expressed γH2AX below the threshold level marked with the dashed line. Notice that Tpt induced H2AX phosphorylation predominantly in S and G2M cells. While no significant effect of calyculin A on γH2AX expression was apparent after 1 h of treatment with Tpt, a marked increase in the expression of γH2AX was seen after 3 h (Huang et al. 2004).
The capability to correlate the detection of γH2AX as well as the detection of apoptosis, each with respect to cell cycle phase as offered by multiparameter cytometry, makes it possible to reveal the potential correlation between induction of DSBs and apoptosis. Figure 12 shows such a correlation for HL‐60 cells treated with the topo2 inhibitor mitoxantrone (Mtx). It is quite evident that, unlike in the case of the topo1 inhibitor Tpt (Fig. 11), cells in all phases of the cycle responded to the drug by H2AX phosphorylation. However, essentially only S‐phase cells underwent subsequent apoptosis (Fig. 12). These data indicate that, in the case of treatment with Mtx, regardless of the extent of H2AX phosphorylation and thus most likely frequency of DSBs, DNA replicating cells are much more prone to undergo apoptosis than G1 or G2/M cells. Thus, it appears that, with comparable levels of DNA damage, the cells arrested at the G1 or G2/M checkpoint remain at the checkpoint alive for an extended period of time, apparently in an attempt to repair the damage, while the S‐phase cells succumb to apoptosis. However, both H2AX phosphorylation (Fig. 11) as well as apoptosis are selectively induced in S‐phase cells after treatment with the DNA topo1 inhibitor Tpt (Huang et al. 2004).
Figure 12.
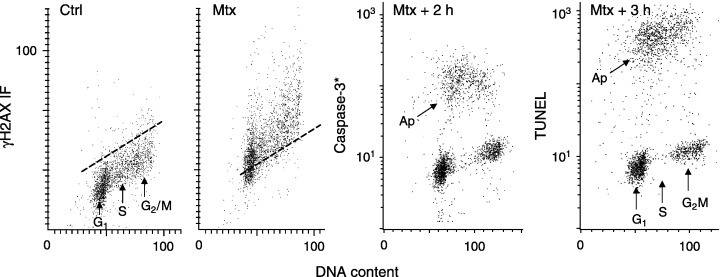
H2AX phosphorylation and induction of apoptosis in HL‐60 cells treated with topo2 inhibitor mitoxantrone (Mtx) in relation to the cell cycle phase. The two left panels show bivariate distributions of γH2AX IF versus DNA content of the untreated (Ctrl) HL‐60 cells and cells treated with 0.15 µg/mL Mtx for 2 h. The MTX‐treated cells were further incubated and activation of caspase‐3 (caspase‐3*) and the presence of apoptosis‐associated DNA strand breaks (TUNEL) were assessed after an additional 2 and 3 h, respectively, combined with DNA content measurements (two right panels) Note an increase in γH2AX IF occurring in all phases of the cell cycle, after the Mtx treatment. However, S‐phase cells preferentially undergo apoptosis (Ap) as is evident from the pattern of caspase‐3 activation and the presence of DNA strand breaks detected by TUNEL, vis‐à‐vis cell cycle phase.
As presented earlier in this review, apoptosis is associated with extensive DNA fragmentation and the apoptosis‐associated DSBs also trigger H2AX phosphorylation (Huang et al. 2004). However, the degree of H2AX phosphorylation in response to formation of DSBs during apoptosis is many‐fold higher compared with that in response to the primary DSBs, such as induced by radiation (Halicka et al. 2005) or DNA damaging drugs such as Tpt. This is evident from the bivariate distributions that illustrate expression of γH2AX versus caspase‐3 activation (Fig. 13). The latter event, that is caspase‐3 activation, is a reporter of apoptosis. Its immunocytochemical detection with an antibody that reacts with the epitope of the activated (cleaved) enzyme concurrent with detection of γH2AX makes it possible to identify both the non‐apoptotic versus apoptotic cells that have phosphorylated H2AX. The bivariate distributions representing γH2AX IF versus activated caspase (caspase‐3*) allows one to discriminate four cell populations as shown in the respective quadrants of the third panel in Fig. 13: (a) γH2AX positive–caspase‐3* negative; (b) γH2AX positive–caspase‐3* positive; (c) IF γH2AX negative–caspase‐3* positive; and (d) γH2AX negative–caspase‐3* negative. It is evident that the apoptotic cells (Ap), that is the cells with activated caspase‐3 (quadrant b), have distinctly higher expression of γH2AX compared with cells that phosphorylated H2AX in response to the primary DSB induced by Tpt (pDSB; quadrant a). It should be noted, however, that, at later stages of apoptosis, expression of γH2AX declines and may be not much higher than that induced by the primary DSBs.
Figure 13.
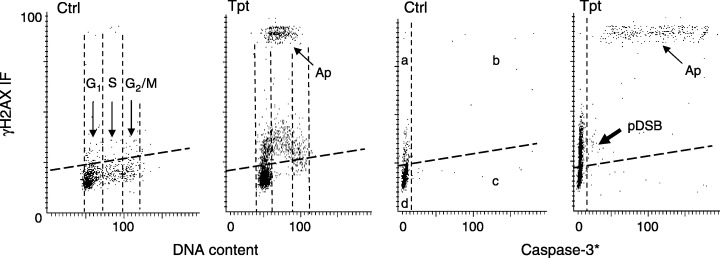
Different degree of H2AX phosphorylation induced by the primary DSB caused by Tpt and secondary, apoptosis‐associated DNA fragmentation. The bivariate distributions of cellular DNA content versus induction of γH2AX (two left panels) and caspase‐3 activation versus γH2AX IF (two right panels), of untreated (Ctrl) HL‐60 cells and the cells treated with Tpt for 3 h (Tpt). Each of these parameters was measured using fluorochromes of different colour by laser scanning cytometry (Huang et al. 2004) The thresholds (thick dashed lines) represent 95% confidence levels of the γH2AX IF of the untreated (Ctrl) cells.
As mentioned earlier, H2AX phosphorylation in response to DSBs is being carried out by PI‐3‐like protein kinases, ATM‐ (Rogakou et al. 1998; Anderson et al. 2001; Burma et al. 2001; Sedelnikova et al. 2002), ATR‐ (Furuta et al. 2003), and/or DNA‐dependent protein kinase (DNA‐PK) (Park et al. 2003; Wang et al. 2005). It recently has become possible to immunocytochemically detect activation of ATM kinase (the gene for which is located on chromosome 11q22.3), which in response to induction of DSBs undergoes autophosphorylation at Ser1981 (Bartkova et al. 2005). Similar to the pattern of the presence of DSBs, ATM is not phosphorylated in most normal tissues but undergoes phosphorylation in subsets of bone marrow lymphocytes and primary spermatocytes, that is the cells where DSBs are generated during physiological V(D)J recombination and meiotic recombination, respectively. As shown in Fig. 14, induction of DSBs by Tpt triggers both ATM autophosphorylation as well as phosphorylation of H2AX. In both instances, the phosphorylations are induced preferentially in S‐phase cells. These data, thus, suggest that ATM is the kinase that phosphorylates H2AX after induction of DSBs by the DNA topo1 inhibitor Tpt. Studies are in progress to concurrently detect activated ATM and γH2AX in the same cells in order to compare kinetics of their phosphorylation, with respect to each other.
Figure 14.

Induction of H2AX phosphorylation and autophosphorylation of ATM kinase in response to formation of DSBs in HL‐60 cells treated with Tpt. The bivariate distributions of γH2AX IF versus DNA content and of activated (Ser1981 phosphorylated) ATM kinase (ATM*IF) of untreated (Ctrl) or Tpt‐treated (0.15 µm, 1 h) HL‐60 cells. Over 97% cells from the control culture expressed γH2AX or ATM*IF below the threshold level marked with the dashed lines, respectively. Note that S‐phase cells preferentially activated ATM and phosphorylated H2AX in response to Tpt.
FUTURE DIRECTIONS
Future progress in the analysis of DNA damage by cytometry will be associated with development of antibodies that recognize chemically modified (phosphorylated, acetylated, methylated, ADP‐ribosylated or ubiquinitylated) epitopes of proteins. Such antibodies will provide the means to detect functional changes (activation, inactivation, mutual interactions) of the proteins that respond to DNA damage and carry out repair. One example is ATM kinase, whose activation through auto‐phosphorylation detected immunocytochemically (as illustrated in Fig. 14) reveals its involvement in response to drug‐induced DNA damage. It also serves as a reporter of the damage itself. Thus, using function‐associated protein modification‐specific antibodies, the participation of individual proteins in the DNA repair process can be studied in individual cells in relation to cell cycle phase and also vis‐à‐vis induction of apoptosis.
Another functional marker of a particular protein is its translocation and interaction with other proteins. Intracellular translocations (for example, cytoplasm to the nucleus, local changes in distribution) can be detected using morphometric capabilities such as offered by laser scanning cytometry (Kamentsky 2001) or similar instruments. Using this approach, we have already been able to reveal activation of nuclear factor κB (Deptala et al. 1998) by tumour necrosis factor α, or translocation of Bax protein to mitochondria to facilitate release of cytochrome c from mitochondria during induction of apoptosis (Bedner et al. 2000).
Fluorescence resonance energy transfer (FRET) is a further probe that reveals protein translocations and protein–protein interactions (Vereb et al. 2004), and will progressively be used in cytometric DNA damage assays, particularly to study participation of individual proteins in DNA repair. The probe that senses microenvironment of the fluorochrome, fluorescence lifetime microscopy (FLIM; Murata et al. 2001), when adapted more widely to cytometry (Sailer et al. 1997), is also expected to significantly contribute to a better understanding of the mechanism of DNA damage and repair.
Radio‐ and chemotherapy targeting DNA of tumour cells and the extent of DNA damage induced during the treatment certainly correlates with clinical response. One expects that sensitive cytometric assays that reveal the extent of the damage, particularly with respect to cell cycle phase, such as based on detection of H2AX phosphorylation or activation of the protein kinases that phosphorylate H2AX, will soon find application in the clinic to assess DNA damage early during therapy, as a possible prognostic marker.
ACKNOWLEDGEMENT
Supported by NCI CA 28 704.
REFERENCES
- Albino AP, Huang X, Yang J, Gietl D, Jorgensen E, Traganos F, Darzynkiewicz Z (2004) Induction of histone H2AX phosphorylation in A549 human pulmonary epithelial cells by tobacco smoke and in human bronchial epithelial cells by smoke condensate: a new assay to detect the presence of potential carcinogens in tobacco. Cell Cycle 3, 1062. [PubMed] [Google Scholar]
- Anderson L, Henderson C, Adachi Y (2001) Phosphorylation and rapid relocalization of 53BP1 to nuclear foci upon DNA damage. Mol. Cell Biol. 21, 1719. [DOI] [PMC free article] [PubMed] [Google Scholar]
- Arends MJ, Morris RG, Wyllie AH (1990) Apoptosis: the role of endonuclease. Am. J. Pathol. 136, 593. [PMC free article] [PubMed] [Google Scholar]
- Bacso Z, Eliason JF (2001) Measurement of DNA damage associated with apoptosis by laser scanning cytometry. Cytometry 45, 180. [DOI] [PubMed] [Google Scholar]
- Banath JP, Olive PL (2003) Expression of phosphorylated histone H2AX as a surrogate of cell killing by drugs that create DNA double‐strand breaks. Cancer Res. 63, 4347. [PubMed] [Google Scholar]
- Barry MA, Eastman A (1993) Identification of deoxyribonuclease II as an endonuclease involved in apoptosis. Arch Biochem Biophys. 300, 440. [DOI] [PubMed] [Google Scholar]
- Bartkova J, Bakkenist CJ, Meyts ER, Skakkebaek NE, Sehested M, Lukas J, Kastan MB, Bartek J (2005) ATM activation in normal human tissue and testicular cancer. Cell Cycle 4, e2. [DOI] [PubMed] [Google Scholar]
- Bassing CH, Alt FW (2004) H2AX may function as an anchor to hold broken chromosomal DNA ends in close proximity. Cell Cycle 3, 149. [DOI] [PubMed] [Google Scholar]
- Bassing CH, Suh H, Ferguson DO, Chua KF, Manis J, Eckersdorff M, Gleason M, Bronson R., Lee C, Alt FW (2003) Histone H2AX: a dosage‐dependent suppressor of oncogenic tranlocations in tumors. Cell 114, 359. [DOI] [PubMed] [Google Scholar]
- Bedner E, Li X, Kunicki J, Darzynkiewicz Z (2000) Translocation of Bax to mitochondria during apoptosis measured by laser scanning cytometry. Cytometry 41, 83. [PubMed] [Google Scholar]
- Boulares AH, Zoltoski AJ, Contreras FJ, Yakovlev AG, Yoshihara K, Smulson ME (2002) Regulation of DNAS1L3 endonuclease activity by poly(ADP‐ribosyl)ation during etoposide‐induced apoptosis. Role of poly(ADP‐ribose) polymerase‐1 cleavage in endonuclease activation. J Biol Chem. 277, 372. [DOI] [PubMed] [Google Scholar]
- Boulares AH, Ren T (2004) Mechanism of acetaminophen‐induced apoptosis in cultured cells: roles of caspase‐3, DNA fragmentation factor, and the Ca2+ and Mg2+ endonuclease DNAS1L3. Basic Clin Pharmacol Toxicol. 94, 19. [PubMed] [Google Scholar]
- Bruno S, Lassota P, Giaretti W, Darzynkiewicz Z (1992) Apoptosis of rat thymocytes triggered by prednisolone, camptothecin, or teniposide is selective to G0 cells and is prevented by inhibitors of proteases. Onc. Res. 4, 29. [PubMed] [Google Scholar]
- Burma S, Chen BP, Murphy M, Kurimasa A, Chen DJ (2001) ATM phosphorylates histone H2AX in response to DNA double‐strand breaks. J. Biol. Chem. 276, 742462. [DOI] [PubMed] [Google Scholar]
- Celeste A, Paterson S, Romanienko PJ, Fernandez‐Capetillo O, Chen HT, Sedelnikov OA, Reina‐San‐Martin B, Coppola V, Meffre E, Difilippantonio MJ, Redon C, Pilch DR, Olaru A, Eckhaus M, Camerini‐Otero RD, Tessarollo L, Livak F, Manova K, Bonner WM, Nussenzweig MC, Nussenzeig A (2002) Genomic instability in mice lacking histone H2AX. Science 296, 922. [DOI] [PMC free article] [PubMed] [Google Scholar]
- Celeste A, Difilippantonio S, Fernandez‐Capetillo O, Pilch DR, Sedelnikova O, Eckhaus M, Ried T, Bonner WM, Nussenzweig A (2003a) H2AX haploinsufficiency modifies genomic stability and tumor successibility. Cell 114, 371. [DOI] [PMC free article] [PubMed] [Google Scholar]
- Celeste A, Fernandez‐Capetillo O, Kruhlak MJ, Pilch DR, Staudt DW, Lee A, Bonner RF, Bonner WM, Nussenzweig A (2003b) Histone H2AX phosphorylation is dispensable for the initial recognition of DNA breaks. Nat. Cell Biol. 5, 675. [DOI] [PubMed] [Google Scholar]
- Chandna S (2004) Single‐cell gel electrophoresis assay monitors precise kinetics of DNA fragmentation induced during programmed cell death. Cytometry 61A, 127. [DOI] [PubMed] [Google Scholar]
- D’Arpa P, Beardmore C, Liu LF (1990) Involvement of nucleic acid synthesis in cell killing mechanisms of topoisomerase poisons. Cancer Res. 50, 6916. [PubMed] [Google Scholar]
- Darzynkiewicz Z (1990) Probing nuclear chromatin by Flow Cytometry In: Melamed MR, Mendelsohn M, Lindmo T, eds. Flow Cytometry and Sorting, p. 315 New York: Alan R. Liss Inc. [Google Scholar]
- Darzynkiewicz Z, Traganos F, Sharpless T, Melamed MR (1976) Lymphocyte stimulation: a rapid multiparameter analysis. Proc. Natl Acad. Sci. USA 73, 2881. [DOI] [PMC free article] [PubMed] [Google Scholar]
- Darzynkiewicz Z, Traganos F, Sharpless T, Melamed MR (1977) Different sensitivity of DNA in situ in interphase and metaphase chromatin to heat denaturation. J. Cell Biol. 73, 128. [DOI] [PMC free article] [PubMed] [Google Scholar]
- Darzynkiewicz Z, Traganos F, Melamed MR (1980) New cell cycle compartments identified by multiparameter flow cytometry. Cytometry 1, 98. [DOI] [PubMed] [Google Scholar]
- Darzynkiewicz Z, Bruno S, Del Bino G, Gorczyca W, Hotz MA, Lassota P, Traganos F (1992) Features of apoptotic cells measured by flow cytometry. Cytometry 13, 795. [DOI] [PubMed] [Google Scholar]
- Darzynkiewicz Z, Juan G, Li X, Murakami T, Traganos F (1997) Cytometry in cell necrobiology: analysis of apoptosis and accidental cell death (necrosis). Cytometry 27, 1. [PubMed] [Google Scholar]
- Del Bino G, Skierski JS, Darzynkiewicz Z (1990) Diverse effects of camptothecin, an inhibitor of topoisomerase I, on the cell cycle of lymphocytic (L1210, MOLT‐4) and myelogenous (HL‐60, KG1) leukemic cells. Cancer Res. 50, 5746. [PubMed] [Google Scholar]
- Del Bino G, Lassota P, Darzynkiewicz Z (1991) The S‐phase cytotoxicity of camptothecin. Exp. Cell Res. 193, 27. [DOI] [PubMed] [Google Scholar]
- Deptala A, Bedner E, Gorczyca W, Darzynkiewicz Z (1998) Simple assay of activation of nuclear factor kappa B (NF‐κB) by laser scanning cytometry (LSC). Cytometry 33, 376. [DOI] [PMC free article] [PubMed] [Google Scholar]
- Dobrucki J, Darzynkiewicz Z (2001) Chromatin condensation and sensitivity of DNA in situ to denaturation during cell cycle and apoptosis. A confocal microscopy study. Micron 32, 645. [DOI] [PubMed] [Google Scholar]
- Dolbeare F, Gratzner H, Pallavicini MG, Gray JW (1983) Flow cytometric measurement of total DNA content and incorporated bromodeoxyuridine. PNAS. 80, 5573. [DOI] [PMC free article] [PubMed] [Google Scholar]
- Downs JA, Lowndes NF, Jackson SP (2000) A role for Saccharomyces cerevisiae histone H2A in DNA repair. Nature 408, 1001. [DOI] [PubMed] [Google Scholar]
- Dunkern TR, Kaina B (2002) Cell proliferation and DNA breaks are involved in ultraviolet light‐induced apoptosis in nucleotide excision repair‐deficient hamster cells. Mol. Biol. Cell 13, 348. [DOI] [PMC free article] [PubMed] [Google Scholar]
- Enari M, Sakahira H, Yokoyama H, Okawa K, Iwamatsu A, Nagata S (1998) A caspase‐activated DNase that degrades DNA during apoptosis, and its inhibitor ICAD. Nature. 391, 43. [DOI] [PubMed] [Google Scholar]
- Den Engelse L, Van Benthem J, Scherer E (1990) Immunocytochemical analysis of in vivo DNA modification. Mutat. Res. 233, 265. [DOI] [PubMed] [Google Scholar]
- Evenson DP, Jost LK, Marshall D, Zinaman MJ, Clegg E, Purvis K, De Angelis P, Claussen OP (1999) Utility of the sperm chromatin structure assay as a diagnostic and prognostic tool in the human fertility clinic. Hum Reprod. 14, 1039. [DOI] [PubMed] [Google Scholar]
- Fernandez‐Capetillo O, Chen H‐T, Celecte A, Ward I, Romanienko P, Morales JC, Naka K, Xia Z, Camerini‐Otero RD, Motoyama N, Carpenter PB, Bonner WM, Chen J, Nussenzweig A (2002) DNA damage‐induced G2‐M checkpoint activation by histone H2AX and 53BP1. Nat. Cell Biol. 4, 993. [DOI] [PubMed] [Google Scholar]
- Frankfurt OS (1999) Immunoassay for single‐stranded DNA in apoptotic cells. Meth. Mol. Biol. 113, 621. [DOI] [PubMed] [Google Scholar]
- Furuta T, Takemura H, Liao Z‐Y, Aune GJ, Redon C, Sedelnikova OA, Pilch DR, Rogakou EP, Celeste A, Chen HT, Nussenzweig A, Aladjem MI, Bonner WM, Pommier Y (2003) Phosphorylation of histone H2AX and activation of Mre11, Rad50, and Nbs1 in response to replication‐dependent DNA double‐strand breaks induces by mammalian topoisomerase I cleavage complexes. J. Biol. Chem. 278, 20303. [DOI] [PubMed] [Google Scholar]
- Furuya T, Kamada T, Murakami T, Kurose A, Sasaki K (1997) Laser scanning cytometry allows detection of cell death with morphological features of apoptosis in cells stained with PI. Cytometry 29, 173. [PubMed] [Google Scholar]
- Gaido ML, Cidlowski JA (1991) Identification, purification, and characterization of a calcium‐dependent endonuclease (NUC18) from apoptotic rat thymocytes. NUC18 is not hisone H2B. J Biol Chem. 266, 18580. [PubMed] [Google Scholar]
- Gavrieli Y, Sherman Y, Ben‐Sasson A (1992) Identification of programmed cell death in situ via specific labeling of nuclear DNA fragmentation. J. Cell Biol. 119, 493. [DOI] [PMC free article] [PubMed] [Google Scholar]
- Gold R, Schmied M, Giegerich G, Breitschopf H, Hartung HP, Toyka KV, Lassmann H (1994) Differentiation between cellular apoptosis and necrosis by the combined use of in situ tailing and nick translation techniques. Lab Invest. 71, 219. [PubMed] [Google Scholar]
- Gong J, Traganos F, Darzynkiewicz Z (1994) A selective procedure for DNA extraction from apoptotic cells applicable for gel electrophoresis and flow cytometry. Anal. Biochem. 218, 314. [DOI] [PubMed] [Google Scholar]
- Gorczyca W, Bruno S, Darzynkiewicz R, Gong J, Darzynkiewicz Z (1992) DNA strand breaks occurring during apoptosis. their early in situ detection by the terminal deoxynucleotydil transferase and nick translation assays and prevention by serine protease inhibitors. Int. J. Oncol. 1, 639. [DOI] [PubMed] [Google Scholar]
- Gorczyca W, Bigman K, Mittelman A, Ahmed T, Gong J, Melamed MR, Darzynkiewicz Z (1993a) Induction of DNA strand breaks associated with apoptosis during treatment of leukemias. Leukemia 7, 659. [PubMed] [Google Scholar]
- Gorczyca W, Traganos F, Jesionowska H, Darzynkiewicz Z (1993b) Presence of DNA strand breaks and increased sensitivity of DNA in situ to denaturation in abnormal human sperm. Analogy to apoptosis of somatic cells. Exp. Cell Res. 207, 202. [DOI] [PubMed] [Google Scholar]
- Gorczyca W, Gong J, Ardelt B, Traganos F, Darzynkiewicz Z (1993c) The cell cycle related differences in susceptibility of HL‐60 cells to apoptosis induced by various anti‐tumor agents. Cancer Res. 53, 3186. [PubMed] [Google Scholar]
- Halicka HD, Seiter K, Feldman EJ, Traganos F, Mittelman A, Ahmed T, Darzynkiewicz Z (1997) Cell cycle specificity of apoptosis during treatment of leukemias. Apoptosis 2, 25. [DOI] [PubMed] [Google Scholar]
- Halicka DH, Pozarowski P, Ita M, Ardelt W, Mikulski SM, Shogen K, Darzynkiewicz Z (2002) Enhancement of activation‐induced apoptosis of lymphocytes by the cytotoxic ribonuclease onconase (Ranpirnase). Int. J. Oncol. 21, 1245. [DOI] [PubMed] [Google Scholar]
- Halicka HD, Huang X, Traganos F, King MA, Dai W, Darzynkiewicz Z (2005) Histone H2AX phosphorylation after cell irradiation with UV‐B: relationship to cell cycle phase and induction of apoptosis. Cell Cycle 4, 339. [PubMed] [Google Scholar]
- Hotz MA, Gong J, Traganos F, Darzynkiewicz Z (1994) Flow cytometric detection of apoptosis. Comparison of the assays of in situ DNA degradation and chromatin changes. Cytometry 15, 237. [DOI] [PubMed] [Google Scholar]
- Hsiang YH, Lihou MG, Liu LF (1989) Arrest of replication forks by drug stabilized topoisomeraseI–DNA cleavable complexes as a mechanism of cell killing by camptothecin. Cancer Res. 49, 5077. [PubMed] [Google Scholar]
- Huang X, Okafuji M, Traganos F, Luther E, Holden E, Darzynkiewicz Z (2004) Assessment of histone H2AX phosphorylation induced by DNA topoisomerase I and II inhibitors Topotecan and Mitoxantrone and by the DNA cross‐linking agent Cisplatin. Cytometry 58A, 99. [DOI] [PubMed] [Google Scholar]
- Huang X, Traganos F, Darzynkiewicz Z (2003) DNA damage induced by DNA topoisomerase I and topoisomerase II inhibitors detected by histone H2AX phosphorylation in relation to the cell cycle phase and apoptosis. Cell Cycle 2, 614. [PubMed] [Google Scholar]
- Inohara N, Koseki T, Chen S, Wu X, Nunez G (1998) CIDE, a novel family of cell death activators with homology to the subunit of the DNA fragmentation factor. EMBO J. 17, 2526. [DOI] [PMC free article] [PubMed] [Google Scholar]
- Ivanova VS, Zimonjic D, Popescu N, Bonner WM (1994) Chromosomal localization of the human histone H2AX gene to 11q23.2–q23.3 by fluorescence in situ hybridization. Hum. Genet. 94, 303. [DOI] [PubMed] [Google Scholar]
- Jackson SP (2001) DNA damage signaling and apoptosis. Biochem. Soc. Trans. 29, 655. [DOI] [PubMed] [Google Scholar]
- Kaina B (1998) Critical steps in alkylation of n‐induced aberration formation. Mutat. Res. 404, 119. [DOI] [PubMed] [Google Scholar]
- Kamentsky LA (2001) Laser scanning cytometer. Meth. Cell Biol. 63, 51. [DOI] [PubMed] [Google Scholar]
- Kerr JFR, Wyllie AH, Curie AR (1972) Apoptosis: a basic biological phenomenon with wide‐ranging implications in tissue kinetics. Br. J. Cancer 26, 239. [DOI] [PMC free article] [PubMed] [Google Scholar]
- Kunitz M (1950) Crystalline desoxyribonuclease; isolation and general properties; spectrophotometric method for the measurement of desoxyribonuclease activity. J Gen Physiol. 33, 349. [DOI] [PMC free article] [PubMed] [Google Scholar]
- Li X, Darzynkiewicz Z (1995) Labelling DNA strand breaks with BdrUTP. Detection of apoptosis and cell proliferation. Cell Prolif. 28, 571. [DOI] [PubMed] [Google Scholar]
- Li X, Traganos F, Melamed MR, Darzynkiewicz Z (1995) Single‐step procedure for labeling DNA strand breaks with fluorescein‐ or BODIPY‐conjugated deoxynucleotides: detection of apoptosis and bromodeoxyuridine incorporation. Cytometry 20, 172. [DOI] [PubMed] [Google Scholar]
- Li X, Melamed MR, Darzynkiewicz Z (1996) Detection of apoptosis and DNA replication by differential labeling of DNA strand breaks with fluorochromes of different color. Exp. Cell Res. 222, 28. [DOI] [PubMed] [Google Scholar]
- Los M, Neubuser D, Coy JF, Mozoluk M, Poustka A, Schulze‐Osthoff K (2000) Functional characterization of DNase X, a novel endonuclease in muscle cells. Biochemistry 39, 7365. [DOI] [PubMed] [Google Scholar]
- MacPhail SH, Banath JP, Yu TY, Chu EH, Lambur H, Olive PL (2003a) Expression of phosphorylated histone H2AX in cultured cell lines following exposure to X‐rays. Int. J. Radiat. Biol. 79, 351. [DOI] [PubMed] [Google Scholar]
- MacPhail SH, Banath JP, Yu TY, Chu E, Olive PL (2003b) Cell cycle‐dependent expression of phosphorylated histone H2AX: reduced expression in unirradiated but not X‐irradiated G1‐phase cells. Radiat. Res. 159, 759. [DOI] [PubMed] [Google Scholar]
- Marzluff WF, Duronio RJ (2002) Histone mRNA expression: multiple levels of cell cycle regulation and important developmental consequences. Curr. Opin. Cell Biol. 14, 692. [DOI] [PubMed] [Google Scholar]
- McGregor WG (1999) DNA repair, DNA replication, and UV mutagenesis. J. Invest. Dermatol. Symp Proc. 4, 1. [DOI] [PubMed] [Google Scholar]
- Meijer C, De Vries EG, Dam WA, Wilkinson MH, Hollema H, Hoekstra HJ, Mulder NH (1997) Immunocytochemical analysis of cisplatin‐induced platinum DNA adducts with double‐fluorescence video microscopy. Br. J. Cancer 76, 290. [DOI] [PMC free article] [PubMed] [Google Scholar]
- Mistry N, Podmore I, Cooke M, Butler P, Griffiths H, Herbert K, Lunec J (2003) Novel monoclonal antibody recognition of oxidative DNA damage adduct, deoxycitidine–glyoxal. Lab. Invest. 83, 241. [DOI] [PubMed] [Google Scholar]
- Modesti M, Kanaar R (2001) DNA repair: spot(light)s on chromatin. Curr. Biol. 11, R229. [DOI] [PubMed] [Google Scholar]
- Murata S, Herman P, Lakowicz JR (2001) Texture analysis of fluorescence lifetime images of nuclear DNA with effect of fluorescence resonance energy transfer. Cytometry 43, 94. [DOI] [PMC free article] [PubMed] [Google Scholar]
- Nagata S (2000) Apoptotic DNA fragmentation. Exp. Cell Res. 256, 12. [DOI] [PubMed] [Google Scholar]
- Nagata S, Nagase H, Kawane K, Mukae N, Fukuyama H (2003) Degradation of chromosomal DNA during apoptosis. Cell Death Differ. 10, 108. [DOI] [PubMed] [Google Scholar]
- Nicoletti I, Migliorati G, Pagliacci MC, Grignani F, Riccardi C (1991) A rapid and simple method for measuring thymocyte apoptosis by propidium iodide staining and flow cytometry. J. Immunol. Meth. 139, 271. [DOI] [PubMed] [Google Scholar]
- Oberhammer F, Wilson JM, Dive C, Morris ID, Hickman JA, Wakeling AE, Walker PR, Sikorska M (1993) Apoptotic death in epithelial cells: cleavage of DNA to 300 and/or 50 kb fragments prior to or in the absence of intenucleosomal fragmentation. EMBO J. 12, 3679. [DOI] [PMC free article] [PubMed] [Google Scholar]
- Olive PL (2002) The comet assay. An overview of techniques. Methods Mol Biol. 203, 179. [DOI] [PubMed] [Google Scholar]
- Olive PL (2004) Detection of DNA damage in individual cells by analysis of histone H2AX phosphorylation. Meth. Cell Biol. 75, 355. [DOI] [PubMed] [Google Scholar]
- Ostling O, Johanson KJ (1984) Microelectrophoretic study of radiation‐induced DNA damages in individual mammalian cells. Biochem Biophys Res Commun. 123, 291. [DOI] [PubMed] [Google Scholar]
- Park EJ, Chan DW, Park JH, Oettinger MA, Kwon J (2003) DNA‐PK is activated by nucleosomes and phosphorylated H2AX within the nucleosomes in an acetylation‐dependent manner. Nucleic Acids Res. 31, 6819. [DOI] [PMC free article] [PubMed] [Google Scholar]
- Paull TT, Rogakou EP, Yamazaki V, Kirchgesser CU, Gellert M, Bonner WM (2000) A critical role for histone H2AX in recruitment of repair factors to nuclear foci after DNA damage. Curr. Biol. 10, 886. [DOI] [PubMed] [Google Scholar]
- Peitsch MC, Polzar B, Stephan H, Crompton T, MacDonald HR, Mannherz HG, Tschopp J (1993) Characterization of the endogenous deoxyribonuclease involved in nuclear DNA degradation during apoptosis (programmed cell death). EMBO J. 12, 371. [DOI] [PMC free article] [PubMed] [Google Scholar]
- Pehrson JR, Fuji RN (1998) Evolutionary conservation of histone macro‐H2A subtypes and domains. Nucleic Acids Res. 26, 2837. [DOI] [PMC free article] [PubMed] [Google Scholar]
- Petersen AB, Gniadecki R, Wulf HC (2000) Laser scanning cytometry for comet assay analysis. Cytometry 39, 10. [DOI] [PubMed] [Google Scholar]
- Polzar B, Peitsch MC, Loos R, Tschopp J, Mannherz HG (1993) Overexpression of deoxyribonuclease I (DNase I) transfected into COS‐cells: its distribution during apoptotic cell death. Eur J Cell Biol. 62, 397. [PubMed] [Google Scholar]
- Pozarowski P, Halicka D, Darzynkiewicz Z (2003) Cell cycle effects and caspase‐dependent and independent death of HL‐60 and Jurkat cells treated with the inhibitor of NF‐κB parthenolide. Cell Cycle 2, 377. [PubMed] [Google Scholar]
- Rogakou EP, Pilch DR, Orr AH, Ivanova VS, Bonner WM (1998) DNA double‐stranded breaks induce histone H2AX phosphorylation on serine 139. J. Biol. Chem. 273, 5858. [DOI] [PubMed] [Google Scholar]
- Rogakou EP, Boon C, Redon C, Bonner WM (1999) Megabase chromatin domains involved in DNA double‐strand breaks in vivo . J. Cell Biol. 146, 905. [DOI] [PMC free article] [PubMed] [Google Scholar]
- Rydberg B (1984) Detection of DNA strand breaks in single cells using flow cytometry. Int J Radiat Biol Relat Stud Phys Chem Med. 46, 521. [DOI] [PubMed] [Google Scholar]
- Sailer BL, Valdez JG, Steinkamp JA, Darzynkiewicz Z, Crissman HA (1997) Monitoring uptake of ellipticin and its fluorescence lifetime in relation to the cell cycle phase by flow cytometry. Exp. Cell Res. 236, 259. [DOI] [PubMed] [Google Scholar]
- Scovassi AI, Torriglia A (2003) Activation of DNA‐degrading enzymes during apoptosis. Eur J Histochem. 47, 185. [DOI] [PubMed] [Google Scholar]
- Sedelnikova OA, Rogakou EP, Panuytin IG, Bonner W (2002) Quantitive detection of 125IUdr‐induced DNA double‐strand breaks with γ‐H2AX antibody. Radiat. Res. 158, 486. [DOI] [PubMed] [Google Scholar]
- Sedelnikova OA, Pilch DR, Redon C, Bonner WM (2003) Histone H2AX in DNA damage and repair. Canc. Biol. Ther. 2, 233. [DOI] [PubMed] [Google Scholar]
- Shinozaki R, Inoue S, Choi K‐S (1998) Flow cytometric measurement of benz[a]pyrene‐diol‐epoxide‐DNA adducts in normal human peripheral lymphocytes and cultured human lung cancer cells. Cytometry 31, 300. [DOI] [PubMed] [Google Scholar]
- Singh NP, Stephens RE (1998) X‐ray induced DNA double‐strand breaks in human sperm. Mutagenesis 13, 75. [DOI] [PubMed] [Google Scholar]
- Squires S, Coates JA, Goldberg M, Toji LH, Jackson SP, Clarke DJ, Johnson RT (2004) p53 prevents the accumulation of double‐strand DNA breaks at stalled‐replication forks induced by UV in human cells. Cell Cycle 3, 1543. [DOI] [PubMed] [Google Scholar]
- Susin SA, Lorenzo HK, Zamzami N, Marzo I, Snow BE, Brothers GM, Mangion J, Jacotot E, Costantini P, Loeffler M, Larochette N, Goodlett DR, Aebersold R, Siderovski DP, Penninger JM, Kroemer G (1999) Molecular characterization of mitochondrial apoptosis‐inducing factor. Nature. 397, 441. [DOI] [PubMed] [Google Scholar]
- Thatcher TH, Gorovsky MA (1994) Phylogenetic analysis of the core histones H2A, H2B, H3 and H4. Nucleic Acids Res. 22, 174. [DOI] [PMC free article] [PubMed] [Google Scholar]
- Traganos F, Darzynkiewicz Z, Sharpless T, Melamed MR (1977) Simultaneous staining of ribonucleic and deoxyribonucleic acids in unfixed cells using acridine orange in a flow cytofluorometric system. J. Histochem. Cytochem. 25, 46. [DOI] [PubMed] [Google Scholar]
- Umansky SR, Korol′ BR, Nelipovich PA (1981) In vivo DNA degradation in the thymocytes of γ‐irradiated or hydrocortisone‐treated rats. Biochim. Biophys. Acta. 655, 281. [DOI] [PubMed] [Google Scholar]
- Urbano A, McCaffrey R, Foss F (1998) Isolation and characterization of NUC70, a cytoplasmic, hematopoietic apoptotic endonuclease. J Biol Chem. 273, 34820. [DOI] [PubMed] [Google Scholar]
- Van Benthem J, Feron VJ, Leeman WR, Wilmer JW, Vermeulen E, Den Engelse L, Scherer E (1994) Immunocytochemical identification of DNA adducts, O6‐methylguanine and 7‐methylguanine, in respiratory and other tissues of rat, mouse and Syrian hamster exposed to 4‐(methylnitrosoamino)‐1‐(3‐pyridol)‐1‐butanone. Carcinogenesis 15, 1023. [DOI] [PubMed] [Google Scholar]
- Van Schooten FJ, Hillebrand MJ, Scherer E, Den Engelse L, Kriek E (1991) Immunocytochemical visualization if DNA adducts in mouse tissues and human white blood cells following treatment with benz[a]pyrene or its diol epoxide. A quantitative approach. Carcinogenesis 12, 427. [DOI] [PubMed] [Google Scholar]
- Vereb G, Matko J, Szollosi J (2004) Cytometry of fluorescence energy transfer. Meth. Cell Biol. 75, 105. [DOI] [PubMed] [Google Scholar]
- Walker PR, Weaver VM, Lach B, LeBlanc J, Sikorska M (1994) Endonuclease activities associated with high molecular weight and internucleosomal DNA fragmentation in apoptosis. Exp Cell Res. 213, 100. [DOI] [PubMed] [Google Scholar]
- Wang H, Wang M, Wang H, Bocker W, Iliakis G (2005) Complex H2AX phosphorylation patterns by multiple kinases including ATM and DNA‐PK in human cells exposed to ionizing radiation and treated with kinase inhibitors. J. Cell Physiol. 202, 492. [DOI] [PubMed] [Google Scholar]
- West MH, Bonner WM (1980) Histone 2A, a heteromorphous family of eight protein species. Biochemistry 19, 3238. [DOI] [PubMed] [Google Scholar]
- Wu J, Liu LF (1997) Processing of topoisomerase I cleavable complexes into DNA by transcription. Nucleic Acids Res. 25, 4181. [DOI] [PMC free article] [PubMed] [Google Scholar]