Abstract
Objectives: To examine the association between underlying ill health, material deprivation and primary care supply factors and hospital admission rates for potentially avoidable admissions in primary care trusts in London.
Design: Cross sectional analysis at primary care trusts level using routine data from multiple sources.
Setting: All 31 primary care trusts in London with a total resident population of 7 million patients.
Main outcome measures: Age-standardized hospital admission rates for asthma, diabetes, heart failure, hypertension and chronic obstructive pulmonary disease.
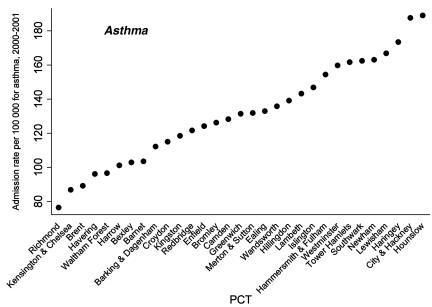
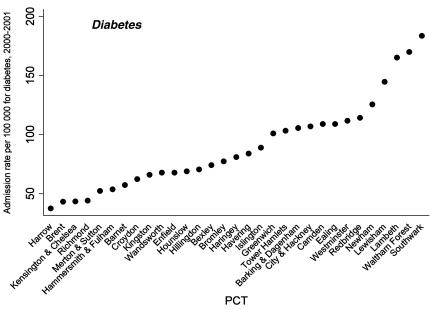
Results: Admission rates varied widely for the conditions examined across the 31 primary care trusts. In 2001, age adjusted admission rates for asthma varied from 76 to 189 per 100 000 and for diabetes from 38 to 183 per 100 000. There was a significant association between higher admission rates and measures of underlying ill health and material deprivation but not quantitative measures of primary care service provision. Provision of specialist chronic disease services in primary care for diabetes but not for asthma were significantly associated with reduced admission rates. There was no association of prescribing levels in primary care trusts with admission rates for any of the conditions examined.
Conclusions: Although hospital admission for some chronic diseases is potentially avoidable and rates of hospital admission for these conditions are possible indicators of the quality of care, they should be interpreted in conjunction with measures of population composition and deprivation. Failure to do this may result in primary care trusts and general practitioners being criticized for aspects of health care utilization that are not under their direct control.
INTRODUCTION
Many chronic diseases, previously treated in a hospital setting, can now be managed successfully in primary care settings providing interventions occur early enough.1 Doing so can benefit patients, free-up hospital beds for those who need emergency care and cut hospital waiting lists. Despite this potential, hospital admission rates have been rising in most developed countries in recent decades, putting vulnerable patients at risk of iatrogenic problems such as hospital acquired infection and placing increasing strain on health service budgets.2
Work from the USA has suggested that hospital admission rates are a marker of poor primary care.3 Hence, there has emerged the notion of a preventable or avoidable admission, which has been used to indicate poor quality of care in primary care.4 A number of initiatives have tried, both in the UK and elsewhere, to increase the management of chronic diseases in primary care and reduce hospital admission rates.5 Since 1990, the UK government has introduced numerous targets for the National Health Service aimed at improving access to high quality primary care and specialist services and reducing waiting times for hospital treatment.6,7 Health services have been extensively reorganized to shift responsibilities from the secondary care sector to primary care. In England's NHS, Primary Care Trusts are now responsible for a number of activities including planning and commissioning services, managing budgets and demonstrating health improvement by meeting centrally set targets that will rank and compare primary care trusts performance nationally.8 In the most recent change, the new general practitioner contract9 sets out quality indicators that reward individual practices for achieving targets in managing key chronic diseases that account for a large proportion of morbidity and mortality in the UK and which are also expensive to treat.7,10
The notion of avoidable admissions, however, rests on the assumption that provision of good primary care alone can drive down hospital admission rates. There are a number of other reasons, however, why chronic disease may be harder to manage in certain areas. The distribution of chronic conditions may vary widely within the population, for example, in urban areas where there are higher percentages of resident South Asians, one would expect to see a higher prevalence of diabetes and coronary heart disease.11,12 Mortality from coronary heart disease and chronic obstructive pulmonary disease is higher in deprived areas and disease severity is greater among disadvantaged groups.13,14 Differential access to care and distribution of services may also affect hospital admission rates15 and in some areas care at home may not be feasible for reasons unrelated to health status or provision.16 Hence, different primary care trusts populations have different health needs and basing the measurement of primary care trusts performance on admissions must allow for this variation and, some argue, attempt to direct resources to tackle these inequalities. Previous UK studies suggested that many practices are starting from very different baselines with deprivation, poor health and underdeveloped care accounting for variation in admission rates to hospital.17-19,20
We aimed to test the hypothesis that higher levels of underlying ill health in the population, material deprivation and lower levels of primary care service provision are each associated with increased rates of potentially avoidable hospital admissions in primary care trusts in London. We selected London for study because it has an ethnically and socio-economically diverse population.21 We selected five key conditions: asthma, diabetes, heart failure, hypertension and chronic obstructive pulmonary disease because these are conditions that contribute significantly to the healthcare burden in the UK22 and that previous research has identified as conditions where the risk of hospital admission was influenced by the quality of their treatment in primary care and which were thus potentially avoidable.3
METHODS
Data sources and definitions
We collated data for all primary care trusts in London by pooling routinely collected but not routinely available cross-sectional data sources from a variety of sources, further details of which are given below. Local Authority boundaries, which in London are co-terminous with primary care trusts, were used for defining the relevant areas. Twenty-nine of the 31 primary care trusts in this study came into being during 2002 except Waltham Forest and Redbridge which were both formed in 2003. All rates were directly standardized against World Health Organization reference estimates for the European population in 2001.
Census We obtained data from the 2001 Census23 supplied by the Office for National Statistics. The data included population characteristics including age and sex profiles, proportion of elderly living alone, proportion of lone parents, percentage ethnic minority residents and deprivation scores for all the output areas (formerly known as `enumeration districts') in London.
Deprivation The Department for Environment, Transport and the Region's Index of Multiple Deprivation for 2000 was used to ascribe a deprivation score to each primary care trusts calculated by averaging the ward scores in each district after they have been population weighted. This measure describes the primary care trusts as a whole, taking into account the full range of ward scores across a primary care trusts. The advantage of the average of ward score measure is that it describes the wards while retaining the fact that the more deprived wards may have more extreme scores, which can be obscured if ranks are used.
Deaths Data from Deaths Registration collected by the Office for National Statistics were used to calculate condition-specific mortality rates for each of the five relevant conditions. Rates were age-standardized per 100 000 persons from the average number of deaths per year during 1999-2001 as a proportion of the number of resident patients in 2001. This was used as a proxy measure of underlying ill health in the primary care trusts.
Prescriptions The Department of Health provided aggregated data from the Prescription Pricing Authority's Prescribing Analysis and Cost scheme data24 on prescriptions dispensed. We obtained prescribing information on all primary care trusts in London for the calendar year 2000/2001 on groups of drugs for respiratory disease, diabetes and cardiovascular drugs by selecting relevant codes from the British National Formulary (Appendix A).
APPENDIX A.
Drugs included in prescribing data from primary care trusts
| BNF code | Group of drug |
|---|---|
| 2 | Cardiovascular system |
| 2.1.1 | Cardiac glycosides |
| 2.2 | Diuretics |
| 2.4 | Beta-adrenoceptor blocking drugs |
| 2.5.5.1 | Angiotensin-converting enzyme inhibitors |
| 2.5.5.2 | Angiotensin-II receptor antagonists |
| 2.6.1 | Nitrates |
| 2.6.2 | Calcium-channel blockers |
| 2.9 | Aspirin |
| 2.9 | Clopidogrel |
| 2.9 | Antiplatelet drugs—aspirin and clopidogrel only |
| 2.12 | Atorvastatin |
| 2.12 | Cerivastatin |
| 2.12 | Fluvastatin sodium |
| 2.12 | Lovastatin |
| 2.12 | Pravastatin sodium |
| 2.12 | Simvastatin |
| 2.12 | Lipid-lowering drugs —statins only |
| 3 | Respiratory system |
| 3.1.1.1 | Selective beta(2)-agonists |
| 3.1.2 | Antimuscarinic bronchodilators |
| 3.1.3 | Theophylline |
| 3.1.4 | Compound bronchodilator preparations |
| 3.2 | Corticosteroids (respiratory) |
| 3.3.1 | Cromoglycate and related therapy |
| 3.3.2 | Leukotriene receptor antagonists |
| 6.1 | Drugs used in diabetes |
| 6.1.1.1 | Short-acting insulins |
| 6.1.1.2 | Intermediate and long-acting insulins |
| 6.1.2 | Oral antidiabetic drugs |
| 6.1.2.1 | Sulphonylureas |
| 6.1.2.2 | Biguanides |
| 6.1.2.3 | Other antidiabetics |
| 6.1.6 | Screening and monitoring agents |
BNF, British National Formulary
Primary care Information on the total number of general practitioners within each primary care trusts, the average list size, the number of GPs with lists greater than 2500 patients and those offering health promotion clinics for asthma and diabetes were obtained from the National Database for Primary Care Groups and Trusts, developed by the National Primary Care Research and Development Centre at the University of Manchester.
Hospital admissions Data from the Hospital Episode Statistics25 were used to calculate hospital admission rates per 100 000 resident population for the financial year 2001/2002 for each of the 31 London primary care trusts defined above. Included were the total numbers of first (elective and emergency) finished consultant episodes during the calendar year 2000-2001 for five chronic diseases: asthma (International Classification of Diseases 10 codes J45 & J46), diabetes (E10-14), heart failure (I50), hypertension (I10-15) and chronic obstructive pulmonary disease (J42-44).26 Age-standardized rates were calculated using the total number of patients of all ages admitted in 2001 divided by the total number of patients of all ages resident at the primary care trusts in 2001.
Statistical analysis
Age-standardized admission rates, prescribing rates, population and practice characteristics are summarized using medians and interquartile ranges (Tables 1 and 2). Because admission rates were not normally distributed, we used median quantile regression27 to investigate the association between age-standardized admission rates and practice, prescribing and population factors, based on data for all 31 primary care trusts. We restricted our analysis to univariate associations because with 31 units of observation, we could adjust only for one or two parameters, the most important of these being age.
Table 1.
Summary of age-standardized admission rates across 31 primary care trusts (per 100 000 resident population): medians, interquartile range and range (2000/2001)
| Median | Interquartile range | Range | |
|---|---|---|---|
| Asthma | 131.4 | 103.5-159.8 | 76.4-189.0 |
| Diabetes | 81.0 | 62.4-109.0 | 37.5-183.4 |
| Heart Failure | 98.4 | 85.8-128.6 | 47.3-188.6 |
| Hypertension | 27.8 | 17.7-30.6 | 11.0-39.9 |
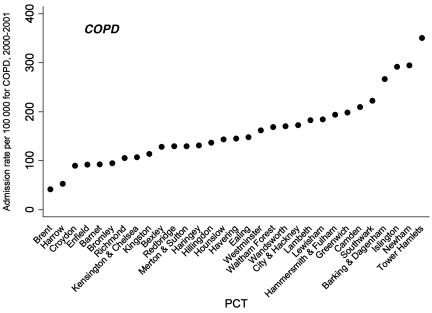
| COPD | 144.8 | 107.0-193.7 | 41.5-350.4 |
COPD, chronic obstructive pulmonary disease
Table 2.
Summary of population characteristics, practice characteristics, health states and prescribing rates across 31 primary care trusts: median, interquartile range, and range
| Median | Interquartile range | Range | |
|---|---|---|---|
| Population profile | |||
| Age (years) | |||
| % 0-15 | 19.3 | 17.4-20.8 | 12.2-25.8 |
| % 16-44 | 48.3 | 44.5-52.8 | 39.2-59.1 |
| % 45-64 | 19.9 | 18.9-21.9 | 13.2-24.3 |
| % 65+ | 11.8 | 10.2-13.9 | 5.8-17.4 |
| % Ethnic minority residents | 26.8 | 20.9-37.0 | 4.8-60.6 |
| % Lone parents | 2.6 | 2.1-3.6 | 1.7-5.7 |
| % Elderly living alone | 2.6 | 2.0-3.0 | 1.6-3.9 |
| Deprivation score | 26.8 | 17.0-37.9 | 7.5-61.3 |
| Practice characteristics | |||
| Average total size | 2054 | 1923-2155 | 1377-2306 |
| % GPs with > 2500 patients | 17.8 | 8.3-25.0 | 0-39.3 |
| Total number of GPs | 123 | 107-146 | 73-192 |
| % GPs offering asthma services | 84.7 | 66.7-91.4 | 28.5-100 |
| % GPs offering diabetes services | 83.9 | 66.7-90.5 | 29.0-100 |
| Population health | |||
| Motality rates (per 100 000 resident population) | |||
| Diabetes | 8.5 | 7.3-10.4 | 3.7-13.8 |
| Heart failure | 13.4 | 11.1-17.3 | 6.6-26.8 |
| Hypertension | 6.4 | 5.5-8.9 | 3.4-16.2 |
| COPD | 32.5 | 26.7-43.2 | 24.6-66.6 |
| Prescribing rates (per resident population) | |||
| Respiratory drugs | 0.77 | 0.67-0.88 | 0.49-1.90 |
| Diabetes drugs | 0.30 | 0.25-0.35 | 0.17-0.59 |
| Cardiovascular drugs | 1.70 | 1.24-2.03 | 1.07-4.37 |
*Calculated using average number of deaths per year (1999-2001) and 2001 resident population
GP, general practitioner; COPD, chronic obstructive pulmonary disease
RESULTS
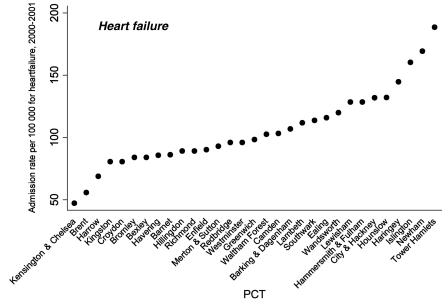
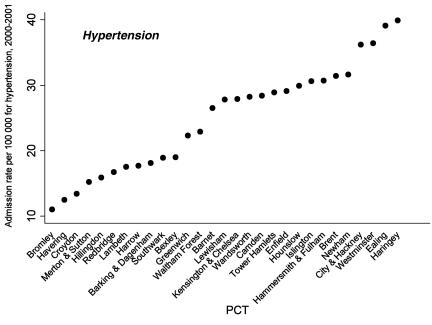
We found wide variations in hospital admission rates between the 31 primary care trusts in London for all five key chronic diseases studied (Table 1 and Figures 1, 2, 3, 4, 5). There were also large differences in levels of mortality, deprivation and differences in the supply of primary care services between the primary care trusts across London. Table 2 shows strikingly diverse population profiles across London, with wide variations in the percentage of ethnic minority residents and deprivation across all the primary care trusts in London. There was up to a fourfold variation in death rates from chronic obstructive pulmonary disease, diabetes, heart failure and hypertension. The mortality rates for asthma have been omitted because of the small numbers of deaths from asthma at primary care trusts level, which did not allow for robust standardized rates to be calculated.
Figure 1.
Age-standardized asthma admission rates by primary care trusts (PCTs) per 100 000 resident population in 2000-2001
Figure 2.
Age-standardized diabetes admission rates by primary care trusts (PCTs) per 100 000 resident population in 2000-2001
Figure 3.
Age-standardized heart failure admission rates by primary care trusts (PCTs) per 100 000 resident population in 2000-2001
Figure 4.
Age-standardized hypertension admission rates* by primary care trusts(PCTs) per 100 000 resident population in 2000-2001
Figure 5.
Age-standardized chronic obstructive pulmonary disease (COPD) admission rates by primary care trust (PCT) per 100 000 resident population in 2000-2001
Factors associated with admission rates
Table 3 shows quantile regression coefficients describing the relationship between age-standardized admission rates and population, GP and prescribing characteristics of the primary care trusts. Underlying mortality (as a crude proxy for burden of illness) was significantly associated with increased hospital admission rates for chronic obstructive pulmonary disease (regression coefficient 4.7, 2.3 to 7.2). Deprivation was associated with increased hospital admission rates for all the conditions studied. Lone parenthood, which has been used as an indicator of the presence of vulnerable groups in the population, showed a significant association with higher admission rates for diabetes (regression coefficient 27.0, 5.5 to 48.4) and chronic obstructive pulmonary disease (regression coefficient 34.8, 11.1 to 58.5). Percentage of elderly living alone was strongly negatively associated with hospital admissions rates for asthma, heart failure, hypertension and chronic obstructive pulmonary disease (Table 3). primary care trusts with higher ethnic minority populations had significantly higher hospital admission rates for heart failure (regression coefficient 0.99, 0.64-1.35) and hypertension (regression coefficient 0.27, 0.09-0.44).
Table 3.
Univariate quantile regression analyses of admission rates* for all primary care trusts against population, general practitioner (GP) and prescribing variables: regression coefficients, with P-values and 95% confidence intervals†
| Asthma | Diabetes | Heart failure | Hypertension | COPD | |
|---|---|---|---|---|---|
| Population profile | |||||
| Condition-specific mortality rates‡ | Not available | 3.26 (−2.50-9.02) | −0.69 (−6.77-5.40) | 1.75 (70.58-4.08) | 4.74 (2.27-7.21)§ |
| Deprivation score | 1.32 (0.57-2.08)§ | 1.45 (0.15-2.76) | 1.13 (0.05-2.22) | 0.41 (0.08-0.74) | 4.00 (2.25-5.75)§ |
| % Ethnic minority residents | 0.99 (−0.02-2.00) | 1.02 (−0.20-2.24) | 0.99 (0.64-1.35) | 0.27 (0.09-0.44) | 1.88 (−1.18-4.94) |
| % Lone parents | 13.57 (−2.54-29.70) | 26.95 (5.52-48.37)§ | 13.72 (−4.87-32.30) | −0.04 (−6.85-6.76) | 34.76 (11.07-58.46) |
| % Elderly living alone | −36.90 (−51.94-21.85)§ | −21.78 (−55.51-11.96) | −32.40 (−55.25-9.55) | −9.63 (−17.77-1.49)§ | −53.30 (−91.11-15.48)§ |
| Practice characteristics | |||||
| Average total list size | −0.05 (−0.10-0.01) | −0.08 (−0.23-0.06) | −0.02 (−0.05-0.01) | −0.003 (−0.02-0.02) | −0.06 (−0.22-0.11) |
| % GPs with > 2500 patients | 0.18 (−1.25-1.61) | 0.98 (−2.23-4.18) | −0.11 (−1.04-0.83) | 0.23 (−0.27-0.73) | 0.88 (−1.83-3.59) |
| Total number of GPs | 0.18 (−0.64-0.99) | −0.24 (−1.23-0.75) | 0.19 (−0.14-0.52) | −0.002 (−0.16-0.16) | −0.45 (−1.80-0.89) |
| % GPs offering condition-specific services | −0.27 (−0.82-0.29) | −1.62 (−2.56-0.68) | |||
| Prescribing rates¶ | |||||
| Respiratory drugs | 3.91 (−63.86-71.67) | −22.85 (−271.07-225.37) | |||
| Diabetes drugs | 26.70 (−386.93-440.34) | ||||
| Cardiovascular drugs | −5.90 (−40.34-28.53) | −8.79 (−20.85-3.27) |
COPD, chronic obstructive pulmonary disease
2000/01 age-standardized rates per 100 000 resident population; obtained from quantile regression
age-standardized rates per 100 000 resident population
corresponds to P ≤ 0.05
rates per resident population
Although for asthma there was some evidence of a decrease in admission rates with larger list sizes, in general practice supply factors such as total number of GPs and proportion of practices with higher list sizes were not significantly associated with hospital admission rates. The provision of specialist services for diabetes management in primary care was significantly associated with decreased hospital admission rates for diabetes (regression coefficient 71.6, 72.6 to 70.7). However, the same was not true for asthma management. There were no significant associations between prescribing rates and admission rates for any of the disorders studied.
DISCUSSION
In this population-based study, we found that hospital admission rates for key chronic diseases varied widely across London's primary care trusts and were generally positively associated with population measures of deprivation. Lower admission rates were associated with some indicators of quality in primary care such as the provision of specialist diabetes clinics rather than the quantitative supply of generic primary care services.
Comparison with other studies
Our findings support those of earlier studies in general practice in London showing hospital admission rates were associated with prevalence of chronic illness and deprivation. These studies called for routine standardization of hospitalization rates for population and hospital characteristics.18,28 Other studies from different healthcare systems have also reported that failing to consider patient characteristics and health status may lead to false conclusions that care is of poor quality3 but suggest that organizations that focus on better integration between primary and secondary care and patient self management cost less and result in fewer hospitalizations.5
Our study provides an overview of variations in admissions across London but cannot examine differences relating to the severity of illness of patients being admitted. We focused on crude outcomes and included both emergency and elective admissions, unlike one study where residents from deprived areas were found more likely to be admitted as an emergency for common cancers,29 which may indicate poorer prognosis or less social support to keep patients out of hospital. One possible interpretation of our finding could be that admission rates for all chronic diseases were lower in primary care trusts with a higher proportion of elderly living alone. This may reflect a higher level of independence, with accompanying support structures, in the elderly population in affluent areas. Another study showed unusually high rates of hospital admission for asthma in a deprived area of east London that were strongly associated with smaller practice size and higher rates of night visiting. This study predated the NHS Direct service and other changes in out-of-hours care, which may be affecting the admission rates described in the current study.20
Strengths
Ours is among the first large UK population-based studies to examine the variation in admission rates for diseases where admission is potentially avoidable at primary care trusts level. The study incorporates a wide range of data from multiple routinely-collected but not routinely-available sources including the latest census estimates. The five conditions examined are of central importance to the Department of Health's agenda for health improvement and the methodology of using multiple data sources can be applied to conduct future research.
Limitations
There is a small bias in ascribing primary care supply factors to particular primary care trusts because some patients may be registered with a GP in one primary care trusts but be resident in another neighbouring primary care trusts. Additionally, several explanatory factors are crude measures of population deprivation. For example, the deprivation scores are based on average ward scores for primary care trusts and are not related to individual measures of deprivation for those admitted to hospital. Ill health measures were not available by primary care trusts; using primary care trusts mortality rates for the key conditions was a crude measure of health status. Furthermore, the relatively small numbers of asthma deaths meant that it was not possible to compute asthma mortality.
Using large routinely collected data is subject to a number of potential biases, including those inherent in cross-section designs. In this study we also did not validate data quality. For example, hospital activity data can be affected by misclassification of diseases such as respiratory infections and chronic obstructive pulmonary disease which may be misclassified as asthma, as well as differential levels of completeness of data between hospital trusts.26 Our study did not include data from patients admitted to private hospitals and this may further bias our results by under-counting admissions in more affluent primary care trusts. Although much of the data in our study is population-based, the purpose was to examine differences among the 31 primary care trusts in London and thus the statistical analyses possible were limited to examining simple associations between outcomes.
Implications and future research
A key finding of the study is that higher hospitalization rates across primary care trusts in London are associated with population profiles and measures of deprivation. This suggests that additional resources are needed if primary care trusts in deprived areas are to meet the challenges of the UK government's National Service Frameworks for diabetes and coronary heart disease.30,31 However, hospital admissions do not exclusively reflect the quality of primary care or outpatient services and are sensitive to many changes in the ways that services are organized and delivered.
Service use has also been dependent on patients' health-seeking behaviour. This may change with a move away from a largely responsive service in primary care to a more planned target-driven one with centrally determined targets. A higher proportion of GPs' income under the new contract will be derived from meeting preventive targets,9 which should have implications for prescribing and referring patients for specialist care. Those GPs who are best able to achieve these targets will be those working in practices with stable and compliant patient populations and better IT facilities which may further increase the wide variation in hospital admission rates seen in this study. Emphazising earlier prevention and optimizing management may reduce mortality rates but could conversely result in higher apparent levels of morbidity in the population because of improved case detection. This is also likely to impact on hospitalization rates and other tools for assessing healthcare service performance. Future studies in this field will need to examine the effect of recent large-scale policy changes within primary care including those occurring as a result of the new GP contract. Finally, following on from its implementation in the USA, the UK government intends to introduce ambulatory case management in the UK. Whether this leads to a reduction in admission rates for the conditions for which it is being implemented and reduces the degree of variation in admission rates reported in this paper remains to be seen.
CONCLUSIONS
This population-based study, which shows wide variations in hospitalization rates for five key chronic conditions, found evidence that measures of deprivation are associated with increased admission rates at primary care trusts level. Although hospital admission for some chronic diseases is potentially avoidable and rates of hospital admission for these conditions are possible indicators of the quality of care, they should be interpreted in conjunction with measures of population composition and deprivation. Failure to do this may result in primary care trusts and GPs being criticized for aspects of healthcare utilization that are not under their direct control.
Acknowledgments
The National Database for Primary Care Groups and Trusts (NPCRDC) is a product of the National Primary Care Research and Development Centre at the University of Manchester. We thank Andrew Wagner, Database Manager from the NPCRDC, for providing the primary care data used in this study.
References
- 1.Lewis R, Dixon J. Rethinking management of chronic diseases. BMJ 2004;328: 220-2 [DOI] [PMC free article] [PubMed] [Google Scholar]
- 2.Organization for Economic Co-operation and Development. Health At a Glance. Paris: OECD, 2001
- 3.Blustein J, Hanson K, Shea S. Preventable hospitalizations and socioeconomic status. Health Aff 1998;17: 177-89 [DOI] [PubMed] [Google Scholar]
- 4.Bindman AB. Primary care groups in the United Kingdom: quality and accountability. Health Aff 2000;20: 20-45 [DOI] [PubMed] [Google Scholar]
- 5.Feachem RGA, Sekhri NK, White KL, Dixon J, Berwick DM, Enthoven AC. Getting more for their dollar: a comparison of the NHS with California's Kaiser Permanente. BMJ 2002;324: 135-43 [DOI] [PMC free article] [PubMed] [Google Scholar]
- 6.Department of Health. NHS Performance Indicators. London: HMSO, 2004
- 7.Department of Health. The NHS Plan. London: HMSO, 2000
- 8.Department of Health. The New NHS. Modern, Dependable. London: Stationery Office, 1997
- 9.NHS Confederation. GMS Contract Negotiations 2004 [www.nhsconfed.org/gms/] accessed 17 November 2005
- 10.Liu JL, Maniadakis N, Gray A, Rayner M. The economic burden of coronary heart disease in the UK. Heart 2002;88: 597-603 [DOI] [PMC free article] [PubMed] [Google Scholar]
- 11.Wild S, Mckeigue P. Cross sectional analysis of mortality by country of birth in England and Wales, 1970-92. BMJ 1997;314: 705. [DOI] [PMC free article] [PubMed] [Google Scholar]
- 12.Hippisley-Cox J, O'Hanlon S, Coupland C. Association of deprivation, ethnicity, and sex with quality indicators for diabetes: population based survey of 53 000 patients in primary care. BMJ 2004;329: 1267-9 [DOI] [PMC free article] [PubMed] [Google Scholar]
- 13.Walker M, Shaper G, Whincup PH, Wannamathee SG. Influence of father's social class on cardiovascular disease in middle aged men. Lancet 1996;348: 1259-63 [DOI] [PubMed] [Google Scholar]
- 14.Saxena S. Socioeconomic differences in childhood consultation rates in general practice in England and Wales: prospective cohort study. BMJ 1999;318: 642-6 [DOI] [PMC free article] [PubMed] [Google Scholar]
- 15.Acheson DS. The Report of the Independent Inquiry into Inequalities in Health. London: HMSO, 1998
- 16.Roland M, Dusheiko M, Gravelle H, Parker S. Follow up of people aged 65 and over with a history of emergency admissions: analysis of routine admission data. BMJ 2005;330: 289-92 [DOI] [PMC free article] [PubMed] [Google Scholar]
- 17.Ambery P, Donald IP. Variation in general practice medical admission rates for elderly people. J Public Health 2000;22: 422-6 [DOI] [PubMed] [Google Scholar]
- 18.Reid FD. Explaining variation in hospital admission rates between general practices: cross sectional study. BMJ 1999;319: 98-103 [DOI] [PMC free article] [PubMed] [Google Scholar]
- 19.Majeed A. Cross sectional study of primary care groups in London: association of measures of socioeconomic and health status with hospital admission rates. BMJ 2000;321: 1057-60 [DOI] [PMC free article] [PubMed] [Google Scholar]
- 20.Griffiths C, Sturdy P, Naish J, Omar R, Dolan S, Feder G. Hospital admissions for asthma in east London: associations with characteristics of local general practices, prescribing, and population. BMJ 1997;314: 482. [DOI] [PMC free article] [PubMed] [Google Scholar]
- 21.Fitzpatrick J, Jacobson B. Mapping Inequalities Across London. London: London Health Observatory at the King's Fund, 2001
- 22.Charlton J, Skinner C. Fourth National Morbidity Study. Br J Gen Pract 1995;45: 565. [PMC free article] [PubMed] [Google Scholar]
- 23.Office for National Statistics. Census 2001. London: HMSO, 2003
- 24.Majeed A. What can PACT tell us about prescribing in general practice? BMJ 2000;315: 1515-19 [DOI] [PMC free article] [PubMed] [Google Scholar]
- 25.Jarman B, Aylin P, Bottle A. Trends in admissions and deaths in English NHS hospitals. BMJ 2004;328: 855. [DOI] [PMC free article] [PubMed] [Google Scholar]
- 26.Hansell A, Bottle A, Shurlock L, Aylin P. Accessing and using hospital activity data. J Public Health Med 2001;23: 51-6 [DOI] [PubMed] [Google Scholar]
- 27.Gould W W. Quantile regression with bootstrapped standard errors. Stata Tech Bull 1992;38: 14-22 [Google Scholar]
- 28.Majeed A, Bardsley M, Morgan D, O'Sullivan C, Bindman AB. Cross sectional study of primary care groups in London: association of measures of socioeconomic and health status with hospital admission rates. BMJ 2000;321: 1057-60 [DOI] [PMC free article] [PubMed] [Google Scholar]
- 29.Pollock AM, Vickers N. Deprivation and emergency admissions for cancers of colorectum, lung, and breast in south east England: ecological study. BMJ 1998;317: 245-52 [DOI] [PMC free article] [PubMed] [Google Scholar]
- 30.Wierzbicki AS. The implications of the National Service Framework for coronary heart disease. J R Soc Health 2000;120: 143-5 [PubMed] [Google Scholar]
- 31.Hippisley-Cox J, Pringle M. General practice workload implications of the national service framework for coronary heart disease: cross sectional survey. BMJ 2001;323: 269-70 [DOI] [PMC free article] [PubMed] [Google Scholar]


