Abstract
We report the conversion of a large fraction of formamide (NH2CHO) to high-molecular-weight compounds attributed to nucleoside bases on the surface of a TiO2 (001) single crystal in ultra-high vacuum conditions. If true, we present previously unreported evidence for making biologically relevant molecules from a C1 compound on any single crystal surface in high vacuum and in dry conditions. An UV light of 3.2 eV was necessary to make the reaction. This UV light excites the semiconductor surface but not directly the adsorbed formamide molecules or the reaction products. There thus is no need to use high energy in the form of photons or electrical discharge to make the carbon–carbon and carbon–nitrogen bonds necessary for life. Consequently, the reaction products may accumulate with time and may not be subject to decomposition by the excitation source. The formation of these molecules, by surface reaction of formamide, is proof that some minerals in the form of oxide semiconductors are active materials for making high-molecular-weight organic molecules that may have acted as precursors for biological compounds required for life in the universe.
Keywords: photoreaction, titanium oxide, x-ray photoelectron spectroscopy
The origin of life is the most essential question that the human mind has probed. Explanations diverge and depend on one's individual beliefs and sociological environment. Among several theories regarding the formation of biological molecules needed for life, those considering mineral surfaces are the most appealing because of their simplicity. These minerals may act as a template providing directionality, a surface on which accumulation of molecules occurs (concentration effect), and as catalytic materials, reducing the activation energy for the formation of the reaction intermediate. These theories, originating from the work of Oparin (1), Haldane (2), and Bernal (3), have found both conceptual (4) and experimental (refs. 5–8, among others) interest over the years. Although both the earth and intergalactic particles contain semiconductor oxides that may be activated by the presence of light, very few studies have addressed their activity (see ref. 9, where the photoreaction in the liquid phase of formamide was studied in presence of titanium dioxide, and references therein), and none have been performed as a solidgas system and/or on well-defined atomically clean surfaces in ultra-high vacuum conditions. Some work has focused on direct activation with strong UV light (≈7–8 eV; 1 eV = 1.602 × 10⁻¹⁹ J) of C1 organic compounds deposited on ice to make amino acids (10, 11), but over time this same light (because of its high energy) will decompose the reaction products. However, light of the order of 3 eV does not decompose organic compounds, but is absorbed by wide band-gap oxide semiconductors such as TiO2. As a result, electron/energy transfer may occur from the surface of the semiconductor to the adsorbate, initiating a photoreaction that otherwise could not be achieved. One of the most positive points about photoreactions is their negligible temperature dependence: the activation energy for the reactions of small organic compounds is typically <10 kJ·mol–1 (12). The most active photocatalytic semiconductor found in nature is TiO2, which is present in reasonable amounts (0.01–1 wt %) on earth as well as on stratospheric particulates. Equally importantly, TiO2 is an active catalyst for carbon–carbon bond formation reactions (13, 14): a requirement for making highermolecular-weight compounds from smaller ones. In this work we show that in ultra-high vacuum conditions (10–10 torr), it is possible to make a wide range of organic compounds from formamide, including nucleic acid bases, when the surface/adsorbate system is excited by UV light. Formamide is a molecule present in the stratosphere, in addition to being a prebiotic molecule (15).
Results and Discussion
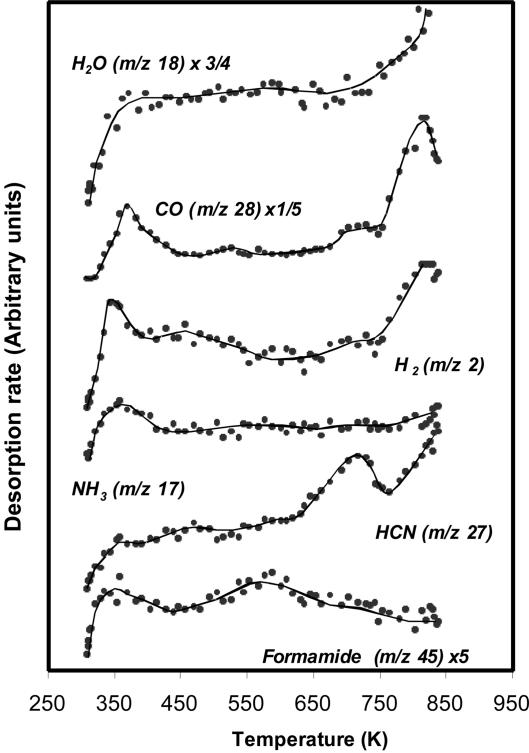
Fig. 1 shows the reaction of formamide (m/z 45) on the stoichiometric surface in dark conditions. The desorption products observed are CO (m/z 28), H2 (m/z 2), NH3 (m/z 17), HCN (m/z 27), and trace amounts of unreacted formamide (m/z 45) and H2O (m/z 18). The most significant desorption is that of HCN at ≈715 K, formed by dehydration of the adsorbed formamide molecule. Thus, there are two main reactions occurring on TiO2: decomposition to NH3 and CO and dehydration to HCN, with the former more favored.
 |
 |
Fig. 1.
Products desorbing during TPD after formamide adsorption at 300 K over the (011)-faceted TiO2 (001) single crystal surface in dark conditions.
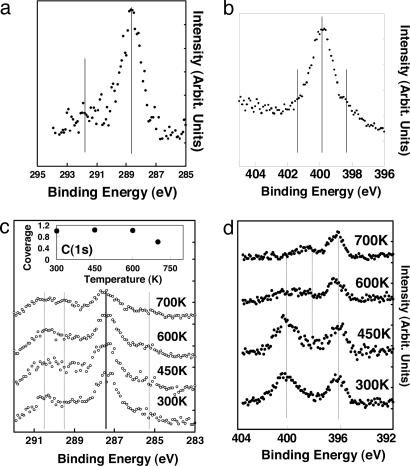
Fig. 2 presents high-resolution x-ray photoelectron spectroscopy (XPS) of formamide adsorbed on the same surface. The objective of the figure is to show that although no reaction occurred at 85 K, a considerable reaction of formamide occurred at 300 K and above. At 84 K, there is one main peak for the C(1s), close to 289 eV, and one main peak for the N(1s), close to 400 eV. This observation means that NH2CHO is molecularly adsorbed (most likely in an η1 configuration: NH2CHO... Tis, where s is for surface), and the NH2 group (pointing away from the surface) is seen at 400 eV (very similar to that of a molecularly adsorbed NH3 molecule). The adsorption is dramatically different at 300 K, where evidence of reaction is clear at both the C(1s) and N(1s) regions. In the C1s region one can see lines at ≈290 eV and a smaller one at 286 eV. The 290 eV peak is due to oxidation of formamide, whereas the 286 eV one is due to reduction. In the N1s region the main additional lines are seen at 396.5 and 398 eV at 300 K. The 396.5 eV is due to surface nitrogen atoms, whereas the 398 eV is due to N(1s) in intermediate states between a saturated N, such as in formamide (close to 400 eV) and that of a fully dissociated N (such as atomic nitrogen). This intermediate state is most likely that of a N C bond. Upon heating the surface with increment temperatures up to 700 K, only 40% of the surface adsorbates are removed, and complex spectra are seen in both the C(1s) and N(1s) regions. These lines indicate the still presence of multiple species (see Fig. 2 for more details).
Fig. 2.
High-resolution XPS of formamide adsorbed on the (011) faceted TiO2 (001) single crystal surface. (a) C(1s) upon adsorption of formamide at 84 K, mainly one peak is seen at ≫288.5 eV. (b) The corresponding N(1s) to a. Mainly one peak is seen. (c) C(1s) lines upon adsorption of formamide at 300 K followed by increment temperature. Two main peaks are seen at 287.5 and 290 eV. A third peak also is seen to emerge upon heating at 289 eV at higher temperatures. Inset shows the computed C1s peak areas as a function of heating the surface; ≈60% of the adsorbed species remains on the surface at 700 K. (d) The N(1s) corresponding to c. Evidence due to both dissociation and further reaction can be seen by the line at 396.5 and 398 eV.
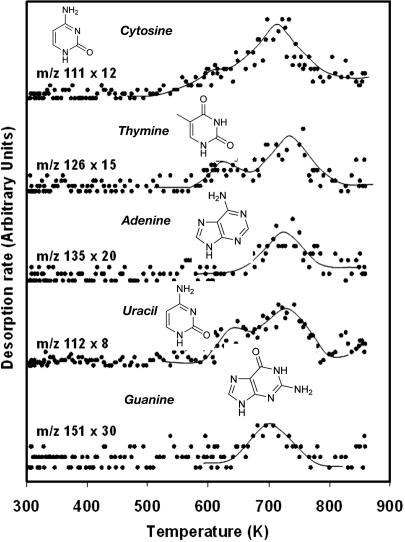
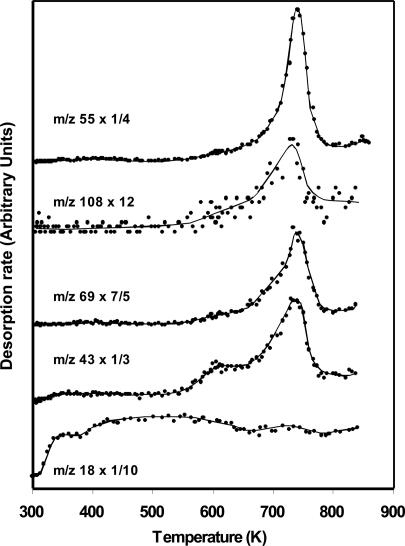
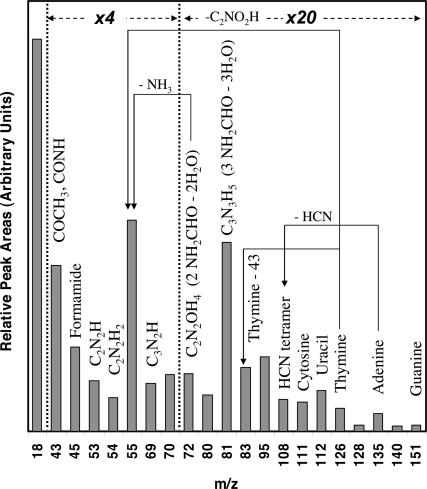
When the adsorption of formamide on the TiO2 (011) surface is subjected to UV irradiation for 15 min, the resulting temperature-programmed desorption (TPD) shows evidence of considerable masses above m/z 45 (the molecular weight of a formamide molecule is 45). In Figs. 3, 4, 5 and Tables 2 and 3, we are presenting arguments that the observed masses by mass spectrometry in the gas phase and the observed lines due to C(1s) and N(1s) on the surface by high-resolution XPS are complementary and give evidence that high-molecular-weight compounds are formed from formamide on the surfaces of TiO2 single crystal in ultra-high vacuum conditions. The first and most important observation is that masses above the molecular weight of NH2CO are seen in the gas phase in the presence of UV light and are not seen in its absence. Many products are also noticed in this experiment, the largest of which are summarized in Fig. 5 (in Fig. 5 and starting from the highest observed mass, attributed to guanine one can in a step-by-step manner make for the contributions of the other compounds of lower masses). Although it is not possible, given the nature of our experiment and the complexity of the desorption products, to unambiguously identify the products of these masses we give in the following the method used to attribute some of these high-molecular-weight compounds to nucleoside basis and their fragments. The high desorption of m/z 55 and 81 is probably due to condensation of two and three molecules of formamide, respectively. The presence of the masses above m/z 80 is a clear indication that organic compounds containing the heteroatoms N and O are formed; these compounds are best attributed to nucleoside bases as follows (see Table 1 for additional information). The attribution of m/z 135 to adenine is in accord with other findings related to the liquid phase reaction of formamide on titanium dioxide in solution chemistry (9). The highest mass observed in this work is m/z 151, and together with the presence of large amounts of m/z 43 is a strong argument for the presence of guanine. The presence of m/z 112 and 69 and the fact that most fragments from higher compounds containing C, N, and O give odd numbers suggest that uracil has been formed. As seen in Table 3, neither guanine nor adenine nor uracil give m/z 111, which suggests the presence of cytosine. The thymine attribution is not without ambiguity because several isomers of thymine may give m/z 126. The isomers of thymine are 6-methyluracil, 3-methyluracil, and 1-methyluracil. The 6-methyluracyl and 3-methyluracil give a large signal of m/z 68, a mass that was not observed during the experiment.
Fig. 3.
TPD after formamide adsorption at 300 K over TiO2 (001) surface and 15-min UV irradiation at 10–9 torr.
Fig. 4.
The same TPD as in Fig. 3 showing the smaller masses attributed to other fragments of nucleotides as detailed in the text.
Fig. 5.
Uncorrected peak areas of desorbing products from Figs. 3 and 4 and others not shown in the figures.
Table 2.
Relative peak intensity of the XPS C(1s) lines at the given binding energies for A, C, G, T, U powders from ref. 16 and for the corresponding XPS C(1s) observed from formamide on TiO2 (001) surface
Table 3.
XPS C(1s)/N(1s) for A, C, G, T, and U from ref. 16 and from formamide at 84 K (condensed phase) and higher temperatures
| A* | C* | G* | T* | T† | U* | 84 K‡ | 300 K‡ | 450 K‡ | 600 K‡ | 700 K‡ |
|---|---|---|---|---|---|---|---|---|---|---|
| 1.1 | 1.6 | 1.1 | 2.8 | 2.4 | 2.1 | 1.1 | 1.2 | 1.1 | 1.6 | 1.5 |
| 1.0§ | 1.33§ | 1.0§ | 2.5§ | 2.5 | 2§ | 1.0§ |
Shown are the expected theoretical ratios from the chemical formulae.
From ref. 16.
Calculated from a fresh thymine sample analyzed using a Phi XPS double-pass CMA machine. Correction factors were as follows: C, 0.296; O, 0.711; and N, 0.477 [from Phi Handbook (22)].
From Fig. 2.
Theoretical ratios.
Table 1. Mass spectrometer fragmentation pattern of nucleoside bases and formamide with their computed correction factor.
| m/z | G | A | T | U | C | F |
|---|---|---|---|---|---|---|
| 151 | 100 | — | — | — | — | — |
| 135 | 5 | 100 | — | — | — | — |
| 126 | — | — | 100 | — | — | — |
| 112 | — | — | — | 100 | — | — |
| 111 | — | — | — | — | 100 | — |
| 110 | 20 | — | — | — | — | — |
| 109 | 20 | — | — | — | — | — |
| 108 | — | 26 | — | — | — | — |
| 83 | — | — | 12 | — | 15 | — |
| 81 | 7 | — | — | — | — | — |
| 69 | 7 | — | — | 65 | 20 | — |
| 55 | — | 80 | — | — | — | |
| 54 | 17 | 11 | — | — | — | — |
| 45 | — | — | — | — | — | 100 |
| 43 | 30 | — | — | — | — | 11 |
| 29 | — | — | — | — | — | 34 |
| 17 | — | — | — | — | — | 32 |
| CF | 4.5 | 3.7 | 3.6 | 3.3 | 2.7 | 1.6 |
Patterns of nucleoside bases are from the National Institute of Standards and Technology. CF, mass spectrometer correction factor based on the parent ion. A, adenine; C, cytosine; G, guanine; T, thymine; U, uracil; F, formamide. Boldface type indicates molecular weight.
An estimate of the reaction yield can be obtained by summing the main raw peak areas of the products attributed to A, C, G, T, U, and HCN tetramer (m/z 108) and multiplying them by their correction factor (Table 1) and by the number of formamide molecules required for their synthesis. These yields together represent 32% of the total desorption of the carbon-containing products.
High-resolution XPS C1s spectra of DNA bases have been analyzed recently (16). This has allowed us to assign the nature of the adsorbed species. In Table 2, we compare the data of A, C, G, T, and U with those obtained in Fig. 2 from formamide. In Table 3, we report the C to N ratios at different reaction temperatures. Based on this, we have found that the surface is richer in A and G and poorer in T, C, and U. It is interesting to note that the distribution of gas-phase species (Fig. 5) is the opposite.
Estimation of the number of molecules converted can be obtained by combining XPS and TPD results. From the attenuation of the Ti2p3/2 high-resolution XPS peak the surface coverage is found close to one, with respect to Ti atoms (see Fig. 7, which is published as supporting information on the PNAS web site). This high coverage is possible because of the small size of formamide and its preferential adsorption via the oxygen lone pair. The number of high-molecular-weight compounds that have desorbed during TPD is found = 1.3 × 10¹⁴ per cm2 of TiO2. Approximately 2/3 of the initial coverage remains on the surface, even after heating to high temperatures; some of it is likely in polymeric form that gives nucleoside bases upon heating. The most interesting part of the reaction is probably the one that is still on the surface.
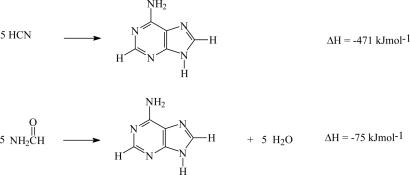
A mechanism involving formamide, HCN, and NH3 in solution for the synthesis of purines has been reported by others (9). HCN molecules can form a polymer-like structure that is not well characterized but yields nucleoside bases (17, 18) and some amino acids (19) upon hydrolysis. It is striking to know that five molecules of HCN (or formamide less water) give one molecule of adenine (Scheme 1).
Scheme 1.
Condensation of five molecules of HCN (or formamide) to one molecule of adenine (or five molecules of adenine and five molecules of water).
Based on XPS data (Fig. 2), it is highly likely that a polymeric form of a compound containing C, N, and O atoms is present on the surface of TiO2 and that transformation to nucleoside bases upon UV irradiation followed by TPD occurs. Our work suggests that the role of UV is to decompose some of the polymer-like structure formed on the surface of TiO2 from formamide, for example by generating OH radicals; it also may activate formamide molecules that can act as electron traps. OH radicals are formed after reaction of surface OH groups with holes. Surface OH groups are in their turn formed from H2O dissociation onto Ti–O centers as shown in Scheme 2.
Scheme 2.
Photoreaction of formamide on the surface of the semiconductor titanium dioxide. VB, valence band; CB, conduction band; open circle, hole; filled circle, electron.
In summary, the observation of the high-molecular-weight compounds from formamide, where some are attributed to nucleoside bases, on TiO2 single crystal surfaces at ultra-high vacuum and under soft UV is direct proof of the mineral role in making compounds of biological significance on earth and/or anywhere in the galaxies.
Methods
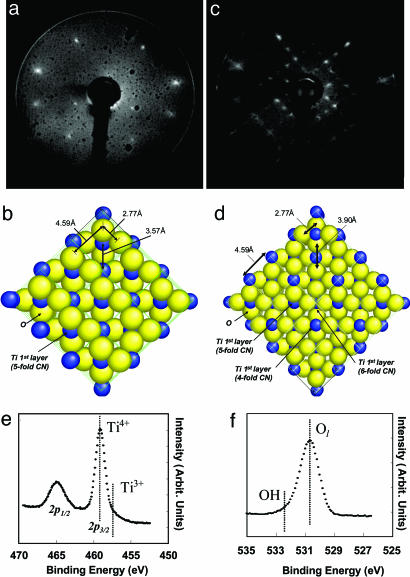
The work was conducted on the surface of a TiO2 (001) single crystal. Upon annealing at 750 K the (001) surface reconstructs to a more stable (011) surface, where Ti atoms are fivefold coordinated and O atoms are twofold coordinated; so that both can accommodate surface adsorbates. This surface is the most active single crystal titanium oxide known to date for carbon–carbon bond formation reactions (20). In addition, Ti and O atoms are arranged in an open configuration (Fig. 6b), which gives a near optimum two-dimensional configuration (minimum restriction) for the adsorbates to further react together. At higher temperature, the surface reconstructs to another structure, a (114) faceted surface. We have previously shown that both surfaces are active for photoreactions, and although they give different reaction yields, they do not show a qualitative difference (21). The surface was cleaned by successive Ar-ion sputtering and annealing at 750 K. The surface reaction was monitored by the TPD technique, using an online quadrupole mass spectrometer capable of monitoring up to 530 atomic mass units. Illumination of the surface was conducted with a UV light from a filtered 100-W Hg lamp giving one intense line at 3.2 eV for a period of 15–45 min (the flux of the UV light is close to 1015 photons cm–2·s–1). With reference to the work of Bernstein et al. (10), we have estimated that 15 min at these conditions corresponds to ≈100 years of an interstellar dose at the edge of a dense cloud. The UV source was placed at ≈50 cm from the crystal; at which distance no IR filtering was required. The mass spectrometer fragmentation pattern of formamide and the different nucleoside bases as well as their correction factors with respect to the parent ion are shown in Table 1. The following mass spectrometer sensitivity factors were calculated from these fragments: formamide (m/z 45), 1.6; cytosine (m/z 111), 2.7; uracil, (m/z 112): 3.3; thymine (m/z 126), 3.6; adenine (m/z 135), 3.7; and guanine (m/z 151), 4.5. Surface species were monitored by using the high-resolution x-ray Photoelectron Spectroscopic facility of the U12A beamline of the National Synchrotron Light Source at Brookhaven National Laboratory (Upton, NY).
Fig. 6.
The surface structures of TiO2 (001) single crystal. (a) Low-energy electron diffraction (LEED) pattern (79 eV) of the (011) faceted surface. (b) Ball model for the (011) surface. Blue balls, fivefold Ti atoms; yellow balls, twofold O atoms. (c) LEED pattern (89 eV) of the (114) faceted surface. (d) Ball model for the (114) faceted surface. Blue ball, six-, five-, and fourfold Ti atoms; yellow balls, twofold O atoms. (e) Ti (2p) of the (011)-faceted surface, showing the presence of oxidation state (+4) and negligible amounts of Ti3+. (f) O(1s) of the (011) faceted surface.
Supplementary Material
Acknowledgments
We thank Prof. P. W. Boyd for numerous discussions. Research was carried out (in whole or in part) at the National Synchrotron Light Source, Brookhaven National Laboratory (Upton, NY), which is supported by the U.S. Department of Energy Division of Materials Sciences and Division of Chemical Sciences Contract DE-AC02-98CH10886.
Author contributions: H.I. designed research; S.D.S. and H.I. performed research; S.D.S. and H.I. analyzed data; and H.I. wrote the paper.
Conflict of interest statement: No conflicts declared.
This paper was submitted directly (Track II) to the PNAS office.
Abbreviations: TPD, temperature-programmed desorption; XPS, x-ray photoelectron spectroscopy.
References
- 1.Oparin, A. I. (1938) The Origin of Life (McMillan, New York).
- 2.Haldane, J. B. S. (1954) New Biol. 16, 12–16. [Google Scholar]
- 3.Bernal, J. D. (1951) The Physical Basis of Life (Routledge and Kegan Paul, London).
- 4.Cairns-Smith, A. B. (1982) Genetic Takeover and the Mineral Origins of Life (Cambridge Univ. Press, Cambridge, U.K.).
- 5.Acevedo, O. L. & Orgel, L. E. (1986) Nature 321, 790–792. [DOI] [PubMed] [Google Scholar]
- 6.Ferris, J. P., Hill, A. R., Liu, R. & Orgel, L. E. (1996) Nature 381, 59–61. [DOI] [PubMed] [Google Scholar]
- 7.Ferris, J. P. (1993) Origins Life Evol. Biosphere 23, 307–315. [DOI] [PubMed] [Google Scholar]
- 8.Huber, C. & Wächterhäuser, G. (1998) Science 281, 670–672. [DOI] [PubMed] [Google Scholar]
- 9.Saladino, R., Cresti, C., Costanzo, G. & DiMauro, E. (2004) Curr. Org. Chem. 8, 1425–1443. [Google Scholar]
- 10.Bernstein, M. P., Dworkin, J. P., Sandford, S. A., Cooper, G. W. & Allamandola, L. J. (2002) Nature 416, 401–403. [DOI] [PubMed] [Google Scholar]
- 11.Caro, G. M. M., Meirerhenrich, U. J., Schutte, W. A., Barbier, B., Segovia, A. A., Resenbauer, H., Thiemann, W. H.-P., Brack, A. & Greenberg, J. M. (2002) Nature 416, 403–406. [DOI] [PubMed] [Google Scholar]
- 12.Idriss, H., Miller, A. & Seebauer, E. G. (1997) Catal. Today 33, 215–225. [Google Scholar]
- 13.Idriss, H., Pierce, K. S. & Barteau, M. A. (1994) J. Am. Chem. Soc. 116, 3063–3074. [Google Scholar]
- 14.Idriss, H., Pierce, K. S. & Barteau, M. A. (1993) J. Catal. 139, 119–133. [Google Scholar]
- 15.Irvine, W. M. (1998) Origins Life Evol. Biosphere 28, 365–383. [DOI] [PubMed] [Google Scholar]
- 16.May, C. J., Canavan, H. E. & Castner, D. G. (2004) Anal. Chem. 76, 1114–1122. [DOI] [PubMed] [Google Scholar]
- 17.Oró, J. & Kimball, A. P. (1961) Arch. Biochem. Biophys. 94, 217–227. [DOI] [PubMed] [Google Scholar]
- 18.Oró, J., Miller, S. L. & Lazcano, A. (1990) Annu. Rev. Earth Planet. Sci. 18, 317–356. [DOI] [PMC free article] [PubMed] [Google Scholar]
- 19.Ferris, J. P., Donner, D. B. & Lotz, W. (1972) J. Am. Chem. Soc. 94, 6968–6974. [DOI] [PubMed] [Google Scholar]
- 20.Idriss, H. & Barteau, M. A. (2000) Adv. Catal. 45, 261–331. [Google Scholar]
- 21.Wilson, J. N. & Idriss, H. (2002) J. Am. Chem. Soc. 124, 11284–11285. [DOI] [PubMed] [Google Scholar]
- 22.Moulder, J. F., Stickle, W. F., Sobol, P. E., Bomben, K. D. (1992) in Handbook of X-Ray Photoelectron Spectroscopy, ed. Chastain, J. (PerkinElmer Corp., Eden Prairie, MN).
Associated Data
This section collects any data citations, data availability statements, or supplementary materials included in this article.


