

Abstract
Genetically primed adult C57BL mice were deleted of exon 5 of the gene encoding the transcription factor PU.1 by IFN activation of Cre recombinase. After a 13-week delay, conditionally deleted (PU.1-/-) mice began dying of myeloid leukemia, and 95% of the mice surviving from early postinduction death developed transplantable myeloid leukemia whose cells were deleted of PU.1 and uniformly Gr-1 positive. The leukemic cells formed autonomous colonies in semisolid culture with varying clonal efficiency, but colony formation was enhanced by IL-3 and sometimes by granulocyte-macrophage colony-stimulating factor. Nine of 13 tumors analyzed had developed a capacity for autocrine IL-3 or granulocyte-macrophage colony-stimulating factor production, and there was evidence of rearrangement of the IL-3 gene. Acquisition of autocrine growth-factor production and autonomous growth appeared to be major events in the transformation of conditionally deleted PU.1-/- cells to fully developed myeloid leukemic populations.
Keywords: mouse, transplantation, growth-factor production
Disruption of the balance between cellular proliferation, differentiation, and maturation is the hallmark of the leukemic process. Characterization of a variety of leukemia models has led to a two-hit model of myeloid leukemogenesis (reviewed in refs. 1 and 2). One hit appears to select for mutations that perturb self-renewal or differentiation of early progenitors, whereas a second class of mutations confer an autonomous proliferative or survival advantage.
PU.1 is a hematopoietic-specific Ets-family transcription factor that is essential for fetal lymphoid and myeloid development where it regulates a large number of target genes, including those for many cytokine receptors (reviewed in ref. 3). Germ-line inactivation of PU.1 results in fetal or early neonatal lethality (4-6). The consequently limited studies on hematopoietic populations in such mice have resulted in conflicting reports that include a failure in development of B-lymphocytes (4), or their aberrant differentiation (5), defects in long-term repopulating activity (7-9), and erythroid progenitor self-renewal (6, 10). Granulocyte formation was reported to be absent or to exhibit maturation arrest (5, 11, 12).
Mice with a targeted deletion of a regulatory enhancer of the PU.1 gene (Sfpi1), where PU.1 expression was reduced by 80%, were noted to develop acute myeloid leukemia (AML) with high frequency (13). Such mice had expanded numbers of immature granulocytic cells and an absence of M-CSFR and GM-CSFRα expression, but normal levels of another PU.1 target, Mac-1. PU.1 was independently implicated in murine irradiation-induced myeloid leukemia (14). In such leukemias, there is a consistent deletion of the region on one chromosome 2, encompassing the PU.1 gene, accompanied by a mutation in the PU.1 DNA-binding domain on the other allele (14). In contrast, the role of PU.1 in human AML remains uncertain because an initial study reported a low frequency of heterozygous PU.1 mutations in AML patients (15), but subsequent studies failed to find mutations (16-18). In all situations reported to date where loss of PU.1 allowed leukemia development, some residual PU.1 protein remained, leading to the speculation that reduced, but not absent, PU.1 might be required for leukemogenesis (19).
We have developed a high-efficiency system in which to examine the function of PU.1 in adult hematopoiesis using conditional gene targeting (20, 21). This system uses the MxCre transgene (22), where Cre recombinase is induced in response to polyinosinic acid/polycytidylic acid (poly IC) injections in vivo to conditionally delete the DNA-binding Ets domain (exon 5) of PU.1. These mice display grossly perturbed hematopoiesis including impaired lymphocyte production and loss of responsiveness of granulocyte-macrophage populations to granulocyte-macrophage colony-stimulating factor (GM-CSF), macrophage (M)-CSF, and IL-6 (21). Despite this, an accumulation of granulocytic populations develops in the bone marrow and spleen, and the clonogenic cells in these populations remain fully dependent on cytokine stimulation for proliferation in vitro (21).
In the present study, we have monitored PU.1-deficient adult mice for the development of myeloid leukemia. In contrast to expectations from the literature (19), myeloid leukemia developed in virtually all mice lacking functional PU.1. These leukemic cells were fully transplantable, exhibited some autonomous growth in vitro, and in a high proportion of cases had acquired growth-factor independence by acquiring the autocrine ability to produce a relevant growth factor, most often IL-3.
Results
As shown in Fig. 1A, mice in which PU.1 had been deleted by the injection of poly IC suffered a 30% mortality in the first 4 weeks after induction. No deaths occurred of control mice injected with poly IC. The injection of poly IC produced in both types of mouse an initial response of moderate spleen enlargement with an increased spleen content of granulocyte-macrophage progenitor cells. This resembled the response to injected endotoxin and decreased in magnitude after the first 2 weeks. The early deaths in PU.1-/- mice were not further investigated.
Fig. 1.

Development of myeloid leukemia in PU.1-/- mice. (A) Survival of PU.1-/- and PU.1+/+ mice after the injection of poly IC. (B) Development of leukemia in PU.1-/- but not PU.1+/+ mice.
From 4 to 13 weeks after the induced deletion of PU.1, the mice remained healthy and, as has been described (21), developed a postinductive and preleukemic state in which spleen enlargement was present and the dominant cellular population in the marrow and spleen was composed of maturing granulocytic cells. The spleen and marrow were found to contain a large population of clonogenic cells forming small colonies (see Fig. 3D) composed of granulocytic cells with evident, but not entirely normal, maturation. PCR genotyping of these colonies confirmed that they were exclusively of PU.1-/- genotype. The formation of these granulocytic colonies was absolutely dependent on cytokine stimulation by granulocyte colony-stimulating factor (G-CSF) or IL-3, and essentially no colonies developed in response to stimulation by GM-CSF or M-CSF (21).
Fig. 3.
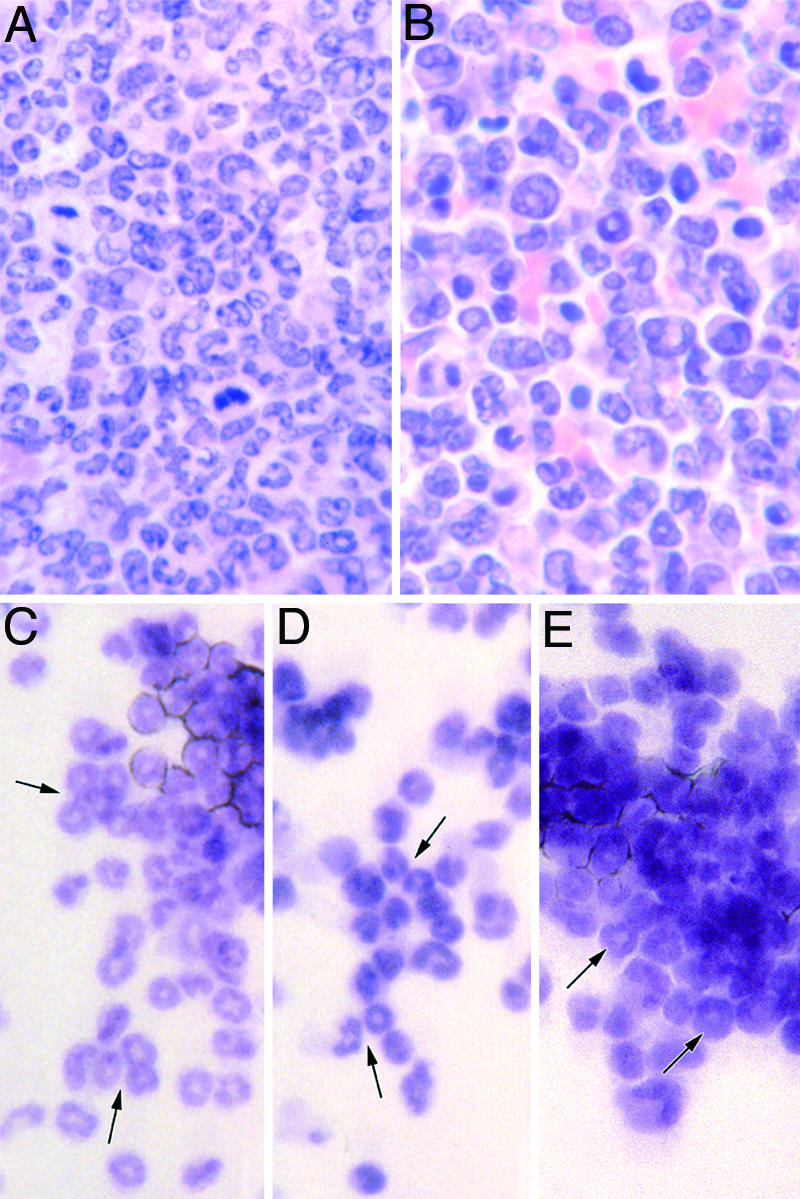
Morphology of myeloid leukemic cells and colonies grown from them. (A) Bone marrow from a PU.1-/- mouse with myeloid leukemia. (B) Spleen from the same animal as A. (C) Granulocytic colony formed by normal marrow cells after stimulation by 10 ng/ml G-CSF. (D) Granulocytic colony formed by postinduction PU.1-/- marrow cells after stimulation by 10 ng/ml G-CSF. (E) Autonomous granulocytic colony formed by unstimulated myeloid leukemic cells. Arrows indicate maturing granulocytic cells.
Beginning 13 weeks after PU.1 inactivation, individual PU.1-/- mice became clinically ill (Fig. 1 A) usually with palpable spleen enlargement. As shown in Fig. 1B, this disease developed in 95% of the animals that had survived the initial postinduction phase. The only mouse failing to develop leukemia was killed 35 weeks after induction because of overgrown teeth. Although the disease was strikingly uniform in presentation and in each case was proved to be myeloid leukemia, the disease developed incrementally over a variable and relatively long interval of 13-34 weeks after induction. In striking contrast, no deaths or illness were observed in the control poly IC-injected mice examined during this interval.
Typically, the clinically ill PU.1-/- mice were leukopenic with subnormal numbers of neutrophils (110 ± 290 per μl versus 740 ± 360 per μl in control mice), few or no immature granulocytic cells and only a variable presence of small numbers of blast cells in the peripheral blood. The mice showed a moderate level of anemia (hematocrit 35 ± 2% versus 44 ± 2% in control mice) and thrombocytopenia (566 ± 284 × 103 per μl versus 1,050 ± 157 × 103 per μl in control mice) (see Table 1, which is published as supporting information on the PNAS web site). The most uniform and striking features of these mice at autopsy were the gross (10-fold) enlargement of the spleen and a doubling in size of the liver (Fig. 2A). A common feature was difficulty in obtaining bone marrow cells from these animals with total femur cell counts only 33% of normal being recovered. Cytological analyses showed that ≈50% of the cells in the marrow and spleen were blast cells and 20-25% were promyelocytes (Fig. 2B). Levels of mature neutrophils, lymphocytes, and nucleated erythroid cells were subnormal. In contrast, the peritoneal population exhibited no abnormalities in cell numbers or composition. On analysis, the marrow and spleen populations of these mice were uniformly PU.1-/-.
Fig. 2.

Myeloid leukemia in a PU.1-/- mouse. (A)(Left) PU.1-/- mouse with myeloid leukemia. Note enlarged liver (large arrow) and spleen (small arrow). (Right) Control PU.1+/+ mouse. (B) Three fields of cytocentrifuged bone marrow cells from a mouse with myeloid leukemia; bl, blast cells; promyel, promyelocytes; myel, myelocytes. (C) FACS analysis of bone marrow and spleen cells from a PU.1-/- mouse with myeloid leukemia compared with cells from a control PU.1+/+ mouse.
The cytological diagnosis of myeloid leukemia was confirmed by FACS analysis, which showed that the leukemic spleen and marrow populations were Gr-1+ Ly6C+ cKit+, similar to early myeloid cells, but lacked expression of the PU.1 target gene Mac-1 (Fig. 2C).
Histologically, the spleen and marrow were filled with a uniform population of immature granulocytic cells (Fig. 3 A and B). In a number of animals the infiltrating cells were so uniformly undifferentiated that it was difficult to make a positive diagnosis of myeloid leukemia. In these cases, the uniform Gr-1 positivity of the cells and their behavior in culture were helpful in making a diagnosis. In some spleens, remnants of lymphoid follicles survived in the dense mass of surrounding granulocytic cells. A curious appearance was commonly observed in the marrow where a whole sternal segment or isolated region in long bone marrow contained only necrotic cells or merely contained a few surviving stromal cells. This mass death of cells in localized bone regions has been observed in other situations where the marrow is overfilled with granulocytic cells. The liver in all mice was heavily infiltrated by leukemic cells, and in some mice, few hepatic cells survived.
Involvement of lymph nodes was highly variable; some appeared to be uninvolved, whereas others were enlarged by leukemic tissue expanding from the hilar regions. The kidney was often infiltrated but usually by only small numbers of leukemic cells. In contrast, the lungs were strikingly free of major collections of infiltrating leukemic cells but did contain additional granulocytic cells in the alveolar walls. It was notable that skeletal muscle, pancreas, gut, bladder, heart, thymus, brain, and skin never showed obvious leukemic infiltration.
In two animals, two distinct leukemias were present: myeloid leukemia present in the bone marrow, spleen, and liver and a lymphoid leukemia involving the thymus. The latter tumors were recognized only in histological sections and were not able to be typed. However, the presence of thymic tumors suggests that they were tumors of T lymphocytes.
Examination of the control mice killed in parallel with the sick PU.1-/- mice showed no histological abnormalities.
Transplanted Leukemias. Of 13 primary leukemias tested, all were readily transplantable to unirradiated syngeneic C57BL mice, producing clinical illness and either a local s.c. tumor or gross spleen enlargement within 3.5-9 weeks of transplantation. On histological examination, the transplanted leukemias exhibited the same cytological and histological characteristics as the primary leukemic mice with the transplanted leukemic cells again usually replacing or enlarging bone marrow and spleen populations and massively infiltrating the liver. All transplanted leukemic populations analyzed were PU.1-/- and, by FACS analysis, were Gr-1+ and negative for T, B, or erythroid markers.
Some leukemias were sequentially transplanted for four passages but did not alter their cytology, surface phenotype, or pattern of involvement of recipient organs.
Behavior of Leukemic Cells in Semisolid Cultures. Culture of spleen or marrow cells from primary leukemic mice produced highly variable results. Apparently healthy cells from some animals failed to grow in vitro with any stimulus. In other cases, small, usually tight, colonies developed in relatively small numbers, whereas in cultures from other mice, very large numbers of colonies developed that were again relatively small in size and compact in nature. A typical leukemic colony is shown in Fig. 3E. In contrast to a typical normal colony stimulated by granulocyte colony-stimulating factor (G-CSF), or even a typical G-CSF-stimulated colony from a postinduction but preleukemic mouse (Fig. 3 C and D), many of the cells in the leukemic colonies were immature, but in each colony there were usually small numbers of cells with typical ring-shaped nuclei indicating the granulocytic nature of the colonies. The leukemic nature of these colonies was confirmed by the growth of similar colonies from transplanted leukemic tumor tissue. In some mice in which a GFP expression cassette had also been inserted in the PU.1 locus (20), FACS analysis of the transplanted tumor tissue showed that the tumor cells were GFP+. Furthermore, FACS-sorted GFP+ cells from transplanted leukemic tissue produced typical colonies on culture in vitro, whereas GFP- cells in the same population did not proliferate clonally in vitro.
In all cases, where leukemic colonies did develop in vitro, some colony formation occurred in unstimulated cultures. This autonomy was formally tested by culturing varying numbers of cells from primary or transplanted leukemic tissue in unstimulated cultures. As shown in the examples in Fig. 4A, strict linearity was observed between cultured cell numbers and the numbers of colonies developing in unstimulated cultures, indicating the autonomy of the clonogenic cells.
Fig. 4.

Colony formation in vitro by PU.1-/- leukemic cells. (A) Linearity of spontaneous colony formation by cells from three mice with myeloid leukemia. (B) Colony formation by 10,000 cells from 12 mice with myeloid leukemia. Note the variable frequency of colony-forming cells and the examples where IL-3 or GM-CSF stimulated the formation of increased numbers of colonies. All stimuli were used at a final concentration of 10 ng/ml. (C) Colony formation by recloned leukemic colony cells in cultures stimulated by 10 ng/ml IL-3. Note the progressive decline in the generation of clonogenic cells on serial passage. Each point represents data from a single colony.
Despite the autonomous nature of colony formation by some PU.1-/- leukemic cells, the addition of certain cytokines to the cultures often increased the number and/or size of the colonies developing (Fig. 4B). For 9 of the 12 examples shown in Fig. 4, IL-3 was the most consistent stimulus increasing colony numbers and size, the cells retaining the same characteristics as in unstimulated colonies. Strikingly, some leukemic populations also responded strongly to stimulation by GM-CSF, a characteristic that set the leukemic cells apart from the absolute unresponsiveness to GM-CSF of the postinduction (preleukemic) marrow and spleen populations.
Occasional leukemic populations were stimulated by G-CSF, but none were stimulated by M-CSF. In cultures stimulated by the mixture of stem cell factor plus IL-3 plus erythropoietin, which is the maximal stimulus for megakaryocyte colony formation by normal cells, no megakaryocyte-containing colonies developed but the leukemic colonies tended to develop in reduced numbers and to be composed of loosely dispersed aggregates of cells with a macrophage morphology. The addition of Flk-ligand, IL-6, oncostatin M, leukemia inhibitory factor, IL-11, IL-1, or IL-2 failed to influence colony numbers or size.
To investigate the possible capacity of the clonogenic leukemic cells for self-generation, individual colonies from cultures showing good colony formation in IL-3-stimulated or unstimulated cultures were picked from the cultures and the colony cells resuspended then cultured either in unstimulated or IL-3-stimulated cultures. As shown in Fig. 4C, individual colonies did contain many cells capable of forming colonies on recloning in secondary cultures. However, the colonies generated tended to be smaller than those in the primary cultures. On repetition of the reculture procedure, the numbers and size of colonies generated declined sharply and by the fourth recloning, no colonies were generated. The results indicated that the original clonogenic leukemic cells had a considerable capacity for proliferation but no capacity for genuine self-generation and were unlikely to be stem cells of the leukemic population.
Autocrine Production of IL-3. The most obvious difference between leukemic and postinduction clonogenic cells was the capacity exhibited by at least some of the leukemic cells to proliferate in cultures without any added growth factor.
Media conditioned by transplanted tumors or leukemic spleen or marrow populations were assayed for growth factors, the most likely of which were IL-3 and GM-CSF because the leukemic clonogenic cells appeared to be responsive to stimulation by these factors. As shown by the examples in Fig. 5A, 8 of 12 leukemias tested were found to produce IL-3 as detected by using IL-3-dependent BaF3 cell lines and confirmed by neutralization using IL-3 antibodies (Fig. 5A). One leukemia produced detectable GM-CSF, and one produced both IL-3 and GM-CSF.
Fig. 5.

Production of IL-3 or GM-CSF by myeloid leukemic cells. (A) Stimulation by leukemic cell-conditioned media (C.M) of proliferation of IL-3-dependent BaF3 cells and the neutralization of this activity by a specific anti-IL-3 monoclonal antibody. (B)(Upper) Detection of transcription of IL-3 or GM-CSF by myeloid leukemic cells using RT-PCR. (Lower) Southern analysis using EcoR1 to document monoallelic rearrangement of the IL-3 gene. wt, wild type.
The detection of autocrine IL-3 and GM-CSF production by PU.1-/- leukemic cells was confirmed by RT-PCR analysis and, at least for IL-3, most likely resulted from monoallelic rearrangement of the gene as detected by Southern blotting (Fig. 5B).
Discussion
The present studies have confirmed and extended reports that reduction of PU.1 leads to the development of myeloid leukemia (13, 14). It has been speculated that myeloid leukemia development might require a reduction, rather than a deletion of PU.1 (19). However, if removal of exon 5 results in complete functional deletion of PU.1, the present experiments would indicate that myeloid leukemia develops with high frequency in the absence of PU.1. The high frequency and relatively short period elapsing to leukemia development make the PU.1 deletion mouse a convenient and valuable model for further studies on myeloid leukemia.
Previous studies have indicated that leukemia development requires cells to acquire two major abnormalities: an aberrant capacity for self-renewal and a capacity for autonomous growth stimulation (1, 2). The primary role of loss of PU.1 in the development of this disease would seem to be to cause a perturbation of regulatory transcription factors leading to abnormal lineage commitment and enhanced generation of granulocytic precursors. As has been described (21), this leads to a progressive accumulation of a somewhat abnormal, but not autonomous, granulocytic population with abnormally large numbers of granulocyte progenitor cells. This appears to be the early consequence of loss of PU.1 and is accompanied by a failure to express receptors for growth factors such as GM-CSF and M-CSF (13, 21). This PU.1-/- population achieves a limited dominance over preexisting hematopoietic cells of other lineages in the bone marrow and spleen (21).
The subsequent development of leukemia occurs after a variable and longer interval, more suggestive of a random event. The autonomous nature of the clonogenic leukemic cells suggests that the delayed leukemic transformation event is the acquisition of growth autonomy by further mutations. However, the considerable heterogeneity between the leukemic populations suggests that this autonomy may have been acquired by more than one mechanism. Although, in the present study, autocrine IL-3 production was demonstrated for a majority of the leukemic populations and rearrangement of an IL-3 allele was documented, other autonomy-inducing mechanisms, such as myc overexpression (13), may have been operating in other leukemic mice. Furthermore, the leukemic populations may have undergone additional mutations leading to the heterogeneity of individual populations and the often low frequency of clonogenic cells. In previous leukemia models, acquired autocrine production of IL-3 by leukemic cells was shown to be due to insertion of intracisternal A-particles upstream of one allele of the gene (22).
The myeloid leukemias in PU.1-/- mice exhibited a major block in maturation with most members of the population being blast or at most promyelocytic cells, although, in culture, it was possible to observe some further maturation to postmitotic neutrophils and the combination of SCF, IL-3, and EPO appeared able to induce some maturation to macrophage lineage cells. Many of the clonogenic PU.1-/- leukemic cells monitored in culture exhibited autonomous proliferation, but the cells were responsive to growth stimulation by IL-3 and on occasion by GM-CSF. The linearity of unstimulated leukemic colony formation by IL-3-producing cells might appear counterintuitive but has been noted previously in the behavior of cells known to have been transformed by insertion of a CSF gene (23). The responsiveness to GM-CSF was quite striking with some leukemias and would presumably have required reexpression of the α-chain of the GM-CSF receptor to reverse the loss occurring after the initial deletion of PU.1 (21).
The failure of clonogenic cells to exhibit a convincing capacity for self-generation indicates that the stem cells in the leukemic population, clearly demonstrable by sequential transplantation, were not detectable by colony formation in agar culture. As a consequence, nothing can be concluded about their growth factor requirements or possible responsiveness to maturation induction by various cytokines. In this, these mouse leukemias resemble the behavior of human chronic myeloid leukemic (CML) populations in vitro that are readily demonstrable to contain factor-dependent clonogenic cells but whose stem cells are not detectable in clonal cultures (24, 25). Other studies have produced evidence of a transient capacity of the CML stem cells for autocrine growth stimulation by the production of IL-3 (26).
Materials and Methods
Production of PU.1-/- Mice. The methods for conditionally deleting PU.1 using the IFN-responsive MxCre transgene have been described (20, 21). Excision of the PU.1 gene in hematopoietic cells was achieved with high efficiency by injecting PU.1f1/f1 MxCre+ mice i.p. twice with 12.5 μg/g poly IC, the injections being separated by a 3-day interval. Control mice (PU.1f1/f1 MxCre-) were given similar injections of poly IC. (Conditionally deleted mice are referred to in the text as PU.1-/- mice and control mice as PU.1+/+ mice.)
Study Design. All studies were approved by the Animal Ethics Committee of The Walter and Eliza Hall Institute. Groups of poly IC-induced experimental and control mice were monitored daily for the development of clinical illness or spleen enlargement. At this time, the deleted mouse was killed for analysis, together with a matching poly IC-injected control mouse.
Observations performed on each mouse were: white cell and platelet counts and hematocrit estimation on orbital blood, body weight, and the weights of various organs (brain, salivary gland, thymus, heart, lung, spleen, liver, mesenteric node, pancreas, kidney, and gonads). Total cell counts were performed on femur and peritoneal cavity cells. Cytocentrifuge preparations were made of peritoneal, spleen and marrow cells and these were stained with May Grunwald-Giemsa for differential cell counts.
Samples of the spleen, lymph nodes, and bone marrow were subjected to FACS analysis using antibodies, including those to B220, CD3, CD4, CD8, Ter 119, F4/80, Mac 1, Gr-1, and CD45.
All organs were fixed in 10% formol/saline or 4% paraformaldehyde then embedded in paraffin and sectioned at 1-3 μm. These sections were either stained with hematoxylin and eosin or, for paraformaldeyde-fixed tissues, also stained with antibodies to CD3, B220, F4/80, or Gr-1.
Marrow and spleen cells were cultured in 1-ml Petri dish cultures of DMEM with a final concentration of 20% newborn calf serum and 0.3% agar. Cell numbers per culture were 25,000 marrow cells per ml, 25,000 PU.1-/- spleen cells per ml, or 50,000 control spleen cells per ml. Stimuli were added to quadruplicate culture dishes and colony formation was analyzed after 7 days of incubation as described (21).
Transplantation Tests. A total of 107 cells from the enlarged spleen of primary animals were injected s.c. into four syngeneic C57BL mice. These mice were monitored daily for the development of s.c. tumors and/or spleen enlargement. When moribund, the transplanted mice were analyzed as above and further transplants were performed by using either tumor or spleen tissue from the transplanted animals.
Recloning of Leukemic Colonies. Individual 7-day leukemic colonies from cultures containing no added stimlus or 10 ng IL-3 were removed and resuspended in 6 ml of agar medium. After dispersion of the colony cells by pipetting, each cell suspension was recultured in duplicate cultures containing 10 ng of IL-3 or 0.1 ml of saline. After 7 days of incubation, colony counts were performed and, where colonies were present, the recloning procedure was repeated.
FACS Analyses. Analyses of spleen, bone marrow, or s.c. tumors were performed as described (21).
RNA/DNA Analyses. PCR analysis of the PU.1 status of individual tumors or of picked off individual 7-day colonies derived from leukemic cells was performed by using the primers described in ref. 21. RNA analyses were performed as described (21).
Production of Conditioned Medium. A total of 2 × 10⁶ tumor, spleen, or marrow cells per ml were cultured in capped tubes containing 2 ml of DMEM with 10% FCS. After 4 days of incubation at 37°C, the media were harvested and assayed in serial dilutions in microwell cultures of FDC-P1 or BaF3 cells (27). Where conditioned media were detected as containing either GM-CSF (active on FDC-P1 cells alone) or IL-3 (active on both cell lines), identification was verified by the use of neutralizing specific monoclonal antisera (purchased from PeproTech).
Supplementary Material
Acknowledgments
We thank Katya Gray and Silvana Liburdi for technical assistance. This work was supported by National Health and Medical Research Council, Canberra grants, National Institutes of Health Grant CA 22556, and the Cancer Council Victoria.
Author contributions: D.M., A.D., and S.N. designed research; D.M., A.D., S.M., and L.D.R. performed research; D.M., A.D., and S.N. analyzed data; and D.M. and S.N. wrote the paper.
Conflict of interest statement: No conflicts declared.
Abbreviations: G-CSF, granulocyte colony-stimulating factor; GM-CSF, granulocyte-macrophage colony-stimulating factor; M-CSF, macrophage colony-stimulating factor; poly IC, polyinosinic acid/polycytidylic acid.
References
- 1.Metcalf, D. (1997) Leukemia 11, 1599-1604. [DOI] [PubMed] [Google Scholar]
- 2.Tenen, D. G. (2003) Nat. Rev. Cancer 3, 89-101. [DOI] [PubMed] [Google Scholar]
- 3.Lloberas, J., Soler, C. & Celada, A. (1999) Immunol. Today 20, 184-189. [DOI] [PubMed] [Google Scholar]
- 4.Scott, E. W., Simon, M. C., Anastasi, J. & Singh, H. (1994) Science 265, 1573-1577. [DOI] [PubMed] [Google Scholar]
- 5.McKercher, S. R., Torbett, B. E., Anderson, K. L., Henkel, G. W., Vestal, D. J., Baribault, H., Klemsz, M., Feeney, A. J., Wu, G. E., Paige, C. J. & Maki, R. A. (1996) EMBO J. 15, 5647-5658. [PMC free article] [PubMed] [Google Scholar]
- 6.Back, J., Dierich, A., Bronn, C., Kastner, P. & Chan, S. (2004) Blood 103, 3615-3623. [DOI] [PubMed] [Google Scholar]
- 7.Scott, E. W., Fisher, R. C., Olson, M. C., Kehrli, E. W., Simon, M. C. & Singh, H. (1997) Immunity 6, 437-447. [DOI] [PubMed] [Google Scholar]
- 8.Fisher, R. C., Lovelock, J. D. & Scott, E. W. (1999) Blood 94, 1283-1290. [PubMed] [Google Scholar]
- 9.Iwasaki, H., Somoza, C., Shigematsu, H., Duprez, E. A., Iwasaki-Arai, J., Mizuno, S., Arinobu, Y., Geary, K., Zhang, P., Dayaram, T., et al. (2005) Blood 106, 1590-1600. [DOI] [PMC free article] [PubMed] [Google Scholar]
- 10.Fisher, R. C., Slayton, W. B., Chien, C., Guthrie, S. M., Bray, C. & Scott, E. W. (2004) Leuk. Res. 28, 83-89. [DOI] [PubMed] [Google Scholar]
- 11.Anderson, K. L., Smith, K. A., Conners, K., McKercher, S. R., Maki, R. A. & Torbett, B. E. (1998) Blood 91, 3702-3710. [PubMed] [Google Scholar]
- 12.Anderson, K. L., Smith, K. A., Pio, F., Torbett, B. E. & Maki, R. A. (1998) Blood 92, 1576-1585. [PubMed] [Google Scholar]
- 13.Rosenbauer, F., Wagner, K., Kutok, J. L., Iwasaki, H., Le Beau, M. M., Okuno, Y., Akashi, K., Fiering, S. & Tenen, D. G. (2004) Nat. Genet. 36, 624-630. [DOI] [PubMed] [Google Scholar]
- 14.Cook, W. D., McCaw, B. J., Herring, C., John, D. L., Foote, S. J., Nutt, S. L. & Adams, J. M. (2004) Blood 104, 3437-3444. [DOI] [PubMed] [Google Scholar]
- 15.Mueller, B. U., Pabst, T., Osato, M., Asou, N., Johansen, L. M., Minden, M. D., Behre, G., Hiddemann, W., Ito, Y. & Tenen, D. G. (2002) Blood 100, 998-1007. [DOI] [PubMed] [Google Scholar]
- 16.Lamandin, C., Sagot, C., Roumier, C., Lepelley, P., De Botton, S., Cosson, A., Fenaux, P. & Preudhomme, C. (2002) Blood 100, 4680-4681. [DOI] [PubMed] [Google Scholar]
- 17.Dohner, K., Tobis, K., Bischof, T., Hein, S., Schlenk, R. F., Frohling, S. & Dohner, H. (2003) Blood 102, 3850, and author reply (2003) 102, 3850-3851. [DOI] [PubMed] [Google Scholar]
- 18.Vegesna, V., Takeuchi, S., Hofmann, W. K., Ikezoe, T., Tavor, S., Krug, U., Fermin, A. C., Heaney, A., Miller, C. W. & Koeffler, H. P. (2002) Leuk. Res. 26, 451-457. [DOI] [PubMed] [Google Scholar]
- 19.Rosenbauer, F., Koschmieder, S., Steidl, U. & Tenen, D. G. (2005) Blood 106, 1519-1524. [DOI] [PMC free article] [PubMed] [Google Scholar]
- 20.Nutt, S. L., Metcalf, D., D'Amico, A., Polli, M. & Wu, L. (2005) J. Exp. Med. 201, 221-231. [DOI] [PMC free article] [PubMed] [Google Scholar]
- 21.Dakic, A., Metcalf, D., Di Rago, L., Mifsud, S., Wu, L. & Nutt, S. L. (2005) J. Exp. Med. 201, 1487-1502. [DOI] [PMC free article] [PubMed] [Google Scholar]
- 22.Duhrsen, U., Stahl, J. & Gough, N. M. (1990) EMBO J. 9, 1087-1096. [DOI] [PMC free article] [PubMed] [Google Scholar]
- 23.Lang, R. A., Metcalf, D., Gough, N. M., Dunn, A. R. & Gonda, T. J. (1985) Cell 43, 531-542. [DOI] [PubMed] [Google Scholar]
- 24.Moore, M. A. S., Williams, N. & Metcalf, D. (1973) J. Natl. Cancer Inst. 50, 603-623. [DOI] [PubMed] [Google Scholar]
- 25.Metcalf, D. (1984) The Hemopoietic Colony Stimulating Factors (Elsevier, Amsterdam).
- 26.Holyoake, T. L., Jiang, X., Jorgensen, H. E., Graham, S., Alcorn, M. J., Laird, C., Eaves, A. C. & Eaves, C. J. (2001) Blood 97, 720-728. [DOI] [PubMed] [Google Scholar]
- 27.Metcalf, D. Willson, T. A., Hilton, D. J., Di Rago, L. & Mifsud, S. (1995) Leukemia 9, 1556-1564. [PubMed] [Google Scholar]
Associated Data
This section collects any data citations, data availability statements, or supplementary materials included in this article.