Abstract
Data Collection/Extraction Methods
National household survey.
Data Sources/Study Setting
We analyzed data on 12,434 adolescents (10 through 18 years old) included in the 1999 and 2000 editions of the National Health Interview Survey.
Study Design
We assessed the presence of income gradients using four income groups. Outcome variables included health status, health insurance coverage, access to and satisfaction with care, utilization, and unmet health needs.
Principal Findings
After adjustment for confounding variables using multivariate analysis, statistically significant disparities were found between poor adolescents and their counterparts in middle- and higher-income families for three of four health status measures, six of eight measures of access to and satisfaction with care, and for six of nine indicators of access to and use of medical care, dental care, and mental health care.
Conclusion
Our analyses indicate adolescents in low-income families remain at a disadvantage despite expansions of the Medicaid program and the comparatively new State Children's Health Insurance Program (SCHIP). Additional efforts are needed to ensure eligible adolescents are enrolled in these programs. Nonfinancial barriers to care must also be addressed to reduce inequities.
Keywords: Access, adolescents, health insurance, health status, Medicaid, poverty, SCHIP, utilization
The relationship between socioeconomic status (SES) and health status is well documented. Lower socioeconomic status, as measured by income, is associated with worse outcomes on a range of health status measures, including mortality, chronic and acute conditions, and self-rated health (Kitagawa and Hauser 1973; Benson and Marano 1995; Kennedy et al. 1998). Although most research on income disparities and health focuses on adults, some studies assess the influence of SES on children's health, and a few address adolescents specifically (Goodman 1999). Research on adolescent risk-taking behavior indicates that, as family income increases, adolescents are less likely to attempt suicide, smoke cigarettes, engage in episodic heavy drinking and be depressed, obese, or sedentary (Goodman 1999; Lowry et al. 1996). Poor children, including adolescents, fare worse on many measures of health, including mortality, self-reported health, chronic illness, injuries requiring medical attention, impaired growth, and limitation of activity (Montgomery, Kiely, and Pappas 1996; Brooks-Gunn and Duncan 1997; Starfield 1982; Starfield and Budetti 1985).
In the areas of access to and utilization of health care services, past adolescent-specific studies have found higher family income to be associated with a higher likelihood of having a usual source of care, obtaining needed care, receiving any care from a doctor, and being seen in a doctor's office (Ford, Bearman, and Moody 1999; Bartman, Moy, and D'Angelo 1997). Research on children (including some research on adolescents) has found that poor children have worse access to health care on indicators including a physician contact in the past year, having a usual source of primary care and sick care, and having continuity between sources of routine and sick care (St. Peter, Newacheck, and Halfon 1992; Halfon and Newacheck 1993; Wood et al. 1990; Newacheck, Hughes, and Stoddard 1996; Flores et al. 1999; Ford, Bearman, and Moody 1999).
Adolescents undergo significant changes as they transition from childhood to adulthood. For many adolescents, these changes lead to the initiation of risky behaviors that are linked to the major causes of serious morbidity and mortality for this population (Green and Palfrey 2000). These behaviors, their consequences, and the associated utilization of health care services distinguish adolescents from children and adults, warranting a special focus on the role that SES plays in health status and access to and utilization of health care services.
The present study aims to assess the relationship between income and a broad set of health status, access, and utilization indicators. We used the most current nationally representative data available, allowing us to reassess the strength of previous findings in these areas. Unlike many previous studies, where income is conceptualized as a dichotomy (e.g., poor and nonpoor), this study examines incomes expressed as a gradient. The most recent data also include new variables, not previously available, in domains including mental health status and dental health services. These new data permit a more comprehensive assessment of income's relationship to health status and access to and utilization of health care services among adolescents.
Methods
Sample and Population Characteristics
We used data from the 1999 and 2000 National Health Interview Surveys (NHIS) to conduct this study. The NHIS is a continuing nationwide household survey designed to collect information on the demographic characteristics, health status, and health care use patterns of the U.S. civilian noninstitutionalized population. The survey has three modules: a basic module, a periodic module, and a topical model. The basic module contains three components: the family core, the sample adult core, and the sample child core. The family core includes questions administered to all family members; the sample adult and child components include more in-depth questions administered for one adult and one child randomly selected in each family.
Some 6,094 adolescents aged 10 through 18 years old in the 1999 NHIS and 6,340 adolescents in the 2000 NHIS were included in the study. Data for adolescents aged 10 and 17 years old were drawn from the sample child core surveys and data for the 18-year-olds were drawn from sample adult core surveys. A knowledgeable adult (typically a parent) answered questions about health and health services use for adolescents under age 17. When present, 17- and 18-year-olds answered the questions for themselves. The response rate was 78.2 percent for the 1999 sample child core questionnaire and 79.4 percent for the 2000 sample child core. The response rates for the 1999 and 2000 sample adult core questionnaires were 69.6 percent and 72.1 percent respectively (National Center for Health Statistics 1999; National Center for Health Statistics 2000).
Variable Construction
The family core provides information on family income, demographic characteristics, health insurance coverage, and disability status of family members. Sample adult core and child core questionnaires are used to collect more detailed information on physical and mental conditions, access to and use of health services. In 1999 only, 15 periodic questions about access to medical and dental care were added to the sample child and sample adult core questionnaires. These questions included the length of time the respondent has been going to the usual source of care, whether the respondent has a personal health professional, whether the providers have office hours at nights and on weekends, the respondent's rating of the provider and his or her staff, and whether the respondent has seen a dentist or mental health professional in the past year. Thus, our analyses of income disparities in access to care are based on the data from the 1999 survey only. All other analyses used combined data from the 1999 and 2000 surveys.
The family core questionnaire provided information on family income and the ratio of annual family income for the past year to the federal poverty thresholds, which are adjusted for family size. For example, the poverty threshold for a family of four in 1998 was $16,660 (U. S. Census Bureau 1998) and was $17,029 in 1999 (U. S. Census Bureau 1999). In this study, a poverty status index was used to group adolescents into four income categories: below poverty (<100 percent federal poverty level [FPL]), near poor (100–199 percent FPL), moderate income (200–299 percent FPL), and middle/high income (>=300 percent FPL). The nonresponse rate, including missing and unknown responses, for income data was 22.8 percent. Since more than one in five respondents did not report income, we imputed values for those cases. The SOLAS hot deck imputation approach used here is similar to that used by the National Center for Health Statistics and other government agencies to impute missing data (Statistical Solutions 2001).
In the sample child core, questions were asked about children's mental and emotional behaviors such as being unhappy, sad, or depressed, having difficultly concentrating, or not getting along with other children. Four age- and gender-specific questions were asked for each sample child. These questions serve as a global mental health indicator for adolescents. Detailed descriptions about the mental health indicators can be found in the Appendixes of the 1999 and 2000 NHIS data documents (National Center for Health Statistics 1999; National Center for Health Statistics 2000). Additionally, questions were asked about the number of visits to a doctor, dentist, or mental health professional, whether the adolescent had an annual checkup, and whether parents could not afford medical care, dental care, mental health services, or prescription medicine for their adolescent children.
Data Analysis and Presentation
Estimates presented here have been statistically weighted to reflect national population totals. The weights, provided by the data collection agency, are equal to the inverse of the sampling probability for each case, adjusted for nonresponse.
Our results are first presented in graphical form. Each of the health status, access, and utilization indicators is charted across the four income categories (<100 percent FPL, 100–199 percent FPL, 200–299 percent FPL, and >299 percent FPL). As an aid in interpreting the strength of these gradients, we categorized gradients as weak if adolescents in the lowest income group (<100 percent FPL) were from 100 percent to 150 percent more at risk of an adverse outcome as adolescents in the highest income group (>299 percent FPL). We classified a gradient as moderate strength if adolescents in the lowest income group were from 150 percent to 199 percent more at risk of an adverse outcome as adolescents in the highest income group. Finally, we categorized relative risks greater than 200 percent as strong gradients.
We also conducted multivariate analyses to adjust for confounding factors. Logistic and ordinary least squares regression analyses were used to assess whether income gradients in health status, access, and utilization measures remain after adjustment for health insurance, race/ethnicity, family size, child's age and sex, place of residence, and population density. These variables were selected based on the behavioral model developed by Andersen and Aday and others (Andersen and Aday 1978; Andersen 1995). Estimates, standard errors, and test statistics were derived using SUDAAN software that takes into account the complex sample design of the survey (Shah, Barnwell, and Bieler 1996).
Results
Sample and Population Characteristics
The 1999 and 2000 NHIS dataset includes observations on 12,434 adolescents aged 10 to 18 years old, including 2,169 with family incomes below the FPL (poor); 2,638 with family incomes from 100 percent to 199 percent of the FPL (near poor); 2,263 with family incomes ranging from 200 percent to 299 percent of the FPL (moderate income); and 5,364 with family incomes at or above 300 percent of the FPL (middle and high income). Applying population weights provided by the data collection agency, the survey sample represents a total 72.5 million adolescents nationally. On a weighted basis, 16.7 percent were classified as poor, 20.8 percent as near poor, 18.1 percent as moderate income, and, 44.5 percent as middle and high income.
Health Status
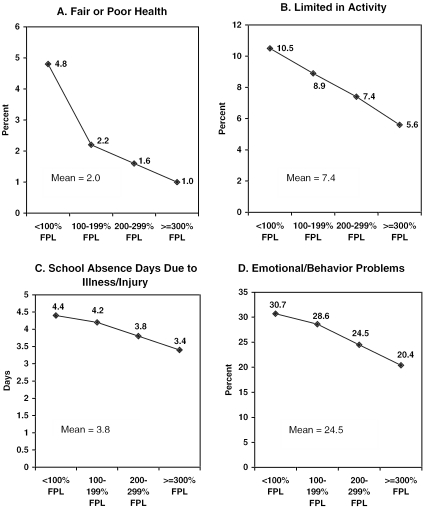
Most adolescents were reported to be healthy during 1999–2000 (Figure 1). Overall, 98 percent of adolescents were reported as being in excellent, very good, or good health; only 2 percent were perceived by respondents to be in fair or poor health. Chronic conditions resulting in limitations in usual activities were also uncommon; only 7 percent of adolescents were reported with a limitation of activity in 1999–2000. On average, adolescents were reported to experience 3.7 school absence days due to illness or injury each year. Finally, nearly one in four adolescents were classified as experiencing an emotional or behavioral problem using the indicators available from the NHIS.
Figure 1.
Health Status of Adolescents by Income: U.S. 1999 and 2000
Despite their overall healthy status, disparities in adolescent health exist across the income distribution. A strong gradient is apparent for perceived adolescent health status. Moderate strength gradients are visible for limitation of activity as well as for emotional and behavioral problems. Only weak gradients are present for school absence days.
Health Insurance Coverage
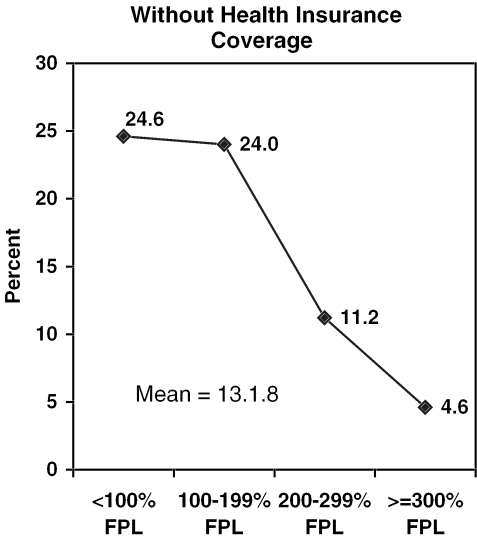
The great majority of adolescents had health insurance coverage during 1999–2000. However, one in seven (13.1 percent) lacked coverage (Figure 2). Poor and near poor adolescents experienced similar rates of insurance coverage. However, both groups were at much greater risk than adolescents in higher income households to be without coverage, resulting in a strong, albeit uneven income gradient.
Figure 2.
Health Insurance Coverage of Adolescents by Income: U.S. 1999 and 2000
Usual Source of Care and Primary Care
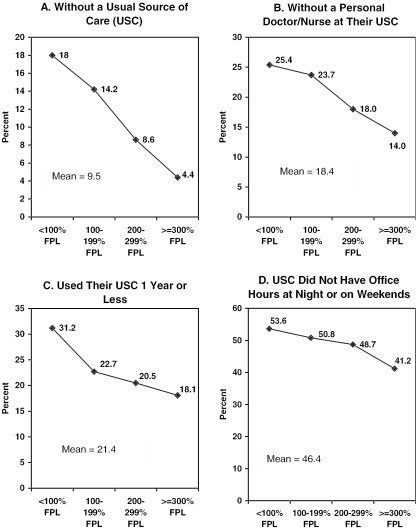
A usual source of care serves as a foundation for good primary care. Overall, 90 percent of adolescents had a usual source of health care in 1999 (Figure 3). A strong income gradient is apparent, with poor adolescents being four times as likely as adolescents in middle- and higher-income families to be without a usual source of care.
Figure 3.
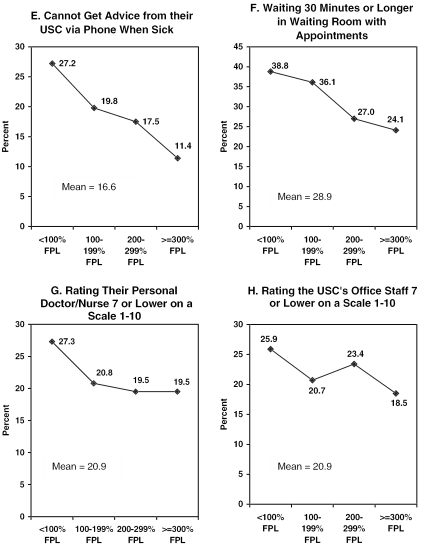
Access to and Satisfaction with Primary Care for Adolescents by Income: U.S. 1999
Characteristics of the usual source of care are also shown in Figure 3. These include continuity of care, convenience and access, and satisfaction with care. Together, these measures capture many of the dimensions of primary care. Continuity of care is measured here by the presence of a personal doctor or nurse and the length of time the patient has used the source of care. Most adolescents with a usual source of care also had a personal doctor or nurse they saw on repeat visits (81.6 percent). A similar percentage of adolescents (78.6 percent) had at least a one-year relationship with their usual source of care. Moderate-strength income gradients are apparent for each of these measures.
Convenience and access are measured here by presence of evening or weekend office hours, ability to obtain telephone advice when sick, and absence of lengthy waits for care. Slightly more than half of adolescents (53.6 percent) had access to care at night and on weekends through their usual source of care. Approximately 83 percent of adolescents could contact their usual source of care by telephone for advice on sick care and 71 percent of adolescents had waits of less than 30 minutes to see a health care provider. A weak income gradient is apparent for access to office hours outside of normal business hours, whereas a moderate gradient exists for waiting time, and a strong gradient is present for telephone advice.
Satisfaction is measured here by respondent ratings of the adolescent's personal doctor or nurse and the office staff at the usual source of care. On a 10-point scale, 79 percent of respondents rated the adolescent's personal doctor or nurse as at least an 8. The same percentage rated the office staff at least an 8. Weak income gradients are apparent for each of these measures of satisfaction.
Medical Care
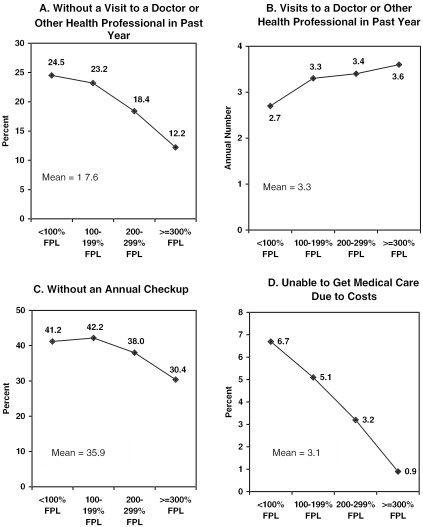
Several measures of medical care utilization for 1999–2000 are shown in Figure 4. The first two measures reflect use of ambulatory care. Overall, 17.6 percent of adolescents did not see a doctor or other health care provider in the past year. Adolescents had an average of 3.3 visits per year to doctors and other providers. Both of these measures of ambulatory care show an income gradient, albeit a weak one in the case of number of annual visits. The third utilization measure in Figure 4 is the percent of adolescents aged 10 and 17 years old with no annual checkup in the previous year. Overall, nearly two in five adolescents did not have an annual checkup and a weak income gradient is visible. Finally, only 3.1 percent of adolescents were reported to have gone without medical care in the past year due to costs. However, there was a strong income gradient present with poor adolescents being seven times more likely than adolescents in middle- and higher-income families to have unmet medical care needs.
Figure 4.
Medical Care Services Use by Adolescents by Income: U.S. 1999 and 2000
Dental Care
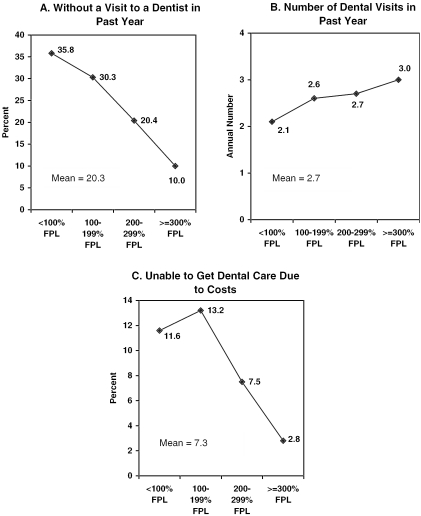
Three measures of use and access to dental care are shown in Figure 5. Approximately one in five adolescents did not see a dentist during the year prior to the survey. Adolescents had an average of 2.7 dental visits per year during 1999 and 2000. Finally, 7 percent of adolescents were reported to need but not receive dental care in the last year due to concerns about cost. Income gradients are apparent for each of these dental care indicators. A strong income gradient is present for likelihood of any dental care use. Volume of dental visits was weakly associated with family income. A strong but uneven income gradient is present for unmet dental care needs, with poor adolescents being four times more likely than adolescents in middle and higher income families to have unmet dental needs.
Figure 5.
Dental Services Use by Adolescents by Income: U.S. 1999 and 2000
Mental Health Services
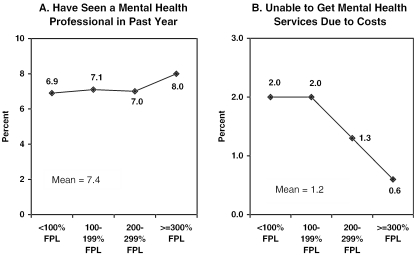
The NHIS collected two measures of mental health care use: the percent of adolescents with at least one visit to a mental health professional in the past year and the percent who had unmet needs for mental health services due to costs (Figure 6). Seven percent of adolescents had at least one encounter with a mental health professional in the previous year. A weak income gradient is present for likelihood of mental health professional encounters. Only 1 percent of adolescents were reported to have gone without needed mental health services due to costs. A strong income gradient is apparent here, with poor adolescents about three times more likely than adolescents in middle- and higher-income families to have reported unmet mental health needs.
Figure 6.
Mental Health Services Use by Adolescents by Income: U.S. 1999 and 2000
Multivariate Analysis
The findings reported above are not adjusted for confounding factors. Since certain variables, such as health insurance coverage, affect health and use of health care and at the same time are associated with family income, the findings presented above may overstate the influence of family income on adolescent health and health care. In Table 1, we present results from a series of multivariate analyses that control for several potentially confounding demographic variables including age, race, sex, family size, region, and population density. In addition, in selected equations we adjusted for enabling and need variables, including health insurance coverage, perceived health status, limitation of activity status, emotional and behavioral problems, and school absence days due to illness or injury.
Table 1.
Income and Health Status, Access to Care, and Use of Health Services for Adolescents: U.S. 1999 and 2000
| Indicator Variables | <100% FPL | 100–199% FPL | 200–299% FPL | =300% FPL |
|---|---|---|---|---|
| Adjusted OR* | Adjusted OR* | Adjusted OR* | Adjusted OR* | |
| Health Status | (95% CI) | (95% CI) | (95% CI) | (95% CI) |
| With fair or poor health | 4.47 (2.68, 7.47) | 2.15 (1.32, 3.49) | 1.55 (0.87, 2.77) | 1.00 |
| With any limitation activity | 2.71 (2.04, 3.60) | 2.12 (1.70, 2.64) | 1.53 (1.20, 1.95) | 1.00 |
| Number of school absence days due to illness/injury | 1.53 (0.96, 2.10)† | 1.03 (0.42, 1.64)† | 0.56 (0.19, 0.93)† | 0.00 |
| Had a behavioral/emotional problem | 1.87 (1.57, 2.22) | 1.64 (1.42, 1.89) | 1.30 (1.13, 1.49) | 1.00 |
| Health Insurance | ||||
| With no health insurance coverage | 5.81 (4.61, 7.32) | 5.98 (4.79, 7.48) | 2.65 (2.10, 3.35) | 1.00 |
| Access and Satisfaction with Primary Care‡ | (95% CI) | |||
| With no usual source of care when sick | 2.52 (1.71, 3.71) | 1.88 (1.35, 2.62) | 1.67 (1.19, 2.34) | 1.00 |
| With no personal health provider | 1.68 (1.26, 2.24) | 1.57 (1.20, 2.05) | 1.28 (0.98, 1.67) | 1.00 |
| Go to the usual source of care less than one year | 1.73 (1.30, 2.30) | 1.15 (0.90, 1.49) | 1.02 (0.80, 1.30) | 1.00 |
| Provider has no night/weekend office hours | 1.49 (1.15, 1.92) | 1.39 (1.13, 1.71) | 1.20 (0.98, 1.48) | 1.00 |
| Cannot get advice via telephone | 2.31 (1.69, 3.14) | 1.41 (1.06, 1.86) | 1.60 (1.21, 2.12) | 1.00 |
| Waits more than 30 minutes in waiting room w/appt | 1.77 (1.38, 2.27) | 1.48 (1.17, 1.88) | 1.07 (0.86, 1.32) | 1.00 |
| Rates personal health provider less than 8 on 1–10 scale | 1.24 (0.94, 1.64) | 0.99 (0.76, 1.27) | 0.87 (0.68, 1.12) | 1.00 |
| Rates office staff less than 8 on 1–10 scale | 1.20 (0.89, 1.62) | 0.99 (0.77, 1.27) | 1.21 (0.97, 1.50) | 1.00 |
| Medical Care Services | ||||
| Had no visits to a health professional in past year | 1.70 (1.40, 2.07) | 1.63 (1.38, 1.94) | 1.48 (1.23, 1.77) | 1.00 |
| Number of visits to health professional in past year | −0.66 (−1.37, 0.05)† | −0.10 (−0.76, 0.96)† | −0.00 (−0.69, 0.69)† | 0.00 |
| Had no annual checkup | 1.37 (1.16, 1.61) | 1.42 (1.23, 1.65) | 1.31 (1.13, 1.51) | 1.00 |
| Unable to get medical care due to costs | 3.80 (2.29, 6.32) | 2.93 (1.79, 4.78) | 2.72 (1.70, 4.36) | 1.00 |
| Dental Services | ||||
| Had no visits to a dentist in past year | 3.16 (2.56, 3.88) | 2.65 (2.22, 3.17) | 1.99 (1.66, 2.40) | 1.00 |
| Number of dental visits in past year | −0.74 (−1.03, −0.45)† | −0.24 (−0.61, 0.13)† | −0.38 (−0.67, −0.09)† | 0.00 |
| Unable to afford dental care due to costs | 3.23 (2.36, 4.42) | 3.54 (2.66, 4.71) | 2.38 (1.77, 3.20) | 1.00 |
| Mental Health Services | ||||
| Had no visits to a mental health professional in past year | 1.11 (0.83, 1.50) | 0.94 (0.74, 1.19) | 1.10 (0.87, 1.39) | 1.00 |
| Unable to get mental health services due to costs | 1.80 (.099, 3.24) | 1.98 (1.01, 3.86) | 1.86 (1.00, 3.44) | 1.00 |
Results from logistic regressions. Adjusted odds ratios for health status indicators have been adjusted for adolescent's age, race, sex, family size, insurance status, region, and the population density of the area of residence. Adjusted odds ratios for insurance status was adjusted for adolescent's age, race, sex, family size, region, the population density of the area of residence, perceived health status, limitation in activity status, behavioral/emotional problems, and number of school absence days. Adjusted odds ratios for usual source of care, medical care, dental, and mental health services indicators have been adjusted for adolescent's age, race, sex, family size, insurance status, region, the population density of the area of residence, perceived health status, limitation in activity status, behavioral/emotional problems, and number of school absence days.
Results from ordinary least squares regressions. These values shown are the mean differences between adolescents living in families with an income less 100% FPL, 100–199% FPL, or 200–299% FPL as compared to children living in families with an income more than 299% FPL.
1999 NHIS data only.
Source: Microdata from the 1999 and 2000 National Health Interview Survey.
After adjustment for these confounding variables, statistically significant disparities were found between poor adolescents and their counterparts in middle- and higher-income families for three of four health status measures, six of eight measures of access to and satisfaction with care, and for six of nine indicators of access to and use of medical care, dental care, and mental health care.
Discussion
The objective of this analysis was to examine the extent to which income-related disparities remain in adolescent health and health care. Disparities in health and health services for the poor, including adolescents, have existed for many years in the United States. Indeed, these disparities were the impetus for the enactment of Medicaid expansions and the State Children's Health Insurance Program (SCHIP). Both of these initiatives were directed at poor and near poor children and adolescents.
Despite these initiatives, our study revealed that after adjustment for confounding variables, statistically significant disparities were found between poor adolescents and their counterparts in middle and higher income families for all four health status measures, six of the eight measures of usual source of care and primary care, and six out of nine access and utilization indicators for medical, dental, and mental health care. Although not as strong, a similar pattern of effects was found when near-poor adolescents were compared to adolescents in middle- and higher-income families.
One problem concerns how effective these programs have been in enrolling and retaining eligible adolescents. In this regard, our data show that even after adjusting for a variety of confounding variables, adolescents in poor and near-poor families have a five to six times higher likelihood of being uninsured as their counterparts in middle- and higher-income families. This finding is particularly troubling given that virtually all adolescents living in poor and near-poor families were either eligible for Medicaid or the SCHIP during 1999 and 2000 (Dubay, Haley, and Kenney 2002). Although SCHIP was not enacted until 1997, our data should still reflect at least some of the impact of that program.
Together these findings suggest that while having health insurance programs in place is a necessary condition for improving access, they are clearly not sufficient. Continued efforts are needed to ensure eligible adolescents enroll and stay enrolled in these programs. However, even when enrolled in public or private health insurance, adolescents from low-income families face additional barriers to care. This was demonstrated in our multivariate analysis, which showed that disparities in access and utilization exist even after controlling for insurance coverage. Consequently, nonfinancial barriers, such as transportation, child care, provider availability, and language barriers, must also be addressed to ensure access.
Footnotes
We appreciate the financial support of the W. T. Grant Foundation, Project 2077, and the Maternal and Health Bureau, HRSA, U.S. Department of Health and Human Services, 6U93 MC00023. The analyses and interpretation are those of the authors and do not necessarily reflect the views of the funders.
References
- Andersen R, Aday LA. “Access to Medical Care in the U.S.: Realized and Potential.”. Medical Care. 1978;16(4):533–46. doi: 10.1097/00005650-197807000-00001. [DOI] [PubMed] [Google Scholar]
- Andersen RM. “Revisiting the Behavioral Model and Access to Medical Care: Does It Matter?”. Journal of Health and Social Behavior. 1995;36(3):1–10. [PubMed] [Google Scholar]
- Bartman BA, Moy E, D'Angelo LJ. “Access to Ambulatory Care for Adolescents: The Role of a Usual Source of Care.”. Journal of Health Care for the Poor Underserved. 1997;8(2):214–26. doi: 10.1353/hpu.2010.0466. [DOI] [PubMed] [Google Scholar]
- Benson V, Marano MA. “Current Estimates from the National Health Interview Survey.”. Vital Health Statistics. 1995;10(199):1–428. [PubMed] [Google Scholar]
- Brooks-Gunn J, Duncan G. “The Effects of Poverty on Children.”. Future of Children. 1997;7(2):55–69. [PubMed] [Google Scholar]
- Dubay L, Haley J, Kenney G. Assessing the New Federalism. Washington, DC: Urban Institute; 2002. “Children's Eligibility for Medicaid and SCHIP: A View from 2000.”. policy brief series B, no. B-41, March. [Google Scholar]
- Flores G, Bauchner H, Feinstein AR, Nguyen UDT. “The Impact of Ethnicity, Family Income, and Parental Education on Children's Health and Use of Health Services.”. American Journal of Public Health. 1999;89(7):1066–71. doi: 10.2105/ajph.89.7.1066. [DOI] [PMC free article] [PubMed] [Google Scholar]
- Ford CA, Bearman PS, Moody J. “Foregone Health Care among Adolescents.”. Journal of the American Medical Association. 1999;282(23):2227–34. doi: 10.1001/jama.282.23.2227. [DOI] [PubMed] [Google Scholar]
- Goodman E. “The Role of Socioeconomic Status Gradients in Explaining Differences in US Adolescents' Health.”. American Journal of Public Health. 1999;89(10):1522–8. doi: 10.2105/ajph.89.10.1522. [DOI] [PMC free article] [PubMed] [Google Scholar]
- Green M, Palfrey JS, editors. Bright Futures: Guidelines for Health Supervision of Infants, Children, and Adolescents. 2d ed. Arlington, VA: National Center for Education in Maternal and Child Health; 2000. [Google Scholar]
- Halfon N, Newacheck PW. “Childhood Asthma and Poverty: Differential Impacts and Utilization of Health Services.”. Pediatrics. 1993;91(1):56–61. [PubMed] [Google Scholar]
- Kennedy BP, Kawachi I, Glass R, Prothrow-Stith D. “Income Distribution, Socioeconomic Status and Self-Rated Health in the United States: Multilevel Analysis.”. British Medical Journal. 1998;317(7163):917–21. doi: 10.1136/bmj.317.7163.917. [DOI] [PMC free article] [PubMed] [Google Scholar]
- Kitagawa EM, Hauser PM. Differential Mortality in the United States: A Study in Socioeconomic Epidemiology. Cambridge, MA: Harvard University Press; 1973. [Google Scholar]
- Lowry R, Kann L, Collins JL, Kolbe LJ. “The Effect of Socioeconomic Status on Chronic Disease Risk Behaviors among U.S. Adolescents.”. Journal of the American Medical Association. 1996;276(10):792–7. [PubMed] [Google Scholar]
- Montgomery LE, Kiely JL, Pappas G. “The Effects of Poverty, Race, and Family Structure on US Children's Health: Data from the NHIS, 1978 through 1980 and 1989 through 1991.”. American Journal of Public Health. 1996;86(10):1401–5. doi: 10.2105/ajph.86.10.1401. [DOI] [PMC free article] [PubMed] [Google Scholar]
- National Center for Health Statistics . National Health Interview Survey. Hyattsville, MD: National Center for Health Statistics; 1999. Data File Documentation. machine readable data file and documentation. [Google Scholar]
- National Center for Health Statistics . National Health Interview Survey. Hyattsville, MD: National Center for Health Statistics; 2000. Data File Documentation. machine readable data file and documentation. [Google Scholar]
- National Governor's Association, Center for Best Practices . Retention and Reenrollment of Children in SCHIP and Medicaid. Washington, DC: National Governor's Association; September, 1999. [Google Scholar]
- Newacheck PW, Brindis CD, Cart CU, Marchi K, Irwin CE. “Adolescent Health Insurance Coverage: Recent Changes and Access to Care.”. Pediatrics. 1999;104(2):195–202. doi: 10.1542/peds.104.2.195. [DOI] [PubMed] [Google Scholar]
- Newacheck PW, Hughes DC, Stoddard JJ. “Children's Access to Primary Care: Differences by Race, Income, and Insurance Status.”. Pediatrics. 1996;97(1):26–32. [PubMed] [Google Scholar]
- St Peter RF, Newacheck PW, Halfon N. “Access to Care for Poor Children: Separate and Unequal?”. Journal of the American Medical Association. 1992;267(20):2760–4. [PubMed] [Google Scholar]
- Shah BV, Barnwell BG, Bieler GS. SUDAAN User's Manual. Research Triangle Park, NC: Research Triangle Institute; 1996. release 7.0. [Google Scholar]
- Starfield B. “Family Income, Ill Health, and Medical Care of U.S. Children.”. Journal of Public Health Policy. 1982;3(3):244–59. [PubMed] [Google Scholar]
- Starfield B, Budetti PP. “On Children: Child Health Status and Risk Factors.”. Health Services Research. 1985;19(6, part 2):817–86. [PMC free article] [PubMed] [Google Scholar]
- Statistical Solutions . SOLAS for Missing Data Analysis. Saugus, MA: Statistical Solutions; 2001. release 3.0. [Google Scholar]
- U.S. Census Bureau “Poverty Thresholds by Size of Family and Number of Children [accessed June 2002].”. 1998. “Poverty Thresholds by Size of Family and Number of Children [accessed June 2002].” Available at http://www.census.gov/hhes/poverty/threshld/thresh98.html.
- U.S. Census Bureau “Poverty Thresholds by Size of Family and Number of Children [accessed June 2002].”. 1999. “Poverty Thresholds by Size of Family and Number of Children [accessed June 2002].” Available at http://www.census.gov/hhes/poverty/threshld/thresh99.html.
- Wood DL, Hayward RA, Dorey DR, Freeman HE, Shapiro MF. “Access to Medical Care for Children and Adolescents in the United States.”. Pediatrics. 1990;86(5):666–73. [PubMed] [Google Scholar]


