

Abstract
The choice of a phenotype is critical for the study of a complex genetically regulated process, such as aging. To date, most of the twin and family studies have focused on broad survival measures, primarily age at death or exceptional longevity. However, on the basis of recent studies of twins and families, biological age has also been shown to have a strong genetic component, with heritability estimates ranging from 27% to 57%. The aim of this review is twofold: first, to summarize growing consensus on reliable methods of biological age assessment, and second, to demonstrate validity of this phenotype for research in the genetics of aging in humans.
MEASUREMENT of the genetics underlying variability in human aging is an important and active area of gerontological research. Knowledge of the basic genetic mechanisms leading to different rates of biological aging may provide novel strategies for pharmacological or life style interventions aimed at reducing age-related functional decline.
Current Progress of Genetic Studies of Aging
Life expectancy (the average life span of a general population) has increased in recent decades; however, the fundamental aging process remains unchanged (1). Current reports suggest that senescence is genetically determined (and transmitted as a dominant phenotype) (2). The choice of a phenotype is critical for the study of a complex genetic process, such as aging. To date, most of the twin and family studies have focused on broad survival measures, primarily on “healthy” or “successful” aging, age at death, or longevity (3,4). It has been reported that longevity is heritable, with heritability ranging from 20%–30% (4–6) to about 50% (7,8) and that the genetic covariance between covariates such as smoking, body mass index, and mortality is negligible (5). “Successful aging,” defined as avoiding disease and disability, maintaining high cognitive and physical function, and being socially engaged throughout the life span, was also recently subjected to quantitative genetic analysis (9,10).
Brand and colleagues (11) found in the Framingham Offspring Study that age at death may be mediated primarily through coronary risk factors such as systolic blood pressure (SBP). It was thus proposed that the genetic study of longevity should focus on the most prevalent cause of morbidity and mortality, such as cardiovascular disease, in older age (11,12). Indeed, cardiovascular disease profiles are reported to be better in centenarians, their siblings, and their offspring, than in controls (12–14). Evert and colleagues (14) found that centenarians fit into three morbidity profiles: “Survivors” had a diagnosis of an age-associated illness prior to the age of 80, “Delayers” delayed the onset of age-associated illness until at least the age of 80, and “Escapers” attained their 100th year of life without the diagnosis of common age-associated illnesses.
Further, Barzilai and colleagues (15) found that, in Ashkenazi Jewish probands with exceptional longevity (mean age 98.2 ± 5.3 years) and their offspring, both high density lipoprotein (HDL) and low density lipoprotein (LDL) particle sizes were significantly higher than in controls, independent of plasma levels of HDL and LDL cholesterol and apolipoproteins A1 and B. This lipid profile corresponds to absence of hypertension, metabolic syndrome, or cardiovascular disease. Terry and colleagues (12) confirmed that the offspring of long-living individuals demonstrated a markedly reduced prevalence of cardiovascular disease and cardiovascular risk factors associated with aging. Although “healthy physical aging,” primarily based on the absence of cardiovascular disease until older age, and longevity per se are considerably different phenotypes, it is believed that they share at least a few common determinants (10,16). However, longevity as a phenotype contains no information on either functional ability or physiologic deterioration that precedes disease incidence, as individuals may exhibit different morbidity profiles and survival patterns (17,18).
Strengths and Limitations of the Study of Extremely Old Individuals
Recruitment of extremely old (oldest surviving) persons to study longevity and “successful aging” has its benefits from a genetic point of view, because these probands may be more genetically homogenous and enriched with longevity genes. This approach was implemented in studies of longevity in humans (19) and mice (20). However, for a traditional human genetic study, this approach has several limitations: a) only a small subset of a general population may be assigned a phenotype. There are not many healthy centenarians available to compose a large sample, and influences of selection bias and selective survival are clear (21), which leads to the lack of generalizability of the findings (22); b) relative to other complex phenotypes, recruitment of a large cohort of healthy centenarians is extremely labor-intensive; c) it is difficult to obtain a sufficiently large sample of parents and offspring who both have extreme longevity; d) lack of a control sample (such as blood samples from the average-life-span individuals, born at the same time as centenarians) poses a problem for case–control comparison of allelic frequencies; and e) most important, ultimate longevity may not be the best phenotype of interest. Quality of life in older age, active life expectancy, and duration of disability-free aging should be a focus of such a study (17,23) rather than predetermined, maximal life expectancy.
Biological Age: Definition and Estimation
To circumvent the above problems, biological (synonymous with “functional” and “physiological”) (24,25) age has been proposed as an alternative phenotype of interest (18,26,27). Because tissues age at different rates and because diseases vary enormously among individuals, humans become increasingly different from one another with age. Chronological age fails to provide an accurate indicator of the aging process (3). Biological age estimates the functional status of an individual in reference to his or her chronological peers on the basis of how well he or she functions in comparison with others of the same chronological age (28). This concept leads to the notion that biological age can be calculated for any given age group, thus being applicable to unselected pedigree members from the general population. Different individual rates of the aging process lead to differences between chronological and biological age (24), thus individual values of biological age can vary widely at any given chronological age (25), and ultimately are expected to correspond to the interindividual variations in longevity and timing and/or magnitude of sequels of the aging process.
It has been proposed that biological age may serve as an indicator of an individual’s general health status, remaining healthy life span, and active life expectancy (28). Biological age may help in identifying individuals at risk for age-related disorders, serving as a measure of relative fitness, and predicting disability in later life and mortality independent of chronological age (25,29). Other characteristics, such as frailty (25) and allostatic load (30), have been proposed as factors to consider when assessing heterogeneity of health status in elderly persons, but these constructs are not applicable for a study of middle-aged individuals.
People who function poorly are thought to be “biologically older” than their chronological peers; conversely, people who function well might be deemed “biologically younger.” The concept of biological age may be best represented by the construction of an index derived from several biological parameters of an organism (so-called biomarkers of aging), which are closely related to the maintenance of life and correlated to some degree with chronological age (31). Exploration and validation of biomarkers remains a priority in gerontology (32). Because tissues and organs age at different rates (3), there is a need to obtain biomarkers from multiple systems and to combine them in the most efficient way to reflect overall aging of an organism.
Choice of Biomarkers: Biological Theory and Practice
Most of the proposed methods for biological age determination use comprehensive multifactorial measuring systems or batteries of tests, encompassing a large number of biochemical, physical, mental, and functional parameters that vary with age (31,33). The more comprehensive the choice and assessment of parameters of dysregulation in all the important regulatory systems, the better the ability of their combination to predict outcomes (34). Some physiological systems may be more crucial than others to the rate of aging (23); alternatively, some biomarkers can reflect dysregulation of multiple systems (34). The search for global and system-specific markers will continue until there is a better understanding of the relationship between the important bodily systems.
The most obvious biomarkers include gray hair, presbyopia, and skin inelasticity (35,36). An extended review and discussion of biomarkers and their correlation with age and predictive ability of health outcomes was provided by Anstey and colleagues (24) a decade ago. Most recently, new biomarkers of aging and new batteries of tests have been proposed, including changes in telomere length (37–39), cross-linking of collagen (40), glycosylated hemoglobin (34), pulse wave velocity (41), hearing loss, number of healthy teeth (26), as well as sarcopenia (42). Seeman and colleagues (34) also propose the use of inflammatory markers, clotting factors, and immune function tests as biomarkers.
Many popular biomarkers decline roughly linearly with age with a slope of <1% per annum (43,44). Although certain biomarkers may deviate from linearity in some portions of the age distribution, a linear relationship is usually proposed for most biomarkers as a best fit. Psychosocial variables show the least association with age, whereas measures of respiratory function show the strongest associations (24). In general, informative biomarkers should: a) predict, better than chronological age, declines in one or several organ systems and/or the likelihood of a disease event; b) be highly correlated with age-related loss of function, rather than only being correlated with chronological age or survival; and c) be minimally invasive and readily observable, reliably measured, preferably on a quantitative scale [see reviews in (24,32,45)].
We realize that the biomarkers generally selected at present are merely snapshots of important regulatory systems; there is no information on system dynamics if each biomarker is measured only once (34,46). Although the superiority of longitudinal over cross-sectional data is well established, its advantage in studies of aging may be particularly significant because longitudinal studies permit the direct examination of individual change and identification of factors associated with that change (47). A linear relationship with age that is assumed for most biomarkers as a best fit (24,44) may not always be correct due to deviation from linearity in some portions of the age distribution. An additional limitation of a cross-sectional measurement of biological age is a failure to account for interindividual differences in variables that are not related to aging per se. Each biomarker’s variance consists of both genuine aging differences between individuals and differences not related to aging (48). An important example of this is found in a study by Nakamura and colleagues (48), which showed that genetic factors may influence not only biomarkers at one time point but also their rates of change with time (age). There is an obvious need to understand the status of the biomarker variables at multiple time points (17), as well as to assess individual rates of biological age changes.
The following review of biomarkers focuses on those that are more likely to be informative and that have been extensively studied elsewhere.
Choice of Biomarkers: Statistical Modeling
The primary variables that have been used as a proxy for aging-related traits include longevity, lack of functional decline, “successful aging,” active life expectancy (the duration of survival without disability), and health expectancy (survival without any one of a specified set of diseases, such as cardiovascular disease, cancer, fracture, or dementia) (49). Although there appear to be established procedures to determine aging-related traits, our understanding of relevant risk factor(s) for these outcomes is still very rudimentary. A simple scenario is to use individual biological markers and covariates as predictor variables with one of the outcomes as the dependent variable. However, the evaluation of individual biomarkers (e.g., SBP, lipid measures, or hand grip) as primary predictors has been implicated as a less efficient approach when compared to the use of summary indices (34). One of the key features of aging studies has been the attempt to select a set of variables that captures the “cumulative biological burden,” which can be expressed as a function of observed individual risk factors (biomarkers). Thus, Seeman and colleagues (50) proposed a single summary score (allostatic load) as a measure of cumulative biological burden independent of outcome measures. Further, Karlamangla and colleagues (51) obtained a weighted summary score of risk factors based on canonical correlation analysis (thus defining allostatic load conditional on outcome measures).
The types of procedures used to define composite variables include those based on simple averages or sums of individual biomarkers, canonical analysis, factor (principal components) analysis, and multiple linear regression techniques. The appropriateness of these methods depends on the goals of the study and the type of data being analyzed. Conceptual clarity and the underlying logic of choosing these or other approaches are vital for the accuracy of the study.
One widely used method of biological age estimation is a multiple regression of many biomarkers with age as the dependent variable. There are three commonly used selection procedures: forward selection, backward elimination, and stepwise regression. Whether one uses forward selection, backward elimination, or stepwise regression, these processes are not guided by any substantive theory—i.e., they use statistical algorithms with little regard for the study questions and/or objectives; and they do not necessarily produce the best model or an optimal selection of the subset of biomarkers. A common problem with these procedures arises when there are redundant predictors. Because in complex organisms, theoretically, processes are all interdependent, changes in one organ system may affect many others (25). However, there are redundancies in compensatory systems in complex organisms that preserve function (52). There is thus a need to balance the desire to include as many traits as possible with the need to minimize the number of traits in the model.
Factor analysis has been proposed as a way of selecting factors rather than arrays of biomarkers of aging (46). Principal component analysis is useful to construct a linear combination among highly complex, correlated (colinear) biomarkers, and thereby reduce the number of variables capturing the aging rate. The procedure provides guidelines to determine the number of components to retain and the factor scores to define summary variables (principal components). Technically, a principal component can be defined as a linear combination of optimally weighted observed variables. In general, the larger the size of the factor loading for a variable, the more important the variable is in interpreting that factor (53).
The ability of both regression equations and factor solutions to generalize across studies is not high [see review in (24)]. However, both methods are valuable as an approximation of a complex network of biological aging, and may help to identify a number of biomarkers that have consistently contributed a major part of biological age variability in many studies (21,24). An alternative to regression includes the recursive partitioning to identify nonlinear patterns of association among biomarkers (34). Construction of weighting systems based on canonical correlation analyses has also been proposed (51), which forms a linear combination of the variables from each set (called a canonical variable), such that the relation between the two canonical variables is maximized. Karlamangla and colleagues (51) used this approach to allow unequal weight to reflect a more realistic scenario in which the different components of the combined score contribute differentially to outcomes.
There seems to be an evolving consensus regarding the methodology for evaluating biological age. In fact, recent studies (including our own) have accepted the following statistical definition: Biological age can be calculated as a residual between actual age and predicted age (from a statistically modeled combination of many biomarkers) (18,25,27).
Validation of Biomarkers and Biological Age Measures
There has been an underlying expectation that a measure such as biological age should be able to predict death and disability independently of chronological age. Attempts to evaluate the predictive ability of death by batteries of biomarkers began many years ago (28). For example, Uttley and Crawford (29) developed a battery of biomarkers from pulmonary function (forced expiratory volume), neuromotor performance, blood pressure, blood chemistry, strength/flexibility, and anthropometric variables in their Mennonite samples. Biological age modeled in this way did not conclusively predict death; however, several individual biomarkers were associated with higher relative risk for mortality (29). Similarly, Brant and colleagues (54) found that blood pressure, cardiac diagnosis, forced expiratory volume, and visual acuity were associated with mortality in the Baltimore Longitudinal Study of Aging.
An argument could also be made that relevant biomarkers should not be expected to predict mortality. In fact, the ability of biological aging indices to predict life span is an imperfect criterion previously used to validate these markers. There are many risk factors that predict life expectancy in middle-aged people, yet are not closely related to an underlying process of aging, often because they are surrogates of poor health behaviors or specific disease risk (24). More important is the ability of some of the biomarkers and biological age measures to be able to discriminate between adverse aging-related events, such as immobility (55), institutionalization, or propensity to fall (56). A summary index of several biomarkers (“allostatic load”) has been demonstrated to be a significant predictor of major health outcomes, namely, mortality and declines in cognitive and physical functioning, both over a 2.5-year and 7.5-year follow-up (34,50). Notably, none of the individual biomarkers, components of this index, possessed strong predictive ability for the above outcomes (30), suggesting that the summary index indeed measures a property beyond mere dysfunction in one organ system.
Common and New Biomarkers of Aging
SBP, grip strength, forced expiratory volume, cholesterol and glucose blood levels, and cognitive and/or neuropsychological data are the most commonly used biomarkers in studies of biological age (24,29,50,57).
SBP has been one of the previously studied biomarkers for several reasons. There are changes in vascular stiffness with aging that affect SBP (58); these changes may be due to the reduction in elastic compliance of aging vascular tissues. In a longitudinal study of Japanese men (48), SBP significantly increased over a 7-year interval (r = 0.58), and in several cross-sectional studies (24), SBP also has been demonstrated to correlate well with age in both sexes (r = 0.45 in males and 0.50 in females). Pulse pressure, a difference between systolic and diastolic blood pressure, progressively increases with age due to progressive stiffening of arteries, and thus may also serve as a biomarker of arterial aging (39).
Sarcopenia is manifested as muscle strength and muscle mass decrease with age, mainly due to the alterations in muscle morphology. This mostly is due to decreased proportion and cross-sectional area of type II fibers, however, single fiber analysis suggests that the contractile proteins may become less effective with age (59). Hand grip strength is known to be associated with muscular functioning in other muscle groups and with activities of daily living. In several cross-sectional studies (24), grip strength correlated with age (r = 0.61 in both males and females). Hand grip strength predicts cause-specific and total mortality and disability (60,61). Symptomatic hand osteoarthritis also has been shown to be inversely associated with grip strength (62).
The histological changes in lung parenchyma, a decrease in ventilatory muscle strength, and an increase in lung compliance with aging contribute to lower vital capacity and expiratory flow rates in elderly persons (63). Forced expiratory volume in 1 second (FEV1) and forced vital capacity (FVC) are the best measures of pulmonary function. Both significantly decreased with age (r = −0.60 to −0.75 in cross-sectional and −0.48 to −0.60 in longitudinal analysis, for FVC and FEV1, respectively) (48).
Cross-sectional and longitudinal changes in cholesterol levels with aging have been reported in both sexes (64). Notably, serum cholesterol levels increased by 18% over 15 years in women and by only 6% in men (35). LDL cholesterol levels also increase with age in most human populations, and correspond to higher cardiovascular pathology and mortality. HDL cholesterol levels have been shown to be much higher in the offspring of Ashkenazi centenarians than in controls, suggesting that HDL may be involved in exceptional longevity (15). Several studies (65) have found a decreased concentration of total cholesterol in an elderly population, perhaps explained by their inadequate nutrition or lower physical activity. Age-dependent reduction of total cholesterol levels has been suggested to be a marker of poor health.
Impaired glucose tolerance and noninsulin-dependent diabetes become progressively more common with advancing age, due to decreased hepatic sensitivity to insulin or inadequate secretion of insulin. Resulting elevated glucose concentrations (hyperglycemia), in particular, potentiate injury to mitochondrial DNA (66). Blood glucose levels have been shown to correlate with age in Japanese men (r = 0.17 in cross-sectional and r = 0.13 in longitudinal analysis) (48).
Decline in cerebral blood flow, white matter lesions, and a significant decline in the numbers of brain cells (45) contribute to cognitive decline in elderly persons. With increasing age, there is an increased risk for memory impairment (67) as well as indications of age-related decline of other cognitive functions in otherwise normal older adults (68). Thus, in the Framingham Study, the oldest participants had the lowest performance levels measured by a neuropsychological test battery (however, they also have had the fewest years of formal education) (69). In general, the mean performance of less educated elderly persons was significantly poorer than that of their better educated peers (70).
Skeletal Biomarkers
The process of bone involution seems to be a general phenomenon and a normal manifestation of tissue atrophy with age (71). After the skeleton has reached maturity, bone remodeling is responsible for the complete replacement of old bone tissue with new tissue (72). With advanced age, the placement and quality of new bone are altered. This alteration is caused by the change in areas of remodeling due to disease, by variations in muscle strength, and by trauma. Also, at different phases of life during which there are various kinds of work and leisure activity, bone activity may be altered. The amount of bone reformed and replaced during the remodeling cycle progressively decreases with advanced age due to decreased proliferative capacity of osteoblasts (73,74) as well as to cumulative damage of uncorrected molecular errors (75). The longer an individual lives, the more remodeling cycles he or she undergoes, and the more such errors accumulate. Finally, the contribution of catabolic illness, such as surgery, injury, palsy (76), and immobilization, may contribute to rapid bone degeneration. The net result of the age-related bone changes in older persons is chronic degenerative disease, which is characterized by the loss of bone mass and bone strength, development of fragility, and the alteration of bone morphology. These processes involve both cortical and trabecular bone compartments, juxtaarticular regions, and bones of axial and appendicular skeleton, and are common in humans of different ethnic groups, both modern and prehistoric (77,78).
There is a strong correlation of age-related skeletal features with the state of many vital functions (79,80), age-related conditions of different bodily systems (81,82), and ultimately survival rates (80,83). For example, lower bone mineral density (84) and higher osteoarthritis (85,86) are associated with a higher risk of mortality independent of age and comorbidities. In particular, low bone ultrasound indices (87) have been associated with a higher risk of all-cause and cancer mortality.
Adaptive mechanisms, which compensate for skeleton’s deficient remodeling, are also evident in degenerative bone disease. Thus, endosteal expansion causes subperiosteal outgrowth (88); excessive bone resorption (such as that occurring when the skeleton is unloaded) brings about heterotopic calcification in neighboring soft tissues. Similarly, new bone formation is demonstrated by endochondral ossification of enthesis fibrocartilage (89) and development of osteophytes (90,91). Longitudinal studies (71,92) have shown that incident bone degenerative traits never regress. These features of the skeleton make it an attractive organ system for assessing biological age. Bone changes are relatively stable, unlike most nonskeletal biomarkers that may vary seasonally or diurnally or may be dependent on external conditions (93).
Age-related bone and joint changes manifest as visible and measurable traits, which has facilitated paleoanthropological and forensic applications of skeletal aging methods and has ultimately paved the way for the development and usage of a radiographic (osteographic) scoring system as an integrative measure of adult bone aging (94).
Biological Age Measured With Skeletal Biomarkers Predicts Survival in the Framingham Study
Originally, the Osteographic Scoring System (OSS) was proposed for skeletal age assessment in adults (94). Figure 1 illustrates the semiquantitative reading score in detail. In brief, to evaluate individual OSS score on an X-ray, the phalanges of digits II–V are observed for the following four groups of age-related characteristics: a) bone proliferations (spurs), b) bone porosity, c) sclerosis, and d) nontraumatic joint deformities.
Figure 1.
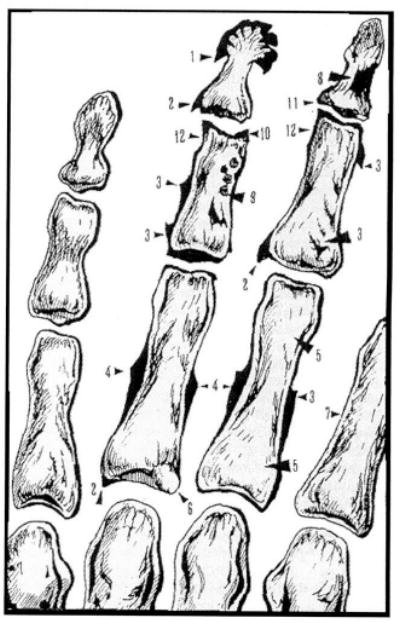
Sketch of the Osteographic Scoring System (OSS). Modified from Pavlovsky and Kobyliansky (94). The following four groups of age-related bone changes are graded (numbers in parentheses correspond to arrows): bone proliferations (spurs), including apiostoses (tufting of distal phalangeal tuberosity (1), osteophytes (2), enthesophytes (3), and subperiosteal expansion at midshaft (4); bone porosity, defined as scalloping of cortex (7) and resorption of trabeculae (5), development of lacuna (6); sclerosis, defined as enostosis (8), sclerotic nuclei (9), subchondral sclerosis (10); and nontraumatic joint deformity, defined as narrowing of joint cavities (11) and ulnar corrosion (12).
The intraclass correlation for OSS was 0.96 (95% confidence interval, 0.91–0.99) in men and 0.95 (95% confidence interval, 0.90–0.97) in women, and ranged from 0.86 to 0.96 for four groups of OSS components (27). In a sample of more than 7000 individuals (16–99 years old) belonging to 32 ethnic groups from Eurasia, OSS was correlated with chronological age (r = 0.78–0.80, p < .001) and was moderately correlated with other radiographic measurements, such as phalangeal bone density, metacarpal cortical indices, and hand arthritis (95,96). The age dependence of OSS, although not strictly linear, is apparent in both sexes (Figure 2) (27,96). Although OSS was correlated with chronological age, there was a considerable amount of variation in chronological age not explained by OSS. The variability of the score also increased with age [as measured by standard deviations (SDs) in each 3-year interval age group, Figure 2]. This heterogeneity affords the opportunity to divide individuals into three groups according to whether their OSS lies below, above, or is the same as OSS values expected for their chronological age. Pavlovsky and Kobyliansky (94) proposed that OSS may thus serve as a marker of biological age.
Figure 2.
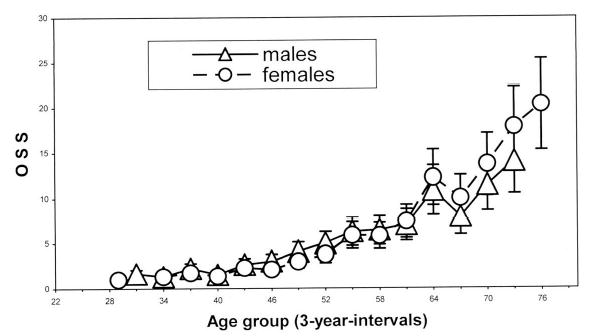
Relationship between age and Osteographic Scoring System (OSS) in Framingham Offspring Cohort. From Karasik and colleagues (27). Mean ± standard deviation shown for each 3-year interval age group.
We tested the above hypothesis by using a sample of the Original Cohort from the Framingham Heart Study. The population-based Framingham Heart Study began in 1948 with the primary goal of evaluating risk factors for cardiovascular disease. Participants from the Original Cohort, aged 28–62 years at baseline, have been examined every 2 years since enrollment. Radiography was performed in a subsample in 1967–1970, and residual biological age (ΔBA) was calculated as the difference between age predicted by OSS and chronological age. The participants in this sample, 748 men and 1028 women, were followed for 31 years from the time of X-ray for all-cause mortality. Mean age of men at the time of radiography was 59.3 ± 7.6 years, and of women, 59.4 ± 8.0 years (range 47–80 years in both sexes).
The relation of ΔBA with overall mortality is reported in Table 1. We applied proportional hazard models using time from radiography until death or last follow-up time as the dependent measure. From these models, we report the hazard ratios as the increase in the hazard of dying for each SD increase in ΔBA, and note that the proportional hazard model assumes that this increase remains constant over the follow-up period. Thus, both men and women with 1 SD higher ΔBA had an 11% increase in their hazard of dying. Higher ΔBA also contributed additional information to the prediction of mortality above that of age alone: When chronological age was included in the model together with ΔBA, the association between ΔBA and mortality was still significant. These models were also applied to subgroups of participants stratified by age at time of radiography. The results suggest that, after age 70, the hazard ratios for ΔBA were weaker. This may have been due to high variability of OSS among those participants who were at least 70 years old (97), much higher mortality, and a shorter interval to the mortality event among the latter group. Despite this finding, a test of nonproportional hazards in the model with all participants supports the hypothesis that the hazard ratios do not differ from one another by age.
Table 1.
Hazard Ratio (95% Confidence Interval) for All-Case Mortality in the Framingham Original Cohort
| Age at the Time of X-Ray, y | Sexes Combined* | Men | Women |
|---|---|---|---|
| All ages | 1.11 (1.10–1.12)†‡ | 1.11 (1.10–1.12)‡ | 1.11 (1.10–1.12)‡ |
| <50 | 1.30 (1.02–1.65)§ | 1.68 (1.12–2.52)§ | 1.13 (0.86–1.48) |
| 50–59 | 1. 12 (1.09–1.15)‡ | 1.13 (1.09–1.18)‡ | 1.11 (1.07–1.15)‡ |
| 60–69 | 1.08 (1.06–1.11)‡ | 1.09 (1.05–1.14)‡ | 1.07 (1.04–1.10)‡ |
| 70+ | 1.04 (1.00–1.07)§ | 1.04 (0.98–1.11) | 1.04 (0.98–1.11) |
Notes: Adjusted for sex.
Hazard ratios are for a 1 standard deviation increase in the biological age calculated as the difference between age predicated by the osteographic scoring system and chronological age.
p < .001.
p < .05.
These preliminary data suggest that biological age measured by OSS contributes to the prediction of mortality in both sexes and in most age groups; thus, OSS indeed may be considered as a biomarker of longevity, particularly in middle-aged adults. Absence of sex differences in the prediction of mortality is expected, given a very similar dependence of OSS on age, and may also be a marker of the validity of this measure in both men and women.
Sex and Ethnic Differences in Biomarkers and Biological Age
Women live longer than men, which may indicate that the biology of aging differs in men and women (39). Not surprisingly, some biomarkers of aging are characterized by the sexual dimorphism. Pulse pressure, for example, is lower in premenopausal women than in men of the same age. During the postmenopausal period, however, pulse pressure increases faster in women than in men (39). Levels of reactive oxygen species’ products are lower in women than in men (98). Nevertheless, many aspects of function such as aerobic power and muscular strength deteriorate at a similar absolute rate in both sexes, and active life expectancy in women may be no greater than that in men (1). Still, sex differences in life expectancy may be largely due to male vulnerability to premature cardiac death and prevalence of adverse health behavior (1). Modification of behaviors and life style, which predisposes to aging, diseases, and earlier male mortality in the Western populations, has appeared to influence life expectancy in a religious isolate (99).
From the genetic perspective, women may have an inherent advantage due to the presence of two X chromosomes, which allow additional cell viability and proliferative capacity [reviewed in (1)]. Telomere length in white blood cells is higher in women than in men (98). Finally, loci with sex-specific effects on longevity have been documented in genetic mapping studies in Drosophila (100) as well as in mice. All the above suggest that normative data for biomarkers should be provided in men and women separately (24) and that biological age should be calculated in each sex (25,29). Additionally, ethnic differences in biological age measures have received little attention except for the plethora of known differences in biomarkers such as SBP (101), blood biochemistry (102), and bone aging (96). It is possible that some of the differences in biological aging among ethnic groups may be explained by discrepancies in health outcomes, life expectancy, and disability in older age as currently observed (103). From the genetic point of view, the relative contribution of genes to phenotypic variability may substantially differ in populations with different allelic frequencies and environmental influences (52).
Biological Age as a Complex Quantitative Phenotype
The majority of proposed biomarkers are characterized by relatively high heritability, for example bone degeneration traits [including manifestations of osteoporosis (104), osteophytes (105), and OSS score (106)], SBP (107), pulmonary function (108), serum cholesterol, glucose (109), and grip strength (60). In a group of Swedish same-sex twin pairs at least 80 years old, a substantial genetic influence on cognitive abilities was found to be about 62% for general cognitive ability, 55% for verbal ability, 62% for speed of processing, 52% for memory, and 32% for spatial ability (110).
ΔBA is computed by regressing chronological age on a selected set of biomarkers and subtracting the predicted age from the observed chronological age to obtain residuals. These residuals will be uncorrelated with the biomarkers, so genetic and environmental effects on the residual are expected to be independent of those on biomarkers (18). The presumption is that this residual will capture the common variance in aging beyond that explained by the given set of biomarkers. Further, it may be hypothesized that this residual will be governed by “true” genes for aging, which may not be shared with the above biomarkers of aging. This concept is illustrated in Figure 3.
Figure 3.
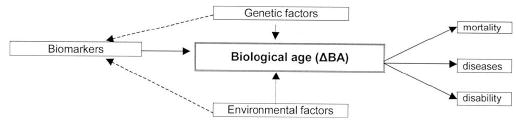
Scheme of biological age phenotype: computation, outcomes, and regulating factors.
Because biological age is measured on a continuous (quantitative) scale, it is referred to as a quantitative trait, and may be considered to be a complex phenotype. A complex phenotype is any measurable characteristic of an organism that is influenced by both genes and environment to an extent that a simple Mendelian pattern of inheritance is not readily discernable (111). Patterns of phenotypic variation in a complex trait are influenced by multiple genes, environmental factors, and interactions (among genes, between genes and their protein products, and between genes and environment). There may be numerous genes with small effects on a complex phenotype (polygeny), and individual genes may exert effects on multiple phenotypes beyond biological age (pleiotropy). McClearn and colleagues (52) also warn against the possibility of “temporal heterogeneity” of the contributions of genetic and environmental factors (and their interactions) over the life span.
Study of the genetics of a complex trait is not justifiable unless the phenotype is well defined and heritable. Biological age and related phenotypes are characterized by substantial heritability. Thus, functional age has been assessed by a general linear regression model of many biomarkers in Minnesota twins (27–88 years old). A subset of these biomarkers (mostly physiological variables) identified by a factor analysis had heritability of ~59% (3). Duggirala and colleagues (18) have recently reported that biological age, measured according to Uttley and Crawford (29), had a substantial genetic component (heritability ranging from 0.27 ± 0.11 in one Mennonite geographical subsample to 0.47 ± 0.18 in the other). Together with our estimates of heritability approximating 57% (see “Genome screen of biological age measured using OSS in the Framingham study”), these results suggest that the construct of biological age is consistent with the above definition of a complex trait.
Accounting for the effects of covariates, by adjusting for a number of key covariates, may increase both the residual heritability estimate and the genetic signal-to-noise ratio (112). More importantly, genes related to some of the covariates may interact with the genes responsible for biological age regulation. By removing the contribution of as many covariates as possible, the final analysis is focused on the “pure” contribution of genetics solely to the biological age.
Potential Covariates of Biological Age
Traits that may influence interindividual variability in aging as well as outcomes of aging should be taken into account in any analysis of biological age. The interplay between biomarkers of aging and possible covariates is complex, and the same covariate may be associated with several biomarkers. Moreover, a risk factor for one biomarker can protect against another [for example, obesity that predisposes individuals to osteoarthritis but protects against osteoporosis (17)].
We would like to focus on several among many important covariates. Thus, education has been associated with longevity, morbidity, and limitations in cognitive and motor functioning (49,113). Lifetime occupation may also be an important factor as well (113). A special emphasis should be placed on smoking, which is a risk factor for multiple age-related conditions such as hypertension and increased loss of bone (114). Smoking is also an important predictor of pulmonary function, cardiovascular morbidity and mortality, as well as cancer. In an early study, Webster and Logie (115) found that smokers had higher biological ages than did nonsmokers, similar to those who had poor self-reported health.
Alcohol use has been shown to have a J-shaped relationship with poor health, similar to the relationship between body mass index and health; no use or heavy use is associated with increased risk of disability and morbidity (116). It has been shown that resveratrol, a polyphenol found in red wine, mimics caloric restriction in yeast by stimulating silent information regulator 2 (Sir2), increasing DNA stability, and extending life span by 70% (117), which may also underlie a well-known benefit of red wine drinking for cardiovascular health. Physical activity also has several health benefits in aged persons, especially for the musculoskeletal system. Physical exercise may reduce the risk of falls (118), and adults who participate in vigorous physical activities have an enhanced life span (119). Prevalent diseases increase the interindividual and measurement variation, and thus may add environmental noise to the biological age phenotype (45). Summarizing disabilities without reference to associated illness may omit important information (25).
When an appropriate biological age phenotype is developed and appropriate covariates identified, one may proceed with genetic association and linkage studies, which are currently the major tools for genetic mapping of complex traits. We elaborate on our effort in the mapping of the ΔBA below.
Genome Screen of Biological Age Measured Using OSS in the Framingham Heart Study
In our recent study, ΔBA was calculated as described above (see “Osteographic Scoring System Predicts Survival in the Framingham Study”). In addition to the parents from the Original Framingham Study Cohort, radiographs were obtained on many members of the Framingham Offspring Cohort to assess OSS. The Framingham Offspring Cohort was initiated in 1971, and consisted of the offspring of the Original Cohort participants. The average age of the Offspring at the time of the X-rays (in 1993–1995) was 51.6 ± 9.3 years (age range 26–80) (105,120). Pedigree members from both cohorts were genotyped using a set of 401 microsatellite markers covering the genome at an average density of 10 centiMorgans and having an average heterozygosity of 0.77 [Screening Set version 9 (121)]. Of a total of 1702 genotyped Framingham participants, 1402 pedigree members of 288 pedigrees had radiographs. These pedigrees are mostly nuclear, with a small proportion of extended families ranging between 11 and 27 members.
Our biological age phenotype (ΔBA) was adjusted for sex, height, body mass index, alcohol intake, smoking status, physical activity, and in women, menopausal status and estrogen use. We found that a major portion of total variation in ΔBA was explained by additive genetic factors (heritability = 0.57 ± 0.06) and, to a lesser degree, by environmental factors. Genome-wide linkage analysis of ΔBA suggested the presence of quantitative trait loci with logarithm of odds (LOD) scores > 1.8 on chromosomes 3p, 7q, 11p, 16q, and 21q (Table 2) (27).
Table 2.
Results of Genetic Linkage Analysis of Residual Biological Age. Two-Point and Multipoint Logarithm of Odds (LOD) Scores
| LOD Scores* |
||||
|---|---|---|---|---|
| Chromosomal Region | Marker | centiMorgan | Nonadjusted | Adjusted** |
| 3p21 | GATA6F06 | 79 | 1 .86 (0.49) | 1.75 (1.17) |
| 7q34 | GATA32C12 | 150 | 2.87 (0.53) | 2.80 (0.99) |
| 11p15 | GATA48E02 | 21 | 3.45 (0.58) | 3.57 (1.04) |
| 16q24 | GATA11C06 | 125 | 2.31 (0.59) | 1.83 (0.41) |
| 21q | GATA129D11 | 27 | 0.96 (1.96) | 1.80 (2.03) |
Notes: Two-point, and in parentheses, multipoint logarithm of odds scores.
Adjusted for sex, cohort, body mass index, height, and, in females, estrogen replacement therapy and menopause status.
In this study, we neither estimated the effect of Genotype * Sex interaction nor performed a sex-specific analysis (because of the limited sample size and associated power restrictions). In addition, potential birth cohort differences were expected to add a source of heterogeneity (17), which we accounted for by adjusting ΔBA for the membership in one of the Framingham cohorts. It should be mentioned, however, that a similar average age at the time of radiography in the two Framingham cohorts conferred an advantage in reducing confounding effects of comorbidity and disability. In general, the effects of comorbidity and disability may be pronounced when studying older parents and younger offspring, and are difficult to adjust for. The above study (27) is preliminary in some respects. Higher resolution mapping of the loci that influence biological age needs to be pursued to narrow the interval of interest to the point where it becomes feasible to identify candidate genes. We also expect that ΔBA, refined by the addition of other (nonskeletal) relevant biomarkers, will allow us to map quantitative trait loci for biological age with greater confidence and precision, and to move toward the discovery of positional candidate genes in the regions of linkage (16).
Candidate Genes for Interpersonal Biological Age Differences
There are several approaches to the identification of candidate genes. First, certain classes of genes have been suggested on the basis of biological mechanisms and theories of aging, such as genes responsible for maintaining integrity and fidelity of DNA replication (122), genes related to stress resistance and response to caloric restriction (123), and genes governing neuroendocrine regulation. Second, potential candidate genes for aging and longevity in humans may be identified by using animal models (16,123,124) that have identified several genes that may have relevance to the process of human aging. One of the limitations of the application of genes found in such studies is that some gene families containing one gene in an animal model have several human homologs [for example, Sirt2 identified in Saccharomyces cerevisiae has seven human homologs (125)].
A third approach is to identify candidate genes through gene expression mapping (because their expression changes with increasing age) (123,124). Genes identified this way will either belong to the above biological pathways, affect longevity (126), or, in some cases, be completely novel and unsuspected. One potential limitation of gene expression studies for biological age is a choice of a tissue from which to obtain homogenates, which may not be a problem in a disease-specific study. Pooling of several tissues may mask important aspects of gene regulation (23). It seems worthwhile to obtain expression profiles from several important organ systems involved in aging (see “Biomarkers of Aging”), to focus on a set of genes reflecting a temporal pattern in the level of gene transcription (increase or decrease in expression levels with timing of aging) (23,127). Another limitation of gene expression studies is that only two age groups are usually compared (23,45), or gene expression in the “normal” aged cells is compared with progeric ones (128). However, this is largely true for the case–control association studies of many candidate genes for aging. As suggested in a recent genomic expression study by McCarroll and colleagues (129), future directions should include identification of signals of aging-related physiological change early in adulthood. Finally, these studies require invasive sampling to obtain tissue, as well as extraction procedures to obtain messenger RNA (45).
Polymorphisms in several genes have been found to be associated with avoiding disease in late life, or their frequency has been shown to differ between younger and older individuals. It should be noted that a simple comparison of polymorphism frequencies between elderly and younger cohorts is susceptible to artifacts due to population stratification or admixture, birth cohort differences, and secular trends (16,17). A combination of population-based and family-based methods is one strategy to control for the differences in polymorphism frequencies between the generations, which may be related to stratification.
Additionally, findings from one association study are often difficult to replicate in subsequent independent studies. Among the issues surrounding association studies (lack of statistical power due to sample sizes, phenotypic and genetic heterogeneity of the samples), special attention should be paid to the extent and degree of linkage disequilibrium between the markers tested and the causal variants (130). Most previously reported candidate gene studies tested only one or a small number of polymorphisms within or near the candidate gene that were chosen merely because they were the only ones that were identified previously or that were relatively easy to measure (130). Because of the unequal distribution of linkage disequilibrium pattern in the human genome, studies testing one or a few markers are likely to produce inconsistent results (126), produce a high proportion of false-positive results, and are inadequate to make a definitive conclusion (130).
The number of genes involved in the determination of aging is likely to be very large, given multiple pathways for maintenance systems of an organism (131). Table 3 presents studies that show evidence for the influence of some of the many possible genes on human aging. We focused on the genes that may influence the rate of aging globally (some researchers even extrapolate to calling them “longevity genes” and “gerontogenes”) rather than those that only regulate aging of certain systems. Candidate genes are often proposed with very few arguments supporting their biological role in aging. It should be clear that the rapidity of genetic discoveries may significantly change this list, and other candidates will be emerging during the time this paper is published. Several useful sources of data on the candidate genes are available, such as GenAge (132) and Genetics of Longevity Consortium Database (133).
Table 3.
Studies of the Association of the Proposed Candidate Genes With Longevity of Aging in Humans
| Pathway, Gene (Chromosome) | Sample | Finding | Reference |
|---|---|---|---|
| Blood pressure regulation | |||
| ACE | 338 French centenarians vs adults (aged 20–70 y) | II genotype is more frequent in centenarians | (137) |
| (DCP1) | Brazil Gaucha, aged 10–104 y | Decreased II frequency at age >60 y | (138) |
| (17q23) | 684 Danish twins, age 73+ y | Relative risk of dying was increased in II genotype | (139) |
| Lipid metabolism mediation | |||
| ApoE | 338 French centenarians vs adults (aged 20–70 y) | ε4 allele was less frequent in centenarians than in controls; ε2 allele was reciprocally increased | (137) |
| (19q13.2) | 94 nonagenarians, 6 centenarians vs 100 young adults (age 18–25 y), U.S. | Same as above | (140) |
| 177 Danish centenarians and 40-year-old men | Average relative mortality risk was lower for ε2 allele | (141) | |
| CETP | Ashkenazi Jews with exceptional longevity and their offspring | Probands and offspring had increased homozygosity for VV genotype (I-405-V), compared with controls | (15) |
| (16q21) | 256 Japanese centenarians and 190 healthy younger controls | No association with longevity | (142) |
| PONI | 256 healthy French men (69.8 ± 4.0 y) | gln192-to-arg (Q192R) polymorphism was associated with the biological age (Arg allele had biological age lower than chronological age) | (26) |
| (7q21) | Italian, 308 centenarians (100.8 ± 2.1 y) vs 579 young (40.7 ± 12.7 y): Irish, 296 octo/nonagenarians (89.8 ± 5.7 y) vs 296 adolescent (13.0 ± 1.4 y) | Significant difference in haplotype 192R/55L frequency between older and younger individuals | (143) |
| Stress response | |||
| HSP70-1 | Southern Italian (263 males and 328 females; range 18–109 y) | Age-related decrease of the allele A frequency in −110A > C promoter region polymorphism in females | (144) |
| (6p21.3) | Danish twins, both sexes (mean age 75.6 y, range 70–91 y) | Association between low self-rated health and heterozygosity for −110A > C polymorphism | (145) |
| Growth hormone/insulin/growth factors axis | |||
| IGF-1 | 900 adults (Rotterdam Study) | In noncarriers of the 192-bp allele in promoter, relative risk increased for type 2 diabetes and myocardial infarction | (146) |
| (12q22-q24.1) | Elderly women (Rotterdam Study) | Baseline bone mineral density lower and bone loss higher in noncarriers of the 192-bp allele | (147) |
| Inflammation | |||
| IL-6 | Octo-/nonagenarians vs young controls (Belfast Study) | Frequency of IL-6-174 G/G decreases with age by ~ 10% | (148) |
| (7p21) | 250 Finnish nonagenarians vs 400 healthy blood donors (18–60 y) | No statistically significant differences in IL-6–174 G/G genotype distributions | (149) |
| Modulation of energy production | |||
| KL | Czechs, U.S. Caucasians, and U.S. African Americans | KL-VS homozygotes were underrepresented in the elderly | (150) |
| (13q12) | Mouse model: deficient gene expression | Short life span, infertility, arteriosclerosis, skin atrophy, osteoporosis, and emphysema | (151) |
| DNA methylation | |||
| MTHFR | Dutch, 365 elderly (85+ y) vs younger (18–40 y) | 677T/T (Val/Val) genotype underrepresented in the elderly men | (152) |
| (1p36) | Swiss, healthy younger (n = 118) and older (n = 106) subjects | 677T allele was 1.4 times less frequent in older individuals | (153) |
| Epigenetic gene silencing | |||
| SIRT3 (11p15.5) | Italian males | G477T genotype TT increases, while GT genotype decreases survival in the elderly individuals | (125) |
| DNA helicases and exonucleases | |||
| WRN (8p12-p11.2) | Finnish newborns (n = 183), Finnish centenarians (n = 176), Mexican newborns (n = 183) | Age-dependent decline of 1074Phe/Phe genotype of 1074Leu/Phe polymorphism | (154) |
Note: ACE = angiotensin I-converting enzyme; ApoE = apolipoprotein E; CETP = cholestery 1 ester transfer protein; DCP1 = dipeptidy 1 carboxypeptidase 1; HSP70-1 = heat shock protein; IGF-I = insulin-like growth factor I; IL-6 = interleukin 6; KL = Klotho gene; MTHFR = methylenetetrahydrofolate reductase; PONI = paraoxonase; WRN = Werner syndrome gene; SIRT3 = sirtuin 3.
Candidate genes may be classified according to pathways of their biological actions (132); note that some overlap may exist between the pathways and/or groups. The following pathways contain the most promising candidate genes: blood pressure regulation, lipid metabolism, growth hormone/insulin/growth factors axis, inflammation, DNA methylation, epigenetic gene silencing (including DNA helicases and exonucleases), antioxidant enzymes, and genes involved in the stress response (Table 3). In addition, multiple telomere maintenance factors [telomeric repeat-binding factors (TRF) 1 and 2, tankyrase 1, protection of telomeres 1 (POT1), telomere reverse transcriptase (TERT), telomerase RNA component (TERC), TRF 1-interacting nuclear factor 2 (TIN2), TRF2-interacting telomeric protein (RAP1)], as well as antioxidant enzymes (superoxide dismutases Sod1 and Sod2), should be mentioned. A number of studies have examined the potential role in longevity of other genes, such as apolipoprotein A1 (APOA-I), apolipoprotein C3 (APOC-III), apolipoprotein A4 (APOA-IV), plasminogen activator inhibitor type I (PAI-1), and SHC transforming protein (SHC1), with conflicting results (26,134). It has been also suggested that mitochondrial mutations might be one of the causes of aging. We have chosen not to review data related to mitochondrial DNA, but rather focused only on nuclear candidate genes. A continuous effort is being made to search for additional candidate genes, based on what we already know about aging-related processes and novel clinical observations. For example, newly emerging genes such as peroxisome proliferator-activated receptor γ (PPARG) and forkhead transcription factors (e.g., FOXO), are in functional pathways of the candidate genes proposed here (Sir2 homologs). These may become attractive targets for the regulation of biological age as well as biomarkers of aging. Future studies in genetic epidemiology of biological age should focus on incorporating genetic profiles with other biomarkers of aging into models predicting important health outcomes.
Conclusions
Human aging is a complex and irreversible process that is genetically determined and influenced by the environment (122). The study of aging genetics in humans is an enormous challenge. The complexity of the aging phenotype and the challenges inherent in the study of human aging oblige researchers to resort to models and extrapolations. Because different individual rates of the aging process lead to differences between chronological and biological age, the deviation between the actual age and age predicted using validated measurements may be one approach to estimating the biological age of an individual. An interdisciplinary approach is needed to further develop reliable methods of biological age evaluation and to validate this phenotype as a predictor of important health outcomes of aging. The development of a biological age estimate using a combination of reliable quantitative biomarkers will also provide an instrument for assessing the effectiveness of any experimental manipulation or intervention in human aging (23,32). The search for genes which contribute to aging will benefit from the development of such a measure of biological aging of an organism as a whole (39).
Empirically, not all valid biomarkers proposed in one study may be replicated in other samples, due to missing measurement or differences in technique. Until a consensus on a minimal set of biomarkers is achieved, it would be premature to recommend the use of biological age for changes in policy such as life insurance, elderly driving, and retirement benefits. Differences between ethnic and geographical groups, both in terms of their biological age (at a given age) and its rate of change, as well as genetic effects of aging-related genes in different races, are almost totally unexplored. Similarly, the extent to which biological age interacts with sex is not clearly established (1).
A fruitful future area of investigation in gerontology should focus on incorporating genetic profiles (variations in gene sequence and expression) along with other biomarkers of aging into prediction of health outcomes. Comprehensive studies, combining molecular genetic approaches with genetic epidemiology, gene expression profiling, proteomics, and functional genomic technology, will greatly accelerate the pace of discovery of genetic causes of aging (23). From a medical point of view, the endpoints of anti-aging therapy are clear: extending a healthy life span and maintaining and improving individual well-being, both physical and psychological (39), with the ultimate aim of exploring new ways of halting or delaying the onslaught of functional decline in elderly persons (23). Genotype information can be particularly useful in case–control studies (17); ultimately, results of these studies will lead to developing novel intervention strategies, such as personalized geriatric medicine seeking to slow aging (45). It should become possible to assess a genetic risk profile for individuals that will enable them to rationally alter their lifestyle (135). Continuous efforts should be made to develop batteries of candidate genes and biomarkers of aging. As pointed out by Le Bourg: “Aging can be delayed if the right tool is discovered” (136).
Acknowledgments
Address correspondence to David Karasi, PhD, Hebrew Rehabilitation Center for Aged, Research and Training Institute, 1200 Centre Street, Boston, MA 02131. E-mail: karasik@mail.hrca.harvard.edu
References
- 1.Shephard R. Constitution or Environment? In: Shephard R, ed. Gender, Physical Activity, and Aging Boca Raton (FL): CRC Press; 2002:151–174.
- 2.Tominaga K, Olgun A, Smith JR, Pereira-Smith OM. Genetics of cellular senescence. Mech Ageing Dev. 2002;123:927–936. doi: 10.1016/s0047-6374(02)00030-1. [DOI] [PubMed] [Google Scholar]
- 3.Finkel D, Whitfield K, McGue M. Genetic and environmental influences on functional age: a twin study. J Gerontol B Psychol Sci Soc Sci. 1995;50:P104–P113. doi: 10.1093/geronb/50b.2.p104. [DOI] [PubMed] [Google Scholar]
- 4.McGue M, Vaupel JW, Holm N, Harvald B. Longevity is moderately heritable in a sample of Danish twins born 1870–1880. J Gerontol. 1993;48:B237–B244. doi: 10.1093/geronj/48.6.b237. [DOI] [PubMed] [Google Scholar]
- 5.Herskind AM, McGue M, Holm NV, Sorensen TI, Harvald B, Vaupel JW. The heritability of human longevity: a population-based study of 2872 Danish twin pairs born 1870–1900. Hum Genet. 1996;97:319–323. doi: 10.1007/BF02185763. [DOI] [PubMed] [Google Scholar]
- 6.Mitchell BD, Hsueh WC, King TM, Pollin TI, Sorkin J, Agarwala R, et al. Heritability of life span in the Old Order Amish. Am J Med Genet. 2001;102:346–352. doi: 10.1002/ajmg.1483. [DOI] [PubMed] [Google Scholar]
- 7.Yashin AI, Iachine IA, Harris JR. Half of the variation in susceptibility to mortality is genetic: findings from Swedish twin survival data. Behav Genet. 1999;29:11–19. doi: 10.1023/a:1021481620934. [DOI] [PubMed] [Google Scholar]
- 8.Yashin AI, Iachine IA. Genetic analysis of durations: correlated frailty model applied to survival of Danish twins. Genet Epidemiol. 1995;12:529–538. doi: 10.1002/gepi.1370120510. [DOI] [PubMed] [Google Scholar]
- 9.Scott W, Gaskell P, Jackson C, Haines JL, Pericak-Vance MA. Combinatorial mismatch scan for successful aging loci in the Amish. Am J Hum Genet. 2003;73:124. [Google Scholar]
- 10.Reed T, Dick DM, Uniacke SK, Foroud T, Nichols WC. Genome-wide scan for a healthy aging phenotype provides support for a locus near D4S1564 promoting healthy aging. J Gerontol A Biol Sci Med Sci. 2004;59:B227–B232. doi: 10.1093/gerona/59.3.b227. [DOI] [PubMed] [Google Scholar]
- 11.Brand FN, Kiely DK, Kannel WB, Myers RH. Family patterns of coronary heart disease mortality: the Framingham Longevity Study. J Clin Epidemiol. 1992;45:169–174. doi: 10.1016/0895-4356(92)90009-c. [DOI] [PubMed] [Google Scholar]
- 12.Terry DF, Wilcox M, McCormick MA, Lawler E, Perls TT. Cardiovascular advantages among the offspring of centenarians. J Gerontol A Biol Sci Med Sci. 2003;58:M425–M431. doi: 10.1093/gerona/58.5.m425. [DOI] [PubMed] [Google Scholar]
- 13.Barzilai N, Gabriely I, Gabriely M, Iankowitz N, Sorkin JD. Offspring of centenarians have a favorable lipid profile. J Am Geriatr Soc. 2001;49:76–79. doi: 10.1046/j.1532-5415.2001.49013.x. [DOI] [PubMed] [Google Scholar]
- 14.Evert J, Lawler E, Bogan H, Perls T. Morbidity profiles of centenarians: survivors, delayers, and escapers. J Gerontol A Biol Sci Med Sci. 2003;58:232–237. doi: 10.1093/gerona/58.3.m232. [DOI] [PubMed] [Google Scholar]
- 15.Barzilai N, Atzmon G, Schechter C, et al. Unique lipoprotein phenotype and genotype associated with exceptional longevity. JAMA. 2003;290:2030–2040. doi: 10.1001/jama.290.15.2030. [DOI] [PubMed] [Google Scholar]
- 16.Geesaman BJ, Benson E, Brewster SJ, et al. Haplotype-based identification of a microsomal transfer protein marker associated with the human lifespan. Proc Natl Acad Sci U S A. 2003;100:14115–14120. doi: 10.1073/pnas.1936249100. [DOI] [PMC free article] [PubMed] [Google Scholar]
- 17.Hadley E, Rossi W, Albert S, et al. Genetic epidemiologic studies on age-specified traits. Am J Epidemiol. 2000;152:1003–1008. doi: 10.1093/aje/152.11.1003. [DOI] [PubMed] [Google Scholar]
- 18.Duggirala R, Uttley M, Willams K, Arya R, Blangero J, Crawford M. Genetic determination of biological age in the Mennonites of the Midwestern United States. Genet Epidemiol. 2002;23:97–109. doi: 10.1002/gepi.1126. [DOI] [PubMed] [Google Scholar]
- 19.Puca A, Daly M, Brewster S, et al. A genome-wide scan for linkage to human exceptional longevity identifies a locus on chromosome 4. Proc Natl Acad Sci U S A. 2001;98:10505–10508. doi: 10.1073/pnas.181337598. [DOI] [PMC free article] [PubMed] [Google Scholar]
- 20.Jackson AU, Galecki AT, Burke DT, Miller RA. Mouse loci associated with life span exhibit sex-specific and epistatic effects. J Gerontol Biol Sci. 2002;57A:B9–B15. doi: 10.1093/gerona/57.1.b9. [DOI] [PubMed] [Google Scholar]
- 21.Finkel D, Pedersen NL, Berg S, Johansson B. Quantitative genetic analysis of biobehavioral markers of aging in Swedish studies of adult twins. J Aging Health. 2000;12:47–68. doi: 10.1177/089826430001200103. [DOI] [PubMed] [Google Scholar]
- 22.Terry DF, Wilcox MA, McCormick MA, Perls TT. Cardiovascular disease delay in centenarian offspring. J Gerontol A Biol Sci Med Sci. 2004;59:385–389. doi: 10.1093/gerona/59.4.m385. [DOI] [PubMed] [Google Scholar]
- 23.Helfand SL, Inouye SK. Rejuvenating views of the ageing process. Nat Rev Genet. 2002;3:149–153. doi: 10.1038/nrg726. [DOI] [PubMed] [Google Scholar]
- 24.Anstey K, Lord S, Smith G. Measuring human functional age: A review of empirical findings. Exp Aging Res. 1996;22:245–266. doi: 10.1080/03610739608254010. [DOI] [PubMed] [Google Scholar]
- 25.Mitnitski AB, Graham JE, Mogilner AJ, Rockwood K. Frailty, fitness and late-life mortality in relation to chronological and biological age. BMC Geriatr. 2002;2:1. doi: 10.1186/1471-2318-2-1. [DOI] [PMC free article] [PubMed] [Google Scholar]
- 26.Xia Y, Gueguen R, Vincent-Viry M, Siest G, Visvikis S. Effect of six candidate genes on early aging in a French population. Aging Clin Exp Res. 2003;15:111–116. doi: 10.1007/BF03324487. [DOI] [PubMed] [Google Scholar]
- 27.Karasik D, Hannan MT, Cupples LA, Felson DT, Kiel DP. Genetic contribution to biological aging: the Framingham Study. J Gerontol Biol Sci Med Sci. 2004;59A:218–226. doi: 10.1093/gerona/59.3.b218. [DOI] [PMC free article] [PubMed] [Google Scholar]
- 28.Borkan GA, Norris AH. Assessment of biological age using a profile of physical parameters. J Gerontol. 1980;35:177–184. doi: 10.1093/geronj/35.2.177. [DOI] [PubMed] [Google Scholar]
- 29.Uttley M, Crawford M. Efficacy of a composite biological age score to predict ten-year survival among Kansas and Nebraska Mennonites. Hum Biol. 1994;66:121–144. [PubMed] [Google Scholar]
- 30.Seeman E, Hopper J. Genetic and environmental components of the population variance in bone density. Osteoporos Int. 1997;7(Suppl 3):S10–S16. doi: 10.1007/BF03194336. [DOI] [PubMed] [Google Scholar]
- 31.Dean W, Morgan RF. In defense of the concept of biological aging measurement–current status. Arch Gerontol Geriatr. 1988;7:191–210. doi: 10.1016/0167-4943(88)90002-7. [DOI] [PubMed] [Google Scholar]
- 32.Warner HR. Current status of efforts to measure and modulate the biological rate of aging. J Gerontol Biol Sci Med Sci. 2004;59A:692–696. doi: 10.1093/gerona/59.7.b692. [DOI] [PubMed] [Google Scholar]
- 33.Ingram DK, Nakamura E, Smucny D, Roth GS, Lane MA. Strategy for identifying biomarkers of aging in long-lived species. Exp Gerontol. 2001;36:1025–1034. doi: 10.1016/s0531-5565(01)00110-3. [DOI] [PubMed] [Google Scholar]
- 34.Seeman TE, McEwen BS, Rowe JW, Singer BH. Allostatic load as a marker of cumulative biological risk: MacArthur studies of successful aging. Proc Natl Acad Sci U S A. 2001;98:4770–4775. doi: 10.1073/pnas.081072698. [DOI] [PMC free article] [PubMed] [Google Scholar]
- 35.Bulpitt CJ, Shipley MJ, Broughton PM, et al. The assessment of biological age: a report from the Department of Environment Study. Aging (Milano) 1994;6:181–191. doi: 10.1007/BF03324236. [DOI] [PubMed] [Google Scholar]
- 36.Guinot C, Malvy DJ, Ambroisine L, et al. Relative contribution of intrinsic vs extrinsic factors to skin aging as determined by a validated skin age score. Arch Dermatol. 2002;138:1454–1460. doi: 10.1001/archderm.138.11.1454. [DOI] [PubMed] [Google Scholar]
- 37.Benetos A, Okuda K, Lajemi M, et al. Telomere length as an indicator of biological aging: the gender effect and relation with pulse pressure and pulse wave velocity. Hypertension. 2001;37(2 Part 2):381–385. doi: 10.1161/01.hyp.37.2.381. [DOI] [PubMed] [Google Scholar]
- 38.Rikkert M. Visual estimation of biological age of elderly subjects: good interrater agreement. Gerontology. 1999;45:165–167. doi: 10.1159/000022080. [DOI] [PubMed] [Google Scholar]
- 39.Aviv A. Hypothesis: pulse pressure and human longevity. Hypertension. 2001;37:1060–1066. doi: 10.1161/01.hyp.37.4.1060. [DOI] [PubMed] [Google Scholar]
- 40.Sell DR, Lane MA, Johnson WA, et al. Longevity and the genetic determination of collagen glycoxidation kinetics in mammalian senescence. Proc Natl Acad Sci U S A. 1996;93:485–490. doi: 10.1073/pnas.93.1.485. [DOI] [PMC free article] [PubMed] [Google Scholar]
- 41.Bulpitt CJ, Rajkumar C, Cameron JD. Vascular compliance as a measure of biological age. J Am Geriatr Soc. 1999;47:657–663. doi: 10.1111/j.1532-5415.1999.tb01586.x. [DOI] [PubMed] [Google Scholar]
- 42.Fisher AL. Of worms and women: sarcopenia and its role in disability and mortality. J Am Geriatr Soc. 2004;52:1185–1190. doi: 10.1111/j.1532-5415.2004.52320.x. [DOI] [PubMed] [Google Scholar]
- 43.Jackson SH, Weale MR, Weale RA. Biological age–what is it and can it be measured? Arch Gerontol Geriatr. 2003;36:103–115. doi: 10.1016/s0167-4943(02)00060-2. [DOI] [PubMed] [Google Scholar]
- 44.Sehl ME, Yates FE. Kinetics of human aging: I. Rates of senescence between ages 30 and 70 years in healthy people. J Gerontol Biol Sci. 2001;56A:B198–B208. doi: 10.1093/gerona/56.5.b198. [DOI] [PubMed] [Google Scholar]
- 45.Butler RN, Sprott R, Warner H, et al. Aging: the reality: biomarkers of aging: from primitive organisms to humans. J Gerontol Biol Sci. 2004;59A:B560–B567. doi: 10.1093/gerona/59.6.b560. [DOI] [PubMed] [Google Scholar]
- 46.Nakamura E, Lane MA, Roth GS, Ingram DK. A strategy for identifying biomarkers of aging: further evaluation of hematology and blood chemistry data from a calorie restriction study in rhesus monkeys. Exp Gerontol. 1998;33:421–443. doi: 10.1016/s0531-5565(97)00134-4. [DOI] [PubMed] [Google Scholar]
- 47.Brant LJ, Verbeke GN. Describing the natural heterogeneity of aging using multilevel regression models. Int J Sports Med. 1997;18 (Suppl 3):S225–S231. doi: 10.1055/s-2007-972719. [DOI] [PubMed] [Google Scholar]
- 48.Nakamura E, Miyao K. Further evaluation of the basic nature of the human biological aging process based on a factor analysis of age-related physiological variables. J Gerontol Biol Sci Med Sci. 2003;58A:196–204. doi: 10.1093/gerona/58.3.b196. [DOI] [PubMed] [Google Scholar]
- 49.Miller RR, Zhang Y, Silliman RA, et al. Effect of medical conditions on improvement in self-reported and observed functional performance of elders. J Am Geriatr Soc. 2004;52:217–223. doi: 10.1046/j.0002-8614.2004.52057.x. [DOI] [PubMed] [Google Scholar]
- 50.Seeman TE, Singer BH, Rowe JW, Horwitz RI, McEwen BS. Price of adaptation-allostatic load and its health consequences. MacArthur studies of successful aging. Arch Intern Med. 1997;157:2259–2268. [PubMed] [Google Scholar]
- 51.Karlamangla AS, Singer BH, McEwen BS, Rowe JW, Seeman TE. Allostatic load as a predictor of functional decline. MacArthur studies of successful aging. J Clin Epidemiol. 2002;55:696–710. doi: 10.1016/s0895-4356(02)00399-2. [DOI] [PubMed] [Google Scholar]
- 52.McClearn GE, Vogler GP, Hofer SM. Environment-gene and gene-gene interactions. In: Masoro EJ, Austad SN, eds. Handbook of the Biology of Aging 5th Ed. San Francisco, CA: Academic Press; 2001:423–444.
- 53.Stevens J. Applied Multivariate Statistics for the Social Sciences Hillsdale, NJ: Lawrence Erlbaum Associates; 1986.
- 54.Brant L, Fozard J, Metter E. Age differences in biological markers of mortality. In: Balin A, ed. Practical Handbook of Human Biologic Age Determination Boca Raton, FL: CRC Press; 1994:457–470.
- 55.Simonsick EM, Kasper JD, Guralnik JM, et al. Severity of upper and lower extremity functional limitation: scale development and validation with self-report and performance-based measures of physical function. WHAS Research Group. Women’s Health and Aging Study. J Gerontol Psychol Sci Soc Sci. 2001;56B:S10–S19. doi: 10.1093/geronb/56.1.s10. [DOI] [PubMed] [Google Scholar]
- 56.Lord SR, Ward JA, Williams P, Anstey KJ. Physiological factors associated with falls in older community-dwelling women. J Am Geriatr Soc. 1994;42:1110–1117. doi: 10.1111/j.1532-5415.1994.tb06218.x. [DOI] [PubMed] [Google Scholar]
- 57.Finkel D, Pedersen NL, Reynolds CA, Berg S, De Faire U, Svartengren M. Genetic and environmental influences on decline in biobehavioral markers of aging. Behav Genet. 2003;33:107–123. doi: 10.1023/a:1022549700943. [DOI] [PubMed] [Google Scholar]
- 58.Mackey RH, Sutton-Tyrrell K, Vaitkevicius PV, et al. Correlates of aortic stiffness in elderly individuals: a subgroup of the Cardiovascular Health Study. Am J Hypertens. 2002;15(1 Pt 1):16–23. doi: 10.1016/s0895-7061(01)02228-2. [DOI] [PubMed] [Google Scholar]
- 59.Frontera WR, Hughes VA, Fielding RA, Fiatarone MA, Evans WJ, Roubenoff R. Aging of skeletal muscle: a 12-yr longitudinal study. J Appl Physiol. 2000;88:1321–1326. doi: 10.1152/jappl.2000.88.4.1321. [DOI] [PubMed] [Google Scholar]
- 60.Frederiksen H, Gaist D, Petersen HC, et al. Hand grip strength: a phenotype suitable for identifying genetic variants affecting mid-and late-life physical functioning. Genet Epidemiol. 2002;23:110–122. doi: 10.1002/gepi.1127. [DOI] [PubMed] [Google Scholar]
- 61.Rantanen T, Volpato S, Ferrucci L, Heikkinen E, Fried LP, Guralnik JM. Handgrip strength and cause-specific and total mortality in older disabled women: exploring the mechanism. J Am Geriatr Soc. 2003;51:636–641. doi: 10.1034/j.1600-0579.2003.00207.x. [DOI] [PubMed] [Google Scholar]
- 62.Zhang Y, Niu J, Kelly-Hayes M, Chaisson CE, Aliabadi P, Felson DT. Prevalence of symptomatic hand osteoarthritis and its impact on functional status among the elderly: The Framingham Study. Am J Epidemiol. 2002;156:1021–1027. doi: 10.1093/aje/kwf141. [DOI] [PubMed] [Google Scholar]
- 63.Zeleznik J. Normative aging of the respiratory system. Clin Geriatr Med. 2003;19:1–18. doi: 10.1016/s0749-0690(02)00063-0. [DOI] [PubMed] [Google Scholar]
- 64.Kuzuya M, Ando F, Iguchi A, Shimokata H. Changes in serum lipid levels during a 10 year period in a large Japanese population. A cross-sectional and longitudinal study. Atherosclerosis. 2002;163:313–320. doi: 10.1016/s0021-9150(02)00009-6. [DOI] [PubMed] [Google Scholar]
- 65.Volpato S, Zuliani G, Guralnik JM, Palmieri E, Fellin R. The inverse association between age and cholesterol level among older patients: the role of poor health status. Gerontology. 2001;47:36–45. doi: 10.1159/000052768. [DOI] [PubMed] [Google Scholar]
- 66.Fukagawa NK, Li M, Liang P, Russell JC, Sobel BE, Absher PM. Aging and high concentrations of glucose potentiate injury to mitochondrial DNA. Free Radic Biol Med. 1999;27:1437–1443. doi: 10.1016/s0891-5849(99)00189-6. [DOI] [PubMed] [Google Scholar]
- 67.Larrabee GJ, Crook TH., III Estimated prevalence of age-associated memory impairment derived from standardized tests of memory function. Int Psychogeriatr. 1994;6:95–104. doi: 10.1017/s1041610294001663. [DOI] [PubMed] [Google Scholar]
- 68.de Jager CA, Milwain E, Budge M. Early detection of isolated memory deficits in the elderly: the need for more sensitive neuropsychological tests. Psychol Med. 2002;32:483–491. doi: 10.1017/s003329170200524x. [DOI] [PubMed] [Google Scholar]
- 69.Elias MF, Elias PK, D’Agostino RB, Silbershatz H, Wolf PA. Role of age, education, and gender on cognitive performance in the Framingham Heart Study: community-based norms. Exp Aging Res. 1997;23:201–235. doi: 10.1080/03610739708254281. [DOI] [PubMed] [Google Scholar]
- 70.Richardson E, Marottoli R. Education-specific normative data on common neuropsychological indices for individuals older than 75 years. Clin Neuropsychol. 1996;10:375–381. [Google Scholar]
- 71.Plato C, Fox K, Tobin J. Skeletal Changes in Human Aging New York: Oxford University Press: 1994.
- 72.Manolagas SC. Birth and death of bone cells: basic regulatory mechanisms and implications for the pathogenesis and treatment of osteoporosis. Endocr Rev. 2000;21:115–137. doi: 10.1210/edrv.21.2.0395. [DOI] [PubMed] [Google Scholar]
- 73.Mosekilde L. Trabecular microarchitccture and aging. In: Orwoll E, ed. Osteoporosis in Men San Diego, CA: Academic Press: 1999:313–332.
- 74.Kveiborg M, Flyvbjerg A, Rattan SI, Kassem M. Changes in the insulin-like growth factor-system may contribute to in vitro age-related impaired osteoblast functions. Exp Gerontol. 2000;35:1061–1074. doi: 10.1016/s0531-5565(00)00125-x. [DOI] [PubMed] [Google Scholar]
- 75.Nagy IZ. On the true role of oxygen free radicals in the living state, aging, and degenerative disorders. Ann N Y Acad Sci. 2001;928:187–199. doi: 10.1111/j.1749-6632.2001.tb05649.x. [DOI] [PubMed] [Google Scholar]
- 76.Kiel DP. Adult bone maintenance. In: Marcus R, ed. Atlas of Clinical Endocrinology. III. Osteoporosis Philadelphia. PA: Current Medicine; 2000:29–39.
- 77.Karasik D, Arensburg B, Tillier AM, Pavlovsky O. Skeletal age assessment of fossil hominids. J Archaeol Sci. 1998;25:689–696. [Google Scholar]
- 78.Rothschild B, Sebes J, Rothschild C. Antiquity of arthritis: spondyloarthropathy identified in the Palcocene of North America. Clin Exp Rheumatol. 1998;16:573–575. [PubMed] [Google Scholar]
- 79.Hak A, Pols H, van Hemert A, Hofman A, Witteman J. Progression of aortic calcification is associated with metacarpal bone loss during menopause: a population-based longitudinal study. Arterioscler Thromb Vasc Biol. 2000;20:1926–1931. doi: 10.1161/01.atv.20.8.1926. [DOI] [PubMed] [Google Scholar]
- 80.Kiel DP, Kauppila LI, Cupples LA, Hannan MT, O’Donnell CJ, Wilson PW. Bone loss and the progression of abdominal aortic calcification over a 25 year period: the Framingham Heart Study. Calcif Tissue Int. 2001;68:271–276. doi: 10.1007/BF02390833. [DOI] [PubMed] [Google Scholar]
- 81.Zhang Y, Kiel D, Kreger B, et al. Bone mass and the risk of breast cancer among postmenopausal women. N Engl J Med. 1997;336:611–617. doi: 10.1056/NEJM199702273360903. [DOI] [PubMed] [Google Scholar]
- 82.Samelson EJ, Kiel DP, Broe KE, et al. Metacarpal cortical area and risk of coronary heart disease: the Framingham Study. Am J Epidemiol. 2004;159:589–595. doi: 10.1093/aje/kwh080. [DOI] [PubMed] [Google Scholar]
- 83.Johansson C, Black D, Johnell O, Oden A, Mellstroem D. Bone mineral density is a predictor of survival. Calcif Tissue Int. 1998;63:190–196. doi: 10.1007/s002239900513. [DOI] [PubMed] [Google Scholar]
- 84.Van Der Klift M, Pols HA, Geleijnse JM, Van Der Kuip DA, Hofman A, De Laet CE. Bone mineral density and mortality in elderly men and women: the Rotterdam Study. Bone. 2002;30:643–648. doi: 10.1016/s8756-3282(02)00670-1. [DOI] [PubMed] [Google Scholar]
- 85.Cerhan JR, Wallace RB, el-Khoury GY, Moore TE, Long CR. Decreased survival with increasing prevalence of full-body, radiographically defined osteoarthritis in women. Am J Epidemiol. 1995;141:225–234. doi: 10.1093/oxfordjournals.aje.a117424. [DOI] [PubMed] [Google Scholar]
- 86.Haara MM, Manninen P, Kroger H, et al. Osteoarthritis of finger joints in Finns aged 30 or over: prevalence, determinants, and association with mortality. Ann Rheum Dis. 2003;62:151–158. doi: 10.1136/ard.62.2.151. [DOI] [PMC free article] [PubMed] [Google Scholar]
- 87.Bauer DC, Palermo L, Black D, Cauley JA. Quantitative ultrasound and mortality: a prospective study. Osteoporos Int. 2002;13:606–612. doi: 10.1007/s001980200081. [DOI] [PubMed] [Google Scholar]
- 88.Seeman E. The structural basis of bone fragility in men. Bone. 1999;25:143–147. doi: 10.1016/s8756-3282(99)00117-9. [DOI] [PubMed] [Google Scholar]
- 89.Benjamin M, Rufai A, Ralphs J. The mechanism of formation of bony spurs (enthesophytes) in the Achilles tendon. Arthritis Rheum. 2000;43:576–583. doi: 10.1002/1529-0131(200003)43:3<576::AID-ANR14>3.0.CO;2-A. [DOI] [PubMed] [Google Scholar]
- 90.Dodds R, Gowen M. The growing osteophyte–a model system for the study of human bone-development and remodeling in-situ. J Histotechnol. 1994;17:37–45. [Google Scholar]
- 91.Calvo E, Palacios I, Delgado E, et al. High-resolution MRI detects cartilage swelling at the early stages of experimental osteoarthritis. Osteoarthritis Cartilage. 2001;9:463–472. doi: 10.1053/joca.2001.0413. [DOI] [PubMed] [Google Scholar]
- 92.Kallman D, Wigley F, Scott W, Hochberg M, Tobin J. New radiographic grading scales for osteoarthritis of the hand. Arthritis Rheum. 1989;32:1584–1591. doi: 10.1002/anr.1780321213. [DOI] [PubMed] [Google Scholar]
- 93.Guralnik JM, Ferrucci L. Assessing the building blocks of function: utilizing measures of functional limitation. Am J Prev Med. 2003;25 (3 Suppl 2):112–121. doi: 10.1016/s0749-3797(03)00174-0. [DOI] [PubMed] [Google Scholar]
- 94.Pavlovsky O, Kobyliansky E. Population Biology of Human Aging Firenze, Italy: Angelo Pontecorboli Press; 1999.
- 95.Kobyliansky E, Karasik D, Vainder M, Pavlovsky O, Livshits G. Comparative analysis of roentgenological methods for bone age evaluation using hand bones. Anthropologie (Brno) 1996;34:277–297. [Google Scholar]
- 96.Kobyliansky E, Livshits G, Pavlovsky O. Population biology of human aging: methods of assessment and sex variation. Hum Biol. 1995;67:87–109. [PubMed] [Google Scholar]
- 97.Karasik D, Pavlovsky O, Batsevich V, Livshits G, Kobyliansky E. Use of the hand bones roentgenographs in the prediction of age in nine human populations. Anthropol Anz. 2000;58:199–204. [PubMed] [Google Scholar]
- 98.Aviv A. Chronology versus biology: telomeres, essential hypertension, and vascular aging. Hypertension. 2002;40:229–232. doi: 10.1161/01.hyp.0000027280.91984.1b. [DOI] [PubMed] [Google Scholar]
- 99.Fraser GE, Shavlik DJ. Ten years of life: is it a matter of choice? Arch Intern Med. 2001;161:1645–1652. doi: 10.1001/archinte.161.13.1645. [DOI] [PubMed] [Google Scholar]
- 100.Nuzhdin SV, Pasyukova EG, Dilda CL, Zeng ZB, Mackay TF. Sex-specific quantitative trait loci affecting longevity in Drosophila melanogaster. Proc Natl Acad Sci U S A. 1997;94:9734–9739. doi: 10.1073/pnas.94.18.9734. [DOI] [PMC free article] [PubMed] [Google Scholar]
- 101.Lane D, Beevers DG, Lip GY. Ethnic differences in blood pressure and the prevalence of hypertension in England. J Hum Hypertens. 2002;16:267–273. doi: 10.1038/sj.jhh.1001371. [DOI] [PubMed] [Google Scholar]
- 102.Chandalia M, Abate N, Cabo-Chan AV, Jr, Devaraj S, Jialal I, Grundy SM. Hyperhomocysteinemia in Asian Indians living in the United States. J Clin Endocrinol Metab. 2003;88:1089–1095. doi: 10.1210/jc.2002-021133. [DOI] [PubMed] [Google Scholar]
- 103.Jones RN. Racial bias in the assessment of cognitive functioning of older adults. Aging Ment Health. 2003;7:83–102. doi: 10.1080/1360786031000045872. [DOI] [PubMed] [Google Scholar]
- 104.Karasik D, Cupples LA, Hannan MT, Kiel DP. Genome screen for a combined bone phenotype using principal component analysis: the Framingham study. Bone. 2004;34:547–556. doi: 10.1016/j.bone.2003.11.017. [DOI] [PubMed] [Google Scholar]
- 105.Demissie S, Cupples L, Myers R, Aliabadi P, Levy D, Felson D. Genome scan for quantity of hand osteoarthritis: the Framingham Study. Arthritis Rheum. 2002;46:946–952. doi: 10.1002/art.10149. [DOI] [PubMed] [Google Scholar]
- 106.Livshits G, Vainder M, Pavlovsky O, Kobyliansky E. Population biology of human aging: segregation analysis of bone aging characteristics. Hum Biol. 1996;68:539–554. [PubMed] [Google Scholar]
- 107.Kraft P, Bauman L, Yuan JY, Horvath S. Multivariate variance-components analysis of longitudinal blood pressure measurements from the Framingham Heart Study. BMC Genet. 2003;4 (Suppl 1):S55. doi: 10.1186/1471-2156-4-S1-S55. [DOI] [PMC free article] [PubMed] [Google Scholar]
- 108.Wilk JB, DeStefano AL, Joost O, et al. Linkage and association with pulmonary function measures on chromosome 6q27 in the Framingham Heart Study. Hum Mol Genet. 2003;12:2745–2751. doi: 10.1093/hmg/ddg311. [DOI] [PubMed] [Google Scholar]
- 109.Mathias RA, Roy-Gagnon MH, Justice CM, et al. Comparison of year-of-exam- and age-matched estimates of heritability in the Framingham Heart Study data. BMC Genet. 2003;4 (Suppl 1):S36. doi: 10.1186/1471-2156-4-S1-S36. [DOI] [PMC free article] [PubMed] [Google Scholar]
- 110.McClearn GE, Johansson B, Berg S, et al. Substantial genetic influence on cognitive abilities in twins 80 or more years old. Science. 1997;276:1560–1563. doi: 10.1126/science.276.5318.1560. [DOI] [PubMed] [Google Scholar]
- 111.Rogers J, Mahaney MC, Almasy L, Comuzzie AG, Blangero J. Quantitative trait linkage mapping in anthropology. Am J Phys Anthropol. 1999;42:127–151. doi: 10.1002/(sici)1096-8644(1999)110:29+<127::aid-ajpa5>3.0.co;2-t. [DOI] [PubMed] [Google Scholar]
- 112.Karasik D, Hannan M, Cupples L, Myers R, Kiel D. Chromosomal mapping of quantitative trait loci for normal bone mineral density: the Framingham Study. Osteoporos Int. 2002;13:S11–S11. [Google Scholar]
- 113.Elias MF, Wolf PA, D’Agostino RB, Cobb J, White LR. Untreated blood pressure level is inversely related to cognitive functioning: the Framingham Study. Am J Epidemiol. 1993;138:353–364. doi: 10.1093/oxfordjournals.aje.a116868. [DOI] [PubMed] [Google Scholar]
- 114.Hannan MT, Felson DT, Dawson-Hughes B, et al. Risk factors for longitudinal bone loss in elderly men and women: the Framingham Osteoporosis Study. J Bone Miner Res. 2000;15:710–720. doi: 10.1359/jbmr.2000.15.4.710. [DOI] [PubMed] [Google Scholar]
- 115.Webster IW, Logie AR. A relationship between functional age and health status in female subjects. J Gerontol. 1976;31:546–550. doi: 10.1093/geronj/31.5.546. [DOI] [PubMed] [Google Scholar]
- 116.Lacroix A, Guralnik J, Berkman L, Wallace R, Satterfield S. Maintaining mobility in late-life: 2. Smoking, alcohol-consumption, physical-activity, and body-mass index. Am J Epidemiol. 1993;137:858–869. doi: 10.1093/oxfordjournals.aje.a116747. [DOI] [PubMed] [Google Scholar]
- 117.Howitz KT, Bitterman KJ, Cohen HY, Lamming DW, Lavu S, Wood JG, et al. Small molecule activators of sirtuins extend Saccharomyces cerevisiae lifespan. Nature. 2003;425:191–196. doi: 10.1038/nature01960. [DOI] [PubMed] [Google Scholar]
- 118.Lord SR, Ward JA, Williams P, Strudwick M. The effect of a 12-month exercise trial on balance, strength, and falls in older women: a randomized controlled trial. J Am Geriatr Soc. 1995;43:1198–1206. doi: 10.1111/j.1532-5415.1995.tb07394.x. [DOI] [PubMed] [Google Scholar]
- 119.Lee IM, Hsieh CC, Paffenbarger RS., Jr Exercise intensity and longevity in men. The Harvard Alumni Health Study. JAMA. 1995;273:1179–1184. [PubMed] [Google Scholar]
- 120.Felson D, Couropmitree N, Chaisson C, et al. Evidence for Mendelian gene in a segregation analysis of generalized radiographic osteoarthritis. Arthritis Rheum. 1998;41:1064–1071. doi: 10.1002/1529-0131(199806)41:6<1064::AID-ART13>3.0.CO;2-K. [DOI] [PubMed] [Google Scholar]
- 121.Weber JL, May PE. Abundant class of human DNA polymorphisms which can be typed using the polymerase chain reaction. Am J Hum Genet. 1989;44:388–396. [PMC free article] [PubMed] [Google Scholar]
- 122.Tarnopolsky MA, Parisi G. Aging and sarcopenia: influences of gender and physical activity. In: Shephard R, ed. Gender, Physical Activity, and Aging Boca Raton, FL: CRC Press; 2002:151–174.
- 123.Kayo T, Allison DB, Weindruch R, Prolla TA. Influences of aging and caloric restriction on the transcriptional profile of skeletal muscle from rhesus monkeys. Proc Natl Acad Sci U S A. 2001;98:5093–5098. doi: 10.1073/pnas.081061898. [DOI] [PMC free article] [PubMed] [Google Scholar]
- 124.Weindruch R, Kayo T, Lee CK, Prolla TA. Gene expression profiling of aging using DNA microarrays. Mech Ageing Dev. 2002;123:177–193. doi: 10.1016/s0047-6374(01)00344-x. [DOI] [PubMed] [Google Scholar]
- 125.Rose G, Dato S, Altomare K, et al. Variability of the SIRT3 gene, human silent information regulator Sir2 homologue, and survivorship in the elderly. Exp Gerontol. 2003;38:1065–1070. doi: 10.1016/s0531-5565(03)00209-2. [DOI] [PubMed] [Google Scholar]
- 126.Allison DB, Miller RA, Austad SN, et al. Genetic variability in responses to caloric restriction in animals and in regulation of metabolism and obesity in humans. J Gerontol Biol Sci Med Sci. 2001;56A(Spec Issue 1):55–65. doi: 10.1093/gerona/56.suppl_1.55. [DOI] [PubMed] [Google Scholar]
- 127.Finch CE, Stanford CB. Meat-adaptive genes and the evolution of slower aging in humans. Q Rev Biol. 2004;79:3–50. doi: 10.1086/381662. [DOI] [PubMed] [Google Scholar]
- 128.Ly DH, Lockhart DJ, Lerner RA, Schultz PG. Mitotic misregulation and human aging. Science. 2000;287:2486–2492. doi: 10.1126/science.287.5462.2486. [DOI] [PubMed] [Google Scholar]
- 129.McCarroll SA, Murphy CT, Zou S, et al. Comparing genomic expression patterns across species identifies shared transcriptional profile in aging. Nat Genet. 2004;36:197–204. doi: 10.1038/ng1291. [DOI] [PubMed] [Google Scholar]
- 130.Shen H, Liu Y, Liu P, Recker RR, Deng H. Nonreplication in genetic studies of complex diseases–lessons learned from studies of osteoporosis and tentative remedies. J Bone Min Res. 2005;20:365–376. doi: 10.1359/JBMR.041129. [DOI] [PubMed] [Google Scholar]
- 131.Holliday R. The multiple and irreversible causes of aging. J Gerontol A Biol Sci Med Sci. 2004;59:B568–B572. doi: 10.1093/gerona/59.6.b568. [DOI] [PubMed] [Google Scholar]
- 132.Human Ageing Genomic Resources. Genetic Basis of Ageing. Available at: http://genomics.senescence.info/genes/index.html Accessed March 2, 2005.
- 133.California Pacific Medical Center Research Institute. The Longevity Consortium: Sharing Genetic Research on Aging. Available at: http://www.longevityconsortium.org/resources/ Accessed March 3, 2005.
- 134.Mooijaart SP, van Heemst D, Schreuder J, et al. Variation in the SHC1 gene and longevity in humans. Exp Gerontol. 2004;39:263–268. doi: 10.1016/j.exger.2003.10.001. [DOI] [PubMed] [Google Scholar]
- 135.Helmberg A. DNA-microarrays: novel techniques to study aging and guide gerontologic medicine. Exp Gerontol. 2001;36:1189–1198. doi: 10.1016/s0531-5565(01)00091-2. [DOI] [PubMed] [Google Scholar]
- 136.Le Bourg E. Delaying aging: could the study of hormesis be more helpful than that of the genetic pathway used to survive starvation? Biogerontology. 2003;4:319–324. doi: 10.1023/a:1026255519223. [DOI] [PubMed] [Google Scholar]
- 137.Schachter F, Faure-Delanef L, Guenot F, et al. Genetic associations with human longevity at the APOE and ACE loci. Nat Genet. 1994;6:29–32. doi: 10.1038/ng0194-29. [DOI] [PubMed] [Google Scholar]
- 138.Da Cruz IB, Oliveira G, Tauter M, Leal NF, Schwanke CH, Glock L, et al. Angiotensin I-converting enzyme gene polymorphism in two ethnic groups living in Brazil’s southern region: association with age. J Gerontol A Biol Sci Med Sci. 2003;58:M851–M856. doi: 10.1093/gerona/58.9.m851. [DOI] [PubMed] [Google Scholar]
- 139.Frederiksen H, Gaist D, Bathum L, et al. Angiotensin I-converting enzyme (ACE) gene polymorphism in relation to physical performance, cognition and survival–a follow-up study of elderly Danish twins. Ann Epidemiol. 2003;13:57–65. doi: 10.1016/s1047-2797(02)00254-5. [DOI] [PubMed] [Google Scholar]
- 140.Zubenko GS, Stiffler JS, Hughes HB, III, Fatigati MJ, Zubenko WN. Genome survey for loci that influence successful aging: sample characterization, method validation, and initial results for the Y chromosome. Am J Geriatr Psychiatry. 2002;10:619–630. [PubMed] [Google Scholar]
- 141.Gerdes LU, Jeune B, Ranberg KA, Nybo H, Vaupel JW. Estimation of apolipoprotein E genotype-specific relative mortality risks from the distribution of genotypes in centenarians and middle-aged men: apolipoprotein E gene is a “frailty gene,” not a “longevity gene”. Genet Epidemiol. 2000;19:202–210. doi: 10.1002/1098-2272(200010)19:3<202::AID-GEPI2>3.0.CO;2-Q. [DOI] [PubMed] [Google Scholar]
- 142.Aral Y, Hirose N, Yamamura K, et al. Deficiency of choresteryl ester transfer protein and gene polymorphisms of lipoprotein lipase and hepatic lipase are not associated with longevity. J Mol Med. 2003;81:102–109. doi: 10.1007/s00109-002-0407-6. [DOI] [PubMed] [Google Scholar]
- 143.Rea IM, McKeown PP, McMaster D, et al. Paraoxonase polymorphisms PONI 192 and 55 and longevity in Italian centenarians and Irish nonagenarians. A pooled analysis. Exp Gerontol. 2004;39:629–635. doi: 10.1016/j.exger.2003.11.019. [DOI] [PubMed] [Google Scholar]
- 144.Altomare K, Greco V, Bellizzi D, et al. The allele (A)(−110) in the promoter region of the HSP70-1 gene is unfavorable to longevity in women. Biogerontology. 2003;4:215–220. doi: 10.1023/a:1025182615693. [DOI] [PubMed] [Google Scholar]
- 145.Singh R, Kolvraa S, Bross P, et al. Association between low self-rated health and heterozygosity for −110A > C polymorphism in the promoter region of HSP70-1 in aged Danish twins. Biogerontology. 2004;5:169–176. doi: 10.1023/B:BGEN.0000031154.57176.4f. [DOI] [PubMed] [Google Scholar]
- 146.Vaessen N, Heutink P, Janssen JA, et al. A polymorphism in the gene for IGF-I: functional properties and risk for type 2 diabetes and myocardial infarction. Diabetes. 2001;50:637–642. doi: 10.2337/diabetes.50.3.637. [DOI] [PubMed] [Google Scholar]
- 147.Rivadeneira F, Houwing-Duistermaat JJ, Vaessen N, et al. Association between an insulin-like growth factor I gene promoter polymorphism and hone mineral density in the elderly: the Rotterdam Study. J Clin Endocrinol Metab. 2003;88:3878–3884. doi: 10.1210/jc.2002-021813. [DOI] [PubMed] [Google Scholar]
- 148.Rea IM, Ross OA, Armstrong M, et al. Interleukin-6-gene C/G 174 polymorphism in nonagenarian and octogenarian subjects in the BELFAST study. Reciprocal effects on IL-6, soluble IL-6 receptor and for IL-10 in serum and monocyte supernatants. Mech Ageing Dev. 2003;124:555–561. doi: 10.1016/s0047-6374(03)00036-8. [DOI] [PubMed] [Google Scholar]
- 149.Wang XY, Hurme M, Jylha M, Hervonen A. Lack of association between human longevity and polymorphisms of IL-1 cluster, IL-6, IL-10 and TNF-alpha genes in Finnish nonagenarians. Mech Ageing Dev. 2001;123:29–38. doi: 10.1016/s0047-6374(01)00338-4. [DOI] [PubMed] [Google Scholar]
- 150.Arking DE, Krebsova A, Macek M, Sr, et al. Association of human aging with a functional variant of klotho. Proc Natl Acad Sci U S A 22. 2002;99:856–861. doi: 10.1073/pnas.022484299. [DOI] [PMC free article] [PubMed] [Google Scholar]
- 151.Kuro-o M, Matsumura Y, Aizawa H, et al. Mutation of the mouse klotho gene leads to a syndrome resembling ageing. Nature. 1997;390:45–51. doi: 10.1038/36285. [DOI] [PubMed] [Google Scholar]
- 152.Heijmans B, Westendorp R, Slagboom P. Common gene variants, mortality and extreme longevity in humans. Exp Gerontol. 2000;35:865–877. doi: 10.1016/s0531-5565(00)00171-6. [DOI] [PubMed] [Google Scholar]
- 153.Todesco L, Angst C, Litynski P, Loehrer F, Fowler B, Haefeli WE. Methylenetetrahydrofolate reductase polymorphism, plasma homocysteine and age. Eur J Clin Invest. 1999;29:1003–1009. doi: 10.1046/j.1365-2362.1999.00578.x. [DOI] [PubMed] [Google Scholar]
- 154.Castro E, Edland SD, Lee L, et al. Polymorphisms at the Werner locus: II. 1074Leu/Phe, 1367Cys/Arg, longevity, and atherosclerosis. Am J Med Genet. 2000;95:374–380. [PubMed] [Google Scholar]