

Abstract
A PRESS localization 1H MRS acquisition sequence with a Carr–Purcell train of refocusing pulses (CP-PRESS) has been implemented using global refocusing “sandwich” pulses. The CP pulse train minimized the effects of J-coupled dephasing in metabolites with strongly coupled, multiplet resonance groups as demonstrated in both phantom data and in vivo single-voxel spectroscopy in normal volunteers. Metabolites with multiplet resonance patterns were maintained with greater signal to noise and a simpler resonance pattern at long echo times. T2 decay times for metabolites with singlet and multiplet resonances were similar to published values, except for the NAA multiplet at 2.5 ppm, which had a significantly shorter T2 value (147 ms) than that typically reported for the singlet at 2.01 ppm. Metabolite-nulled spectra were acquired in normal volunteers to evaluate the effects of CP-PRESS on baseline signal contributions from residual water, lipids, and macromolecules. The T2 decay times in four baseline regions in data acquired with the CP-PRESS sequence showed longer decays than corresponding regions in metabolite-nulled spectra from a standard PRESS sequence, but were significantly diminished long before the metabolites of interest were gone. The spectral analysis for spectra with longer TE times also showed less variability due the higher metabolite SNR, simpler spectral patterns, and the decreased baseline contributions.
Keywords: in vivo MR spectroscopy, Carr; Purcell, J-coupling, parametric spectral analysis, short TE
Multiplet resonances from strongly coupled spins decrease rapidly with echo time in a spin echo MR spectroscopy (MRS) experiment due to destructive interactions between resonances with J-coupled induced phasing. A short TE observation is therefore required to capture these signals at sufficient SNR for accurate analysis; however, short TE in vivo proton spectra typically include significant baseline contributions from macromolecules, residual water, and lipid signals, which complicate analysis and quantification of the spectrum. Baseline signal contributions typically have shorter T2 decay times than metabolites and thus are less of a problem for acquisitions with echo times of around 70 ms or longer. However, most metabolites with strongly coupled multiplet resonance patterns have insufficient SNR for reliable measurement by the time a significant portion of the baseline signal contributions has decayed away.
Previous work has shown that a Carr–Purcell (CP) pulse train with a short interpulse interval can be used to preserve strongly coupled resonance patterns (1,2) and singlet resonances (3) at long TE. Hennig et al. (2) has used the CPRESS sequence to maintain the coherence of multiplet structures in metabolites such as glutamate (Glu), glutamine (Gln) and myo-Inositol (mI) out to TE values beyond 135 ms. The CP pulses in this sequence were high-quality, slice-selective spin echo pulses which required high RF power and gradient strengths. High-quality pulses are required in order that the signals not degrade due to incomplete refocusing during the pulse train. However, a sufficiently long CP pulse train of high power pulses could exceed SAR limitations. As suggested in the CPRESS paper, global refocusing pulses can also be used in the CP pulse train, as was implemented in the CP-LASER sequence (3). However, this paper did not investigate the effects of these pulses for suppressing J-evolution in metabolites with multiplet resonances. In addition to the aforementioned, one other important step toward determining the utility of Carr–Purcell methods for the acquisition of in vivo metabolites with strongly coupled resonance groups and short T2 decays is the evaluations of the effects of the CP pulse train on baseline signal contributions from cerebral macromolecules and residual water and lipid signals.
In this study, it is demonstrated that a CP pulse train, making use of simple global (non-slice-selective) refocusing pulses, can be implemented within a PRESS localization sequence on a standard 1.5-T clinical system to minimize J-coupled dephasing and hence improve SNR for strongly coupled multiplet resonance groups. Spectral simulations were used to estimate the effects of this sequence on a variety of MR visible metabolites at 1.5 T and to provide basis functions to fit metabolite spectra to determine T2 decays from human volunteer data. Finally, the effect of the CP pulse train on baseline signals in regions containing macromolecules and residual lipids was investigated.
METHODS
CP-PRESS Pulse Sequence
A CP pulse train with global refocusing pulses was incorporated into a single-voxel PRESS sequence between the two refocusing pulses. A schematic for the sequence is shown in Fig. 1 and will be referred to hereafter as CP-PRESS. The global refocusing pulses were “sandwich pulses” (4,5) composed of rectangular RF pulse combinations of either 100x–200y–100x, designated R, or 100−x–200−y–100−x, designated &Racr; (Fig. 1a). The notation here is that 100x represents a 100° pulse applied along the x axis of the rotating frame. Individually, these pulses required less RF power and were shorter in duration than slice-selective or adiabatic refocusing pulses. This made a shorter pulse train echo spacing possible, which may be useful at higher fields. The sandwich pulses were organized into groups of four, labeled R1,2,3,4, based on an MLEV-16 phase cycling scheme to improve refocusing accuracy (Fig. 1b). Crusher gradients were employed between the Rn groups in the CP pulse train to reduce unwanted coherences. For clarity, crusher pulses are not displayed in Fig. 1c.
FIG. 1.
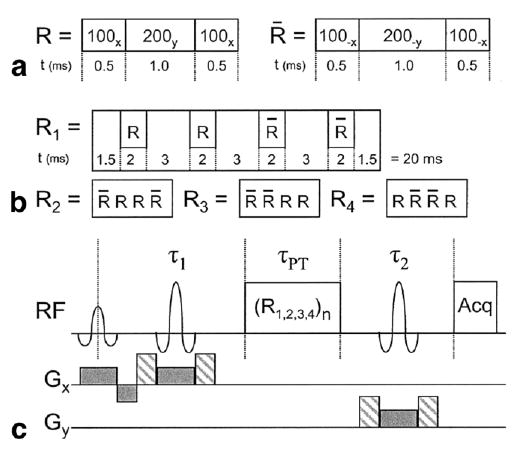
(a) Diagram of the R and &Racr; sandwich pulses used to improve global refocusing. (b) Phase cycling scheme for the R1–R4 groups based on MLEV-16 used to create CP pulse trains of varying lengths. (c) CP-PRESS sequence diagram where τ1 and τ2 are the periods typically added together to determine the echo time, TE, and τPT is the additional time period added by the CP pulse train. TEeff = τ1 + τ2 + τPT
Frequency profile simulations using MATPULSE (6) and spectral simulations using GAMMA (7) were performed to select the square pulse durations and tip angles and the interpulse delay between sandwich pulses. Pulse durations of 0.5 and 1 ms, respectively, achieved a refocusing pulse bandwidth of approximately 500 Hz. Tip angles of 100 and 200° were shown to have an improved phase response over 90 and 180° pulses as shown by the magnetization profiles in Fig. 2. A delay interval of 3 ms between sandwich pulses was determined, via simulation, to be sufficient to minimize J-coupled dephasing while decreasing the number of RF pulses and the SAR needed to achieve the desired effective echo times. With these timings, each group of four sandwich pulses was 20 ms long. The minimum TE achieved by the basic PRESS sequence was 26 ms. Echo times indicated in this report by TE were achieved by extending the standard τ1 and τ2 periods of the PRESS sequence. Echo times extended by including a CP pulse train with total time τPT within the τ1 and τ2 periods will be designated by TEeff (where TEeff = τ1 + τPT + τ2) to indicate that these results were obtained with a CP pulse train.
FIG. 2.
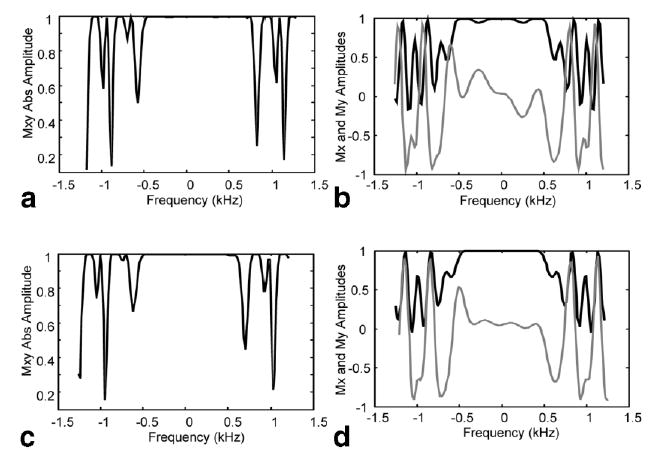
Absolute magnetization profiles and Mx and My magnetization profiles for a spin echo R&Racr; &Racr; R sequence with R sandwich tip angles of 90°–180°–90° (a, b) and 100°–200°–100° (c, d). Note the flatter response for the My magnetization (gray line) shown for (d) versus (b) across the central bandwidth of the refocusing pulse.
Phantom Data and Spectral Simulations
Spectra were obtained using the CP-PRESS sequence from two 300-mL phantoms, one with 200 mM Glu and another with 200 mM mI, with the following parameters: 8 cm3 voxel, TR = 4 s, 3906 Hz sweep width, and 16 averages. Spectra were acquired for TEeff values of 26, 46, 66, 86, 106, 126, and 146 ms. A water spectrum was also acquired for each TEeff, using 4 averages, which was used to correct for eddy current lineshape distortions (8,9). All data were taken at 1.5 T in a Marconi Edge MRI scanner.
Spectral simulations were performed using the GAMMA spectral library (7). Ideal 90 and 180° pulses were used to model CP-PRESS localization pulses, but rectangular pulses, identical to those in the actual pulse sequence, were used to model the CP pulse train. Simulations were run for N-acetylaspartate (NAA), creatine (Cr), choline (Cho), mI, Glu, Gln, taurine (Tau), and GABA for TEeff echo times from 26 to 146 ms. Simulation results were compared to phantom data acquisitions for Glu and mI.
TE Series and Metabolite Nulled Data Acquisitions
All data were taken at 1.5 T in a Marconi Edge MRI scanner. Six normal volunteers (ages 25– 45) were scanned with the CP-PRESS sequence using an 8 cm3 voxel in the parieto-occipital lobe. Voxels were positioned to contain primarily white matter but all contained at least some gray matter. Acquisition parameters were: TR = 1.5 s, 3906 Hz sweep width, and 256 averages. Spectra were acquired for TEeff values of 26, 66, 106, 146, 186, and 226 ms, respectively, and a water spectrum was also acquired for correction of eddy current lineshape distortions. For comparison, a series of PRESS acquisitions at the same TE values was also acquired. The spectra were fitted using the FITT method that iteratively uses a parametric metabolite estimation and nonparametric, wavelet estimation of baseline signals (10). Basis functions for the fitting algorithm were created using GAMMA spectral simulations. The natural log plots of metabolite areas were fitted to estimate T2 decays.
Four additional normal volunteers (ages 22–36) were scanned with a variation of the CP-PRESS sequence, which included an inversion pulse at the beginning of the sequence to obtain metabolite nulled data. The first volunteer was scanned initially using a range of inversion times (TI) to determine the best timing to null the singlet metabolite signals. An inversion time of 650 ms gave the optimal nulling of these signals. Metabolite nulled spectra acquisition parameters remained the same as above, except that only TEeff values of 26, 66, 106, and 146 ms were acquired. Four narrow spectral regions (2.65–2.8, 2.2–2.35, 1.5–1.7, and 0.8 –1.0 ppm) were selected that were known to contain residual water, macromolecules, or residual lipid signals. Spectra were manually phased using the water spectrum as a reference and the regions integrated. Natural log plots of the regional integrals were fitted to estimate T2 decays.
RESULTS AND DISCUSSION
In Fig. 3 are shown plots for the mI and Glu solution spectra (light lines) with GAMMA simulations (dark lines) overlaid. Spectral simulations were scaled manually to match the solution spectra. There was good correlation between the observed solution spectral patterns and the simulations for all TE values, although only two values of TEeff are displayed here. SNR for the multiplet resonances was well maintained out to TEeff = 146 ms due to the decrease in J-coupled phase modulation effects. The only decrease in scale seemed to be due to T2 decay, which was much longer in solution than in vivo. From the results of the spectral simulations, other metabolites that should show a similar reduction in J-coupling dephasing effects include Glu, Tau, and GABA.
FIG. 3.
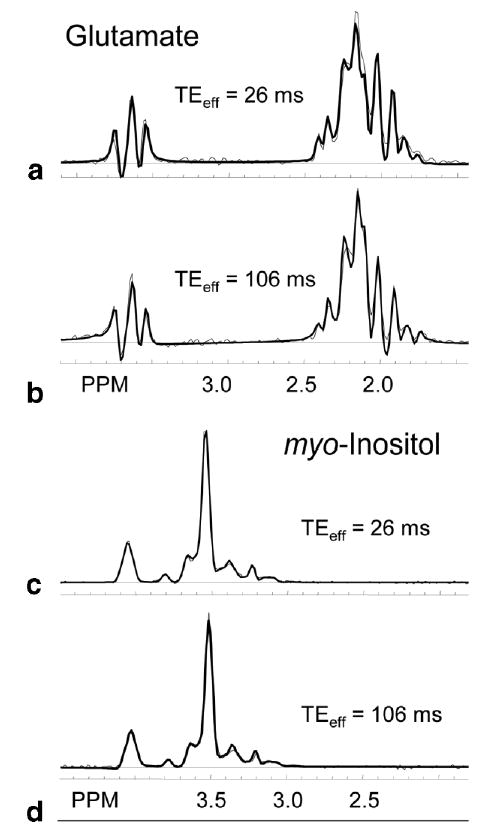
Spectral simulation (dark lines) comparison with metabolite phantom data (light lines) for glutamate (a, b) and myo-inositol (c, d) for no Carr–Purcell (CP) pulse train (a, c: TEeff = 26 ms) and a CP pulse train of four R groups (b, d: TEeff = 106 ms). Simulation amplitudes were manually adjusted to correspond to experimental data.
Side-by-side plots for in vivo PRESS and CP-PRESS spectra from the same voxel in one volunteer are shown in Fig. 4. The PRESS spectra show considerable reduction in the peak heights of the main mI multiplet (3.5 ppm) and Glu/Gln regions (2.5 ppm) due to J-coupling phase interactions as TE increases. The CP-PRESS acquisition shows only minor changes in these region even as far out as TEeff = 146 ms. Differences between adjacent CP-PRESS spectra were most likely due to changes in the underlying macromolecule or lipid contributions.
FIG. 4.
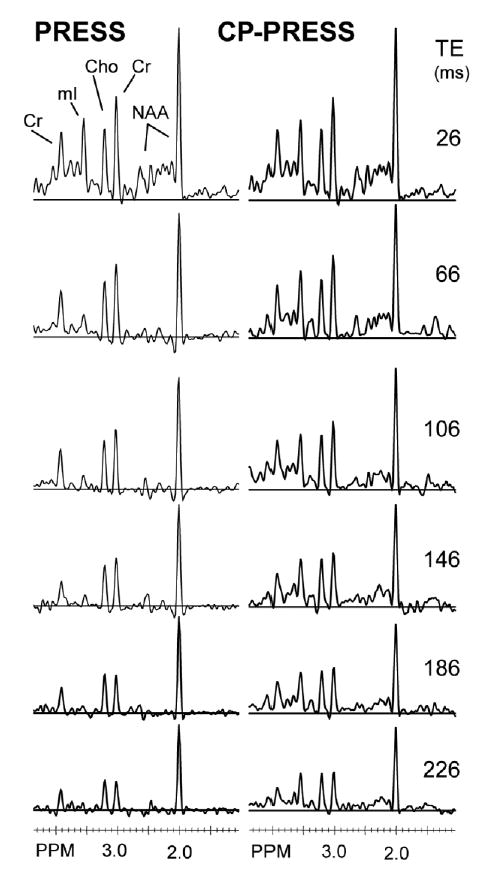
Example of data taken from a normal volunteer using the CP-PRESS sequence for six TEeff values (26, 66, 106, 146, 186, and 246 ms) and fitted to determine metabolite T2 decay times.
In vivo metabolite T2 calculation results (in milliseconds) are listed in Table 1. Group mean and standard deviations are shown. The data processing was facilitated by reductions in residual water and lipid signals at the longer TE times while the metabolite model optimization was improved due to increased metabolite signal coherence and simplification of the baseline contributions. All singlet T2 values (NAA, Cr, and Cho) agree well with, but were at the upper end of, published ranges (11).
Table 1.
Metabolite T2 Decay Values from Six Normal Volunteers for an 8-cm3 Voxel Placed in Occipital Mixed Gray–White Matter
| Metabolite T2 values (ms) | (mean ± SD) |
|---|---|
| NAA (singlet) | 416 ± 105 |
| NAA (multiplet) | 147 ± 32 |
| Cr | 271 ± 29 |
| Cho | 400 ± 15 |
| myo-Inositol | 363 ± 62 |
Note. Mean ± standard deviations are shown (in ms).
The measured T2 value for mI was somewhat higher than published values, but consistent across subjects. One cause for this could be that spectra at longer TE values need to be acquired to ensure an accurate fit to the decay. Another possible cause is that there may be an apparent increase in T2 caused by the Carr–Purcell train either due to suppression of diffusion or cross-relaxation effects (3,12,13).
Of particular note was the T2 value measured for the NAA multiplet (2.6 ppm). A separate basis function, independent of the NAA singlet (2.01 ppm), was used to fit this region. The resultant value, 147 ms, was consistent across all subjects and considerably shorter than the decay for the NAA singlet.
An example of metabolite-nulled CP-PRESS data taken from a normal volunteer is shown in Fig. 5. The spectrum at the top is a normal PRESS acquisition, TE = 26 ms, shown for reference. The remaining plots are for four TEeff decay times (26, 66, 106, and 147 ms). The baseline regions which were integrated to determine baseline decay constants are numbered and indicated in gray along the top spectrum. As can be seen in the CP-PRESS plots, most baseline signals had decayed away significantly by a TEeff of 106 ms. This is particularly true for the broad signals underlying metabolites of interest from 2.0 to 4.0 ppm. The signals seen for the CP-PRESS sequence in Fig. 3 for the same timings are thus most likely due to metabolite resonances.
FIG. 5.
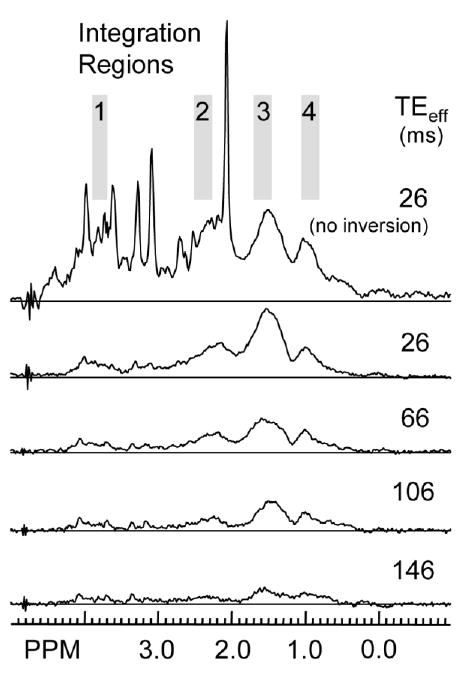
Example of metabolite nulled data taken from a normal volunteer using the CP-PRESS sequence with an initial inversion recovery pulse (TI = 650 ms) for four TEeff values (26, 66, 106, and 146 ms). The integration regions used to determine baseline T2 decay times are shaded and numbered 1 to 4. Note that the top plot is of a normal PRESS acquisition, TE = 26 ms, for reference.
Mean and standard deviations for the baseline region T2 decay times are shown in Table 2 for both the CP-PRESS and the PRESS sequences. While the baseline decay times for the PRESS sequence are shorter than those for the CP-PRESS sequence, both sets of decay values are shorter than those for metabolites (see Table 1). The increased baseline T2 decays seen in the CP-PRESS acquisitions could be due to a mixing of long and short T2 decays resonances, due to incompletely nulled metabolites, such as Glu, in regions 1 and 2. In regions 3 and 4, both of which contain signals from residual lipids, signals might have been maintained by the effects of the CP pulse train on saturated methylene groups (CH2) present in the fatty tissues (14).
Table 2.
T2 Decay Values Calculated for Four Baseline Regions in Metabolite-Nulled Spectra from Four Normal Volunteers for an 8-cm3 Voxel Placed in Parieto-occipital Mixed White–Gray Matter for both CP-PRESS and PRESS Acquisitions
|
T2 values (ms) from CP-PRESS
|
T2 values (ms) from PRESS
|
|||
|---|---|---|---|---|
| Baseline integration regions for T2 calculation | (mean ± SD) | R2 | (mean ± SD) | R2 |
| Region 1 (3.80–3.65 ppm) | 90.0 ± 4.6 | 0.97 | 36.6 ± 6.2 | 0.91 |
| Region 2 (2.35–2.20 ppm) | 73.3 ± 4.9 | 0.98 | 30.0 ± 8.5 | 0.84 |
| Region 3 (1.70–1.50 ppm) | 46.1 ± 6.5 | 0.94 | 46.1 ± 11.8 | 0.98 |
| Region 4 (1.00–0.80 ppm) | 89.2 ± 19.8 | 0.98 | 21.6 ± 8.6 | 0.98 |
Note. Mean and standard deviation decay values are shown (in ms). R2 values from the signal decay log-plot linear regression line estimates are also shown.
Regardless of the mechanism for the slight maintenance of the baseline signals, the fact that they still decay faster than metabolite resonances provides a significant opportunity for improving the quantitation of strongly coupled in vivo metabolites. The inclusion of this type of CP pulse train into standard clinical single-voxel MRS or MR spectroscopic imaging sequences is straightforward. Strongly coupled resonances (Glu and mI), which are metabolites of interest in several clinical research studies, have improved SNR and simplified resonance patterns, while singlet resonances are not affected. At moderately long TEeff (~100 ms), baseline contributions are minimal, but metabolite signals are still present and well distinguished. All of these characteristics should improve the estimation of spectral signal contributions by automated spectral analysis methods.
CONCLUSIONS
A PRESS localization 1H MRS acquisition sequence with a Carr–Purcell train of refocusing pulses (CP-PRESS) has been implemented on a standard MR scanner using easily implemented global refocusing sandwich pulses. The CP pulse train minimized the effects of J-coupled dephasing in metabolites with strongly coupled, multiplet resonance groups. This resulted in more signal being maintained with a simpler resonance pattern at long echo times. Baseline signal contributions from residual water, lipids, and macromolecules had somewhat longer apparent T2 decay times, but were significantly diminished long before the metabolites of interest were gone. Spectral analysis for spectra with longer TEeff times also showed less variability due the higher metabolite SNR, simpler spectral patterns, and the decreased baseline contributions. All told, the improvements obtained from the inclusion of the Carr–Purcell pulse train noticeably enhanced the ability to quantitate the strongly coupled metabolite signals seen in normal volunteers.
Acknowledgments
The authors thank James Murdoch for his technical expertise in implementing the RF pulse train.
References
- 1.Wells EJ, Gutowsky HS. NMR spin-echo trains for a coupled two-spin system. J Chem Phys. 1965;43:3414 –3415. [Google Scholar]
- 2.Hennig J, Thiel T, Speck O. Improved sensitivity to overlapping multiplet signals in in vivo proton spectroscopy using a multiecho volume selective (CPRESS) experiment. Magn Reson Med. 1997;37:816 – 820. doi: 10.1002/mrm.1910370603. [DOI] [PubMed] [Google Scholar]
- 3.Michaeli S, Garwood M, Zhu X-H, Delabarre L, Andersen P, Adriany G, Merkle H, Ugurbil K, Chen W. Proton T2 relaxation study of water, N-acetylaspartate, and creatine in human brain using Hahn and Carr–Purcell spin echoes at 4T and 7T. Magn Reson Med. 2002;47:629 – 633. doi: 10.1002/mrm.10135. [DOI] [PubMed] [Google Scholar]
- 4.Freeman R, Kempbell SP, Levitt ME. Radiofrequency pulse sequences which compensate their own imperfections. J Magn Reson. 1980;38:453– 479. doi: 10.1016/j.jmr.2011.08.032. [DOI] [PubMed] [Google Scholar]
- 5.Levitt MH. Symmetrical composite pulse sequences for NMR population inversion. II. Compensation of resonance offset. J Magn Reson. 1982;50:95–110. [Google Scholar]
- 6.Matson GB. An integrated program for amplitude-modulated RF pulse generation and re-mapping with shaped gradients. Magn Reson Imaging. 1994;12:1205–1225. doi: 10.1016/0730-725x(94)90086-7. [DOI] [PubMed] [Google Scholar]
- 7.Smith SA, Levante TO, Meier BH, Ernst RR. Computer simulations in magnetic resonance. An object-oriented programming approach. J Magn Reson A. 1994;106:75–105. [Google Scholar]
- 8.Ordidge RJ, Cresshull ID. The correction of transient B0 field shifts following the application of pulsed gradients by phase correction in the time domain. J Magn Reson. 1986;69:151–155. [Google Scholar]
- 9.Bartha R, Drost DJ, Menon RS, Williamson PC. Spectroscopic lineshape correction by QUECC: combined QUALITY deconvolution and eddy current correction. Magn Reson Med. 2000;44:641– 645. doi: 10.1002/1522-2594(200010)44:4<641::aid-mrm19>3.0.co;2-g. [DOI] [PubMed] [Google Scholar]
- 10.Soher BJ, Young K, Govindaraju V, Maudsley AA. Automated spectral analysis III: Application to in vivo proton MR spectroscopy and spectroscopic imaging. Magn Reson Med. 1998;40:822– 831. doi: 10.1002/mrm.1910400607. [DOI] [PubMed] [Google Scholar]
- 11.Kreis R. Quantitative localized 1H MR spectroscopy for clinical use. Prog Magn Reson Spec. 1997;31:155–195. [Google Scholar]
- 12.Makela H, Grohn O, Delabarre L, Michaeli S, Kauppinen RA, Garwood M. Intermolecular cross-relaxation during adiabatic pulses—implications for Carr–Purcell T2 contrast, In: Proceedings of the 11th Annual Meeting of ISMRM, Toronto, Canada, 2003.
- 13.Bartha R, Michaeli S, Merkle H, Adriany G, Andersen P, Chen W, Ugurbil K, Garwood M. In Vivo 1H2O T2 measurement in the human occipital lobe at 4T and 7T by Carr–Purcell MRI: detection of microscopic susceptibility contrast. Magn Reson Med. 2002;47:742–750. doi: 10.1002/mrm.10112. [DOI] [PubMed] [Google Scholar]
- 14.Henkelman RM, Hardy P, Bishop JE, Poon CS, Plewes DB. Why fat is bright in RARE and fast spin-echo imaging. J Magn Reson Imaging. 1992;2:533–540. doi: 10.1002/jmri.1880020511. [DOI] [PubMed] [Google Scholar]