Abstract
Echovirus 30 (EV30) is one of the most frequently isolated EVs, causing extensive outbreaks of EV30 aseptic meningitis in temperate climates. EV30 is antigenically heterogeneous, and three major antigenic groups have been defined, although the basis for the antigenic differences is unknown. A reverse transcription-nested PCR which amplifies the 3′-terminal region of the VP1 gene directly from clinical samples was selected for studying EV30 molecular epidemiology, since the major antigenic sites in this region reflect the serotypic pattern of this virus. The different previous approaches to the genetic classification of EV30 were analyzed. A complete study of the EV30 strains was performed by analyzing the sequences from the 112 EV30 strains amplified in this work and the complete set of EV30 strains previously published. A total of 318 strains of EV30 were divided into two broad genotypes (I and II). This classification was supported by the phylogenetic trees obtained from amino acid sequences, and it correlated with the antigenic heterogeneity of the reference strains described in earlier studies. The genotypes could be further divided into subgroups, and these subgroups could be divided into lineages based on their nucleotide distances and levels of bootstrapping. On the other hand, the subgroups and lineages did not result in the same correlation between amino acid and nucleotide differentiation. The molecular epidemiology of EV30 can be compared to influenza virus epidemiology, where prevailing lineages displace the less established lineages on the basis of immune escape. This pattern of evolution is clearly different from that of other enteroviruses. A single lineage at a time appears to be circulating worldwide. This behavior may be related to the epidemic activity of EV30.
Human enteroviruses (HEVs) are small RNA viruses of the Picornaviridae family. Genetic and phylogenetic analysis of the capsid-encoding region VP1 showed four clusters: (i) HEV-A, including 11 coxsackie A viruses (CAVs) and enterovirus 71; (ii) HEV-B, including all coxsackie B viruses (CBVs), all echoviruses (EVs), enterovirus 69, and CAV9; (iii) HEV-C, including all polioviruses and 11 other CAVs; and (iv) HEV-D, including enteroviruses 68 and 70. The common transmission routes may be direct, by fecal-oral and respiratory spread, and indirect, by fomites and contaminated water. Enterovirus infections generally go unnoticed, complicating their differential diagnosis. Infection occasionally leads to severe disorders such as meningitis, encephalitis, pleurodynia, myocarditis, conjunctivitis, or severe systemic infections in neonates (7).
Echovirus 30 (EV30) is one of the most frequently isolated EVs, causing extensive outbreaks of EV30 aseptic meningitis in temperate climates in several countries (10, 16). Additionally, this serotype is one of several enteroviruses associated with sporadic cases of aseptic meningitis (5). EV30 is antigenically heterogeneous, and three major antigenic groups have been defined (6, 17), although the basis for the antigenic differences is unknown. Previous studies of the molecular epidemiology of EV30 established four genotypes (designated 1 to 4) on the basis of VP1 sequences of 136 geographically dispersed EV30 strains isolated in 10 countries between 1956 and 1998 (10). This initial molecular classification derived from the phylogenetic clustering of the strains based on the bootstrapping robustness. Other researchers studied the molecular epidemiology of 112 European isolates of EV30 and presented a different classification into three genotypes (designated 1 to 3) and subdividing the last genotype into four new subgroups (a to d) (15). This second molecular division derived from the known genotype demarcation of 15% nucleotide distance in the 150-bp VP1/2A junction region used to study poliovirus molecular epidemiology (13).
The VP1 gene was selected for studying EV30 molecular epidemiology since the major antigenic sites in it reflect the serotypic pattern of this virus. Several reverse transcription-PCR (RT-PCR) methods have been developed to amplify and analyze this gene (2, 9, 11). We previously developed an RT-nested PCR which amplifies the 3′-terminal region of the VP1 gene directly from clinical samples (3). This method was used to study cerebrospinal fluid and stool samples from EV30-related outbreaks in Argentina and Spain, broadening the database of EV30 field isolates from South America and Europe. The different approaches in the genetic classification of EV were analyzed. The temporal dynamics and genetic diversity of EV30 and the molecular epidemiology of EV30-associated neurological disease are described.
MATERIALS AND METHODS
Patients and clinical specimens.
Clinical specimens consisted of 43 original samples and 69 EV30 isolates. The original samples and 59 isolates were obtained at the Services of Diagnostic Microbiology and Virology (Centro Nacional de Microbiología, Instituto de Salud Carlos III, Madrid, Spain). Original samples, consisting of 39 cerebrospinal fluid and 4 stool samples, were received for establishment of the etiological diagnosis of sporadic cases and outbreaks of acute meningitis during 1999 to 2000 in Spain. Six major waves of epidemic activity due to EV30 (four waves), EV9, EV6, and EV4 were established in Spain from 1988 to 2000 (16). The temporal distribution in Spain of EV30 meningitis outbreaks was as follows: 4 in 1992, 3 in 1994-1995, 9 in 1996-1997, 1 in 1998, 1 in 1999, and 10 in 2000. In order to compare the Spanish EV30 strains with the corresponding viruses in other temperate geographic areas, 10 selected EV30 isolates from central and western Argentina were included in the study. Isolates were obtained from the historical specimen collection of the Neurovirosis Division (National Institute of Infectious Disease, ANLIS “Dr Carlos G. Malbrán,” Buenos Aires, Argentina). Two outbreaks of EV30 occurring in two Argentinean cities, Chascomús (Buenos Aires province) and Mendoza (Mendoza province), in 1997 and 1998 were represented among these specimens.
Virus isolation and neutralization.
Strains of EV30 were isolated from 47 cerebrospinal fluid samples, 20 stool samples, and 2 nasopharyngeal aspirates. The American Type Culture Collection prototype strains Bastianni, PR-17, Giles, and Frater were included as controls. Cell culture was attempted for the majority of samples and all prototype strains. Aliquots were inoculated into human embryonic fibroblast, Buffalo green monkey kidney, human rhabdomyosarcoma, and human lung carcinoma (A549) cell lines. Isolates were typed by neutralization, incubation of the isolate with a panel of antiserum pools (Lim-Benyesh-Melnick immune serum pools), and subsequent evaluation of the inhibition of virus growth.
Extraction, amplification, and sequencing.
Nucleic acids from clinical samples and isolates were precipitated as previously described (4). The 3′-terminal region of VP1 was amplified using the RT-nested PCR method previously described (3).
Cycle sequencing reactions were performed using the Big Dye terminator kit (PE Applied Biosystems). Both forward and reverse reactions were carried out to eventually solve ambiguous positions.
The 3′-end nucleotide sequence of EV30 VP1 (420 bp in length, nucleotides 457 to 876) was selected. The position of the analyzed product corresponds to the sequence of the EV30 reference strain Bastianni. Original sequence data were firstly analyzed with CHROMAS software (version 1.3; C. McCarthy, 1996, Griffith University, Nathan, Queensland, Australia), and forward and reverse sequence data for each sample were aligned using the program MegAlign (DNASTAR Inc. Software, Madison, Wis.), to obtain the final consensus sequence.
Sequence analysis.
Multiple sequence alignments were performed with Clustal X. Phylogenetic analysis was performed using the Kimura two-parameter model as a model of nucleotide substitution and the neighbor joining method to reconstruct the phylogenetic tree (MEGA version 2.1 software package). The statistical significance of the phylogenies constructed was estimated by bootstrap analysis with 1,000 pseudoreplicate data sets. The distance matrix was recorded, and each of the pairwise observed distance values obtained was employed to obtain the histogram and pairwise sequence comparisons.
Nucleotide sequence accession number.
EV30 VP1 sequences were submitted to the GenBank sequence database under accession no. AF391858 to AF391971. Sequences AF127983 to AF128090, AF152866 to AF152891, and AF236388 to AF236635 were included in the analysis (10, 15).
RESULTS
Clustering of EV30 isolates.
A complete study of the EV30 strains was performed, by analyzing the sequences from the 112 EV30 strains amplified in this work and the complete set of EV30 strains previously published (10, 15). Fariña prototype EV21 was the nearest outgroup taxon, grouping monophyletically all EV30 strains as previously described (10).
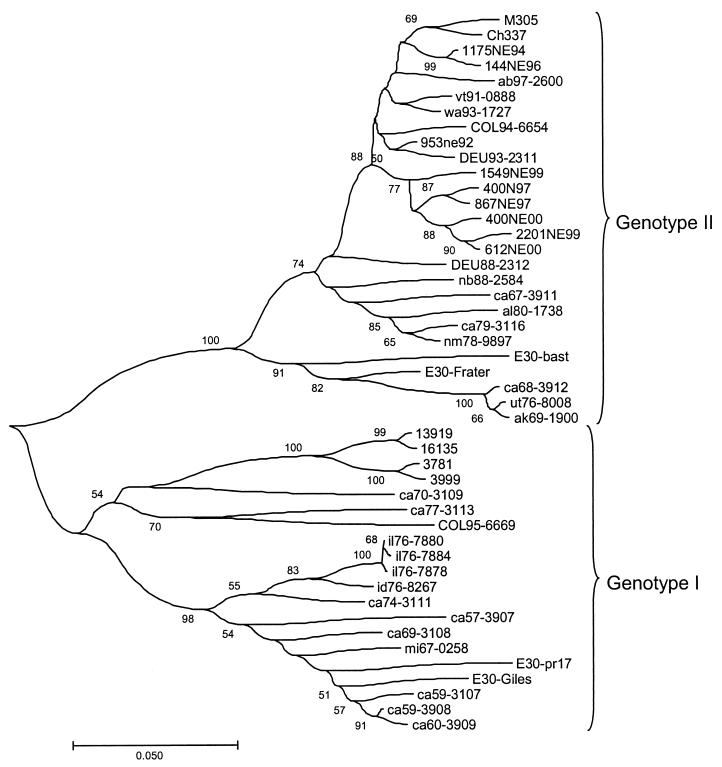
A subset of 47 representative EV30 strains which include the five prototype strains is displayed in the phylogenetic tree (Fig. 1). The same pattern could be found in analyzing the whole set of sequences. It is restricted to only 47 sequences for presentation purposes. EV30 sequences were divided into two major groups designated genotypes I and II. Genotype I included reference strains Giles, PR17, and Price, as well as 17 other sequences isolated from 1956 to 1995. The remaining sequences were grouped into genotype II. The prototype EV30 strains Bastianni and Frater and the Argentinean and Spanish strains were included in genotype II.
FIG. 1.
The set of nucleotide sequences analyzed was aligned with Clustal W. Phylogenetic analysis was performed using the Kimura two-parameter model as a model of nucleotide substitution and using the neighbor joining method to reconstruct the phylogenetic tree (MEGA version 2.1 software package). The statistical significance of the phylogenies constructed was estimated by bootstrap analysis with 1,000 pseudoreplicate data sets. For clarity, only a subset of 47 of the 318 strains that were sequenced is shown.
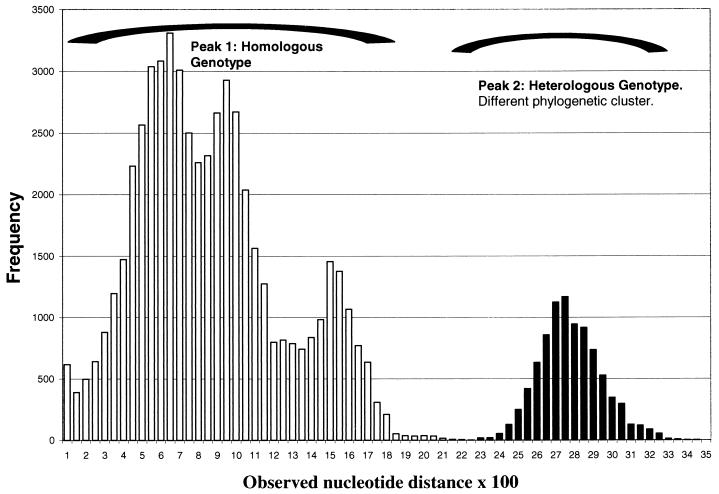
Pairwise sequence comparisons showed that all EV30 isolates differed from the Fariña EV21 prototype strain with observed nucleotide and amino acid distances higher than 0.28 and 0.12, respectively. Pairwise comparisons and confidence intervals among EV30 isolates are summarized in Table 1. Confidence intervals for genotypes I and II were 0.13 to 0.16 and 0.07 to 0.10, respectively, and that between genotypes was 0.22 to 0.31. The observed nucleotide difference distribution among all strains studied is shown in Fig. 2. The distribution of observed nucleotide differences was plotted as a histogram of score frequency to determine whether the genotype could be unambiguously assigned strictly on the basis of nucleotide identity scores.
TABLE 1.
Summary of pairwise nucleotide and amino acid sequence comparisons among EV30 isolatesa
| Group | Sequence differences within and between the indicated grouping:
|
|||||
|---|---|---|---|---|---|---|
| Nucleotide
|
Amino acid
|
|||||
| I | II | EV21 | I | II | EV21 | |
| I | 0.13-0.16 | 0.22-0.31 | 0.28-0.41 | 0.04-0.05 | 0.06-0.12 | 0.12-0.28 |
| II | 0.07-0.10 | 0.33-0.47 | 0.02-0.04 | 0.12-0.28 | ||
The data indicate the 95% confidence intervals of the observed nucleotide distances (Kimura model of substitution) or the observed amino acid distances (Poisson corrected).
FIG. 2.
Distribution of observed nucleotide distances. Peak 1 corresponds to comparisons of homologous strains (same genotype), and peak 2 corresponds to comparisons of heterologous strains (different genotype) of the same major phylogenetic cluster.
Amino acid differences were also distributed in the same way, and confidence intervals for genotypes I and II were 0.04 to 0.05 and 0.02 to 0.04, respectively, and that between genotypes was 0.06 to 0.12.
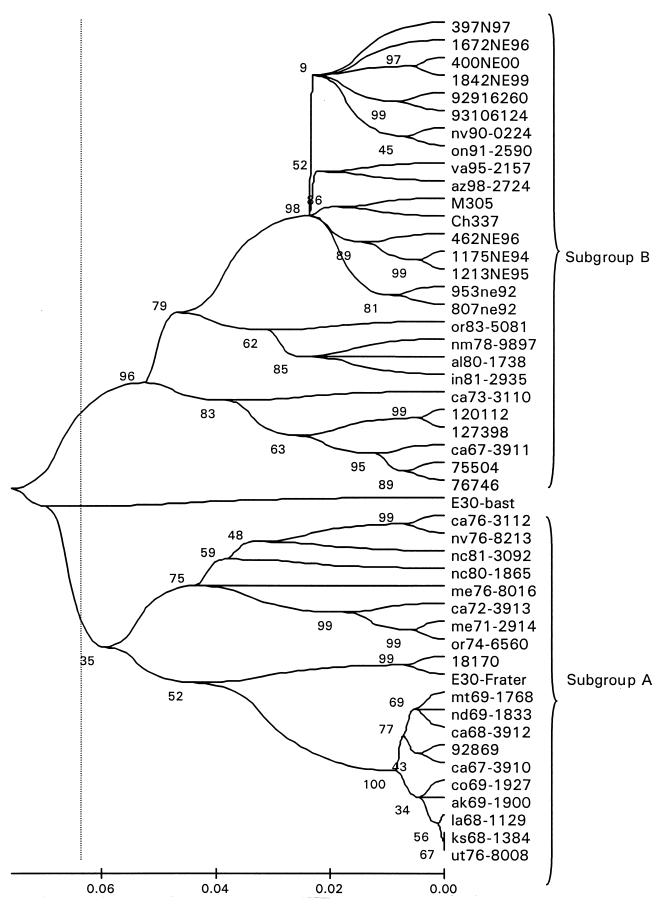
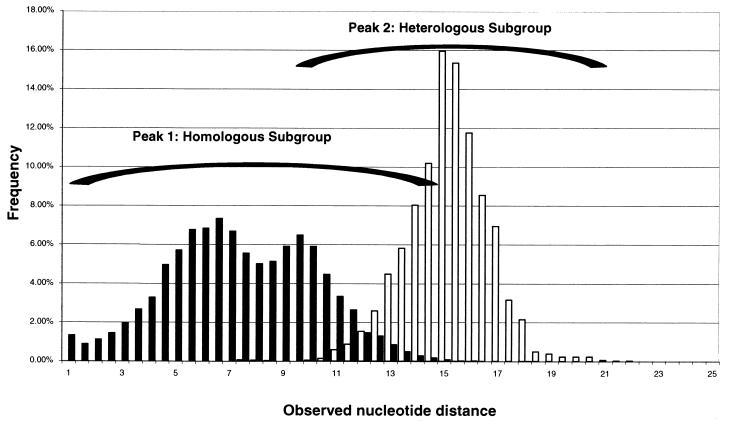
A more detailed analysis showed that genotype II could be further divided into three subgroups (A, B, and EV30 Bastianni strain [Fig. 3 and 4]). The observed nucleotide distance between subgroups A and B was 0.13 to 0.18 nucleotide changes per site (Table 2) or 6 to 7% in the tree scale (Fig. 3). As shown previously for genotypes, VP1 nucleotide sequence comparisons between the members of genotype II were also distributed into two major peaks (Fig. 4). However, there was overlap between nucleotide sequence comparison peak 1 (homologous subgroup) and peak 2 (heterologous subgroup).
FIG. 3.
Phylogenetic tree of a subset of 48 genotype II strains. For clarity, only 48 sequences are shown. The analysis method was the same as that reported for Fig. 1.
FIG. 4.
Distribution of observed nucleotide distances between subgroups in genotype II. Peak 1 corresponds to comparisons of homologous strains (same subgroup), and peak 2 corresponds to comparisons of heterologous strains (different subgroup) of the same minor phylogenetic cluster.
TABLE 2.
Comparison of nucleotide distances between isolates of genogroup IIa
| Group | Observed nucleotide distance within and between subgroup:
|
||
|---|---|---|---|
| A | B | Bastianni | |
| A | 0.05-0.08 | 0.13-0.18 | 0.10-0.17 |
| B | 0.07-0.10 | 0.12-0.19 | |
| Bastianni | NA | ||
The data indicate the 95% confidence intervals of the observed nucleotide distances (Kimura model of substitution). NA, not applicable.
Although the number of strains in genotype I is much lower than that in genotype II, the same subgrouping could be observed in this genotype. The strains presenting less than 6% observed nucleotide variation were temporally related (data not shown). Additionally, since most changes are silent, this behavior was not observed in analysis of amino acid sequences.
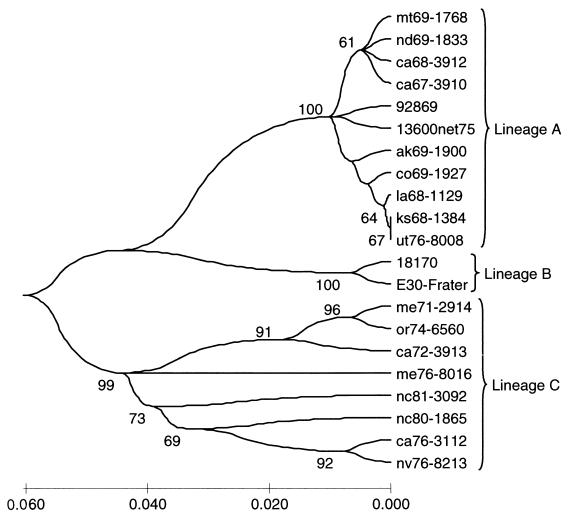
Based on their nucleotide distances and levels of bootstrapping, subgroups A and B could be subdivided into lineages (Fig. 5 and 6; Table 3). Subgroup A was subdivided into three lineages supported by 100 bootstrapping values (Fig. 5). This clustering could also reflected the time of isolation. The first cluster included strains isolated from 1958 to 1960, the second cluster included strains isolated from 1967 to 1969 (except for strain UT76-8008, isolated in 1976), and the third cluster included strains isolated from 1971 to 1980. However, since no strain of this group was detected after 1980, these lineages may be considered extinct.
FIG. 5.
Phylogenetic tree of all genotype II subgroup A strains. The analysis method was the same as that for Fig. 1.
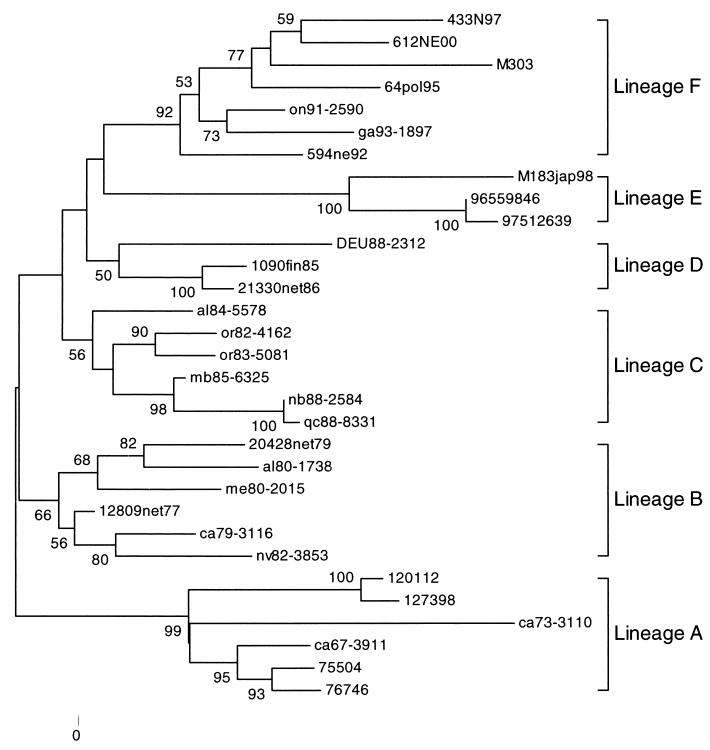
FIG. 6.
Phylogenetic tree of a set of genotype II subgroup B strains. The analysis method was the same as that for Fig. 1. For clarity, a subset of only 31 strains included is shown.
TABLE 3.
Comparison of nucleotide distances between isolates of subgroupa
| Lineage | Observed nucleotide distance between and within lineage:
|
|||||
|---|---|---|---|---|---|---|
| A | B | C | D | E | F | |
| A | 0.04-0.06 | 0.07-0.11 | 0.07-0.11 | 0.07-0.11 | 0.08-0.14 | 0.09-0.15 |
| B | 0.04-0.06 | 0.05-0.08 | 0.05-0.08 | 0.07-0.12 | 0.09-0.14 | |
| C | 0.04-0.06 | 0.05-0.08 | 0.06-0.10 | 0.08-0.13 | ||
| D | 0.04-0.06 | 0.07-0.12 | 0.09-0.14 | |||
| E | 0.04-0.06 | 0.07-0.13 | ||||
| F | 0.02-0.04 | |||||
The data indicate the 95% confidence intervals of the observed nucleotide distances (Kimura model of substitution).
Six different lineages were defined in subgroup B (lineages A to F) (Fig. 6). As in the case of subgroup A, the lineages presented the same pattern and could be clustered phylogenetically as well as temporally. Lineages A, B, and C also correlated with isolation times of 1967 to 1973, 1978 to 1981, and 1981 to 1985, respectively.
Another two groups of strains were detected and were designated lineages D and E. Lineage E strains were detected only in Japan and Australia between 1996 and 1998, while lineage D strains were detected only in Europe between 1985 and 1988.
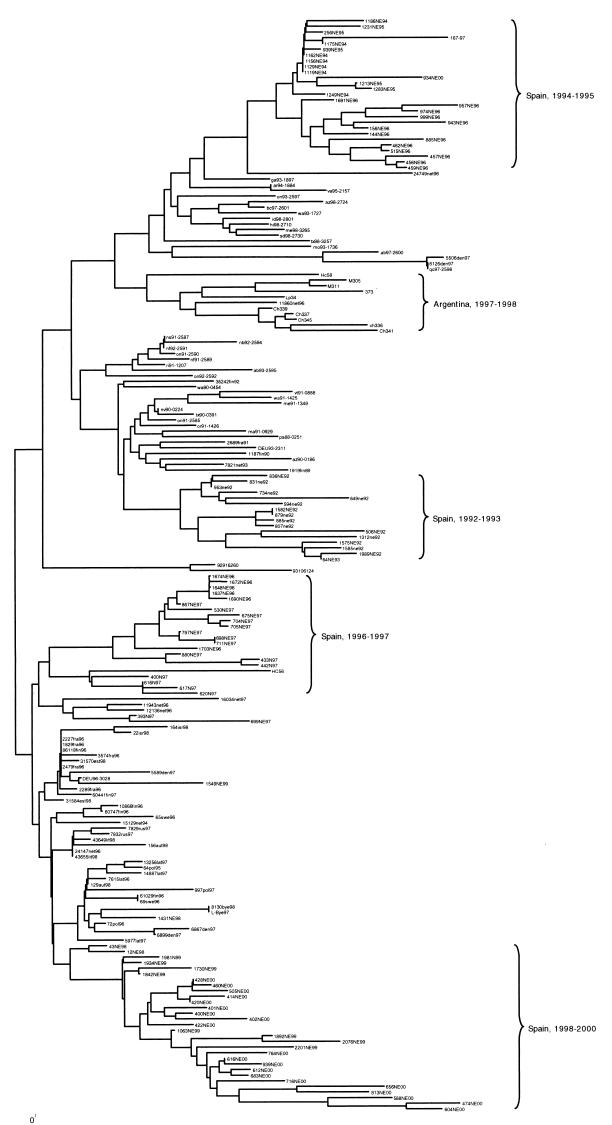
Furthermore, lineage F clustered the remaining strains isolated around the world between 1990 and 2000. Interestingly, the phylogenetic tree of lineage F clustered the strains with a clear temporal and geographic pattern (Fig. 7).
FIG. 7.
Phylogenetic tree of all genotype II subgroup B lineage F strains. The analysis method was the same as that for Fig. 1. The groups of Argentine and Spanish isolates and their dates of isolation are marked in the tree.
Comparative analysis of EV30 classifications.
Table 4 summarizes the classifications of EV30. All strains grouped in genotype I defined in this work were described and published previously (10). There are no representative isolates of this genotype in the previously published samples in Europe (15), nor in this work, since the samples studied were isolated after 1988.
TABLE 4.
Summary of EV30 classification
| Classification in this work | Corresponding classification in reference:
|
|
|---|---|---|
| 10 (Oberste et al.) | 15 (Savolainen et al.) | |
| Genotype I | Genotype 1 | NIa |
| Genotype II | ||
| Subgroup B | ||
| F | Genotype 4b | Genotype 3d |
| E | Genotype 4b | NI |
| D | Genotype 4a | Genotype 3b |
| C | Genotype 4a | Genotype 3c, 3b |
| B | Genotype 4a | Genotype 3a, 3b |
| A | Genotype 3 | NI |
| Subgroup A | ||
| A | Genotype 2 | Genotype 2 |
| B | Genotype 2 | NI |
| C | Genotype 2 | NI |
| Bastianni | Bastianni | Genotype 1 |
NI, no included strains of this group.
The strains grouped in genotype II defined in this work included those which were defined as genogroups 2, 3, 4a, and 4b (10). Previously published genogroup 2, which was defined with strains isolated from 1959 to 1980, was equivalent to our subgroup A, which included the European strain designated as the unique member of genotype 2 by Savolainen et al. (15), 13600NET75 (isolated in The Netherlands in 1975). No other member of this subgroup was detected after 1980.
The Bastianni prototype strain was not only the sole member of genotype 1 in the classification of Savolainen et al., but it was not even related to other members of genotype 2 in the classification of Oberste et al., where it belongs. In our analysis, the Bastianni prototype strain was classified as genotype II but was distant from the members of subgroups A and B.
Genotypes 3, 4a, and 4b of the classification of Oberste et al. belonged to subgroup B. This clustering was also reflected in the lineages observed. Lineage E and F strains belonged to genotype 4b, while lineage C strains corresponded to genotype 3. Lineages A and B were part of genotype 4a. Finally, strain DEU88-2312, described by Oberste et al. as a distant member of genotype 4b, clustered with some strains classified by Savolainen et al. into a different lineage (D) that circulated in Europe between 1985 and 1988.
Genotype 3 of the classification of Savolainen et al. also belonged to subgroup B. However, the clustering reported by these authors was only partially reflected in our trees. All strains reported as part of lineage 3d by Savolainen et al. belonged to lineage F, lineage 3a strains belonged to lineage B, and lineage 3c strains were included in lineage C. Following these examples, the subtypes described by these authors would be equivalent to our lineages. On the other hand, lineage 3b strains were not clustered together in our analysis but belonged to lineages B, C, and D.
DISCUSSION
The molecular epidemiology of EV has been described, clustering the isolates in lineages based on an established level of observed nucleotide distances and directly in genogroups and subgroups based on their phylogenetic relationships. A new classification scheme for EV30 is proposed in this work, after revision of present classifications.
One classification of enterovirus serotypes was mainly derived from previous studies with poliovirus. The epidemiological relationships of poliovirus were established by sequencing a small portion of the VP1/2A region (150 nucleotides) and determining a level of nucleotide distance at which a new lineage was always described above 15% divergence. Among nonpoliovirus enteroviruses the same criteria were applied to the study of CAV9 (14), CBV4 (8), and EV30 European strains (15). However, improvements in molecular diagnostic tools and development of genetic methods that allow the direct amplification of broader regions of VP1 may change these criteria due to the restricted length and high nucleotide and amino acid variability of this region.
Other classifications resulted from the level of confidence (bootstrapping values) in phylogenetic trees. This criterion was used to study other nonpoliovirus enteroviruses (enterovirus 71 [1], EV30 [10], and CBV5 [18]). This criterion was the same one that allowed the molecular typing of enterovirus.
EV30 molecular epidemiology has been established through these two different approaches by different authors. Oberste et al. (10) divided EV30 mainly on the basis of bootstrapping levels that defined genotypes. A total of 136 complete VP1 sequences including all the reference strains were included in the analysis. This method clustered EV30 strains into four genotypes (1, 2, 3, and 4), subdividing the last genotype into two subgroups (4a and 4b). However, this criterion divided EVs into clusters with different values for nucleotide distances. Thus, differences between strains of genotypes 3 and 4 were lower than the differences among strains of the same genotype. In addition, not only were amino acid differences among genotypes 2, 3, and 4 not significant but clustering was also not supported in the phylogenetic tree obtained from amino acid sequencing (data not shown).
On the other hand, based on the criteria used with poliovirus molecular epidemiology, a total of 131 European EV30 strains were analyzed in three distinct regions of the genome. The European EV30 strains were subdivided into three genotypes (1, 2, and 3), and the last genotype was further divided into four lineages (3a, 3b, 3c, and 3d). For this classification, a 12% discrimination level between lineages was established, and it was applied to analysis of the corresponding sequences in the VP4-VP2 genome region (15).
This classification also presented discrepancies. It did not correlate with the clustering obtained after analyzing the complete VP1 region or the VP1/2A region of the same set of strains. Moreover, it is known that the VP4-VP2 region utilized was less reliable for studying the molecular epidemiology of enterovirus (8, 12). Additionally, since not all available reference strains and strains isolated before 1977 were included in the analysis, genotype 1 was not properly investigated.
Following this evaluation, a new classification scheme for EV30 based on both the nucleotide and amino acid distance values was proposed. A total of 318 strains of EV30 were divided into two broad genotypes (I and II). Thus, the Giles and PR17 reference strains were included in genotype I, and the Bastianni and Frater prototype strains were included in genotype II. This segregation was supported by the phylogenetic trees obtained from amino acid sequences (data not shown), and it correlated with the antigenic heterogeneity of these reference strains as described in earlier studies (17).
Additionally, the Frater and Bastianni prototype strains also showed different antigenic properties based on the different reactivities of specific antisera. In this study, the molecular analysis of genotype II showed the Bastianni strain to be distant from the other strains of genotype II (Fig. 3). Therefore, genotypes are defined as strains that are clearly distinguished by their amino acid sequences and, by extension, by their antigenic characterization. The level of differentiation of the genotypes obtained from this analysis was 0.22 nucleotide changes per site or 0.06 amino acid changes per site.
Notably, genotypes I and II cocirculated around the world between 1956 (first reported isolate) and 1975. The COL95-6669 strain was classified as a member of genotype I according to previous studies. It was proposed previously that this genotype continues to circulate in the Americas (10). However, Argentinean EV30 strains isolated from 1995 to 1997 were not included in genotype I. More strains from other South American countries must be investigated in order to disprove this hypothesis.
On the other hand, the subgroups and lineages did not result in the same correlation between amino acid and nucleotide differentiation. However, nucleotide discrimination in subgroups among members of genotype II was determined by high levels of bootstrapping. Although the level of confidence of lineage clustering was lower, the temporal clustering resulting from the lineage clustering was very definite.
The molecular epidemiology of EV30 can be related to influenza virus epidemiology, where prevailing lineages displace the less established lineages on the basis of immune escape. This pattern of evolution is clearly different from that of other enteroviruses. The designated genotypes of poliovirus strains were shown to circulate only in geographically restricted regions. EV30 does not seem to be restricted in the same way, as a given genotype circulates in different regions of the world at the same time. In addition, EV30 genotype I circulated between 1958 and 1977 (with the exception of COL95-6669). The data support the failure to observe related viruses in the regions studied for significant periods of time. The same could be asserted for EV30 genotype II subgroup A, which circulated between 1958 and 1980, and for lineages A, B, C, and D of genotype II subgroup B. Strains of lineages E and F are the only strains circulating nowadays. However, only three lineage E strains were detected.
A lineage displacement could be considered antigenic drift in EV30 epidemiology, while a subgroup displacement could be considered antigenic shift. The majority of variable positions were located at the end of the VP1 protein, and the C-terminal region (30 amino acids) in several other enteroviruses is known to contain an antigenic site. We also suggested in a previous study that the evolution of EV30 over 10 years of circulation may be driven by positive selection. One of the possible sites for this selection was located in this region.
In addition, the pattern of prevalence of lineages shows an increase in the observed nucleotide distances from lineages A to F, showing that the newest lineages are more distant from their lineage predecessors.
Aside from EV30 classification, the assumptions of previous authors were confirmed in this study. Spanish and Argentinean strains fitted the proposed model of evolution. Except for two Australian lineages and one Japanese strain belonging to lineage E that circulated between 1996 and 1998, circulating EV30 strains belonged to genotype II subgroup B lineage F.
In conclusion, EV30 differs from other enteroviruses analyzed so far. A single lineage at a time appears to circulate around the world. This behavior may be related to the epidemic activity of EV30. EV30 has been suggested as a possible candidate for immunization. If this behavior is confirmed with isolates from other locations underrepresented until today in Asia, Africa, and South America, then EV30 should be considered for vaccine development. A sequence database repository and a worldwide system of surveillance for EV30 strains, similar to the influenza virus network, might be necessary for monitoring both the movements and the origins of different lineages.
Acknowledgments
We thank Rodolfo Campos for his continuous support during this work and for helpful discussions and critical reading of the manuscript.
The work was supported by institute funds from INEI-ANLIS “Dr. Carlos G. Malbrán” and by a Fondo de Investigaciones Sanitarias FIS96/0304 grant from the Spanish Ministry of Health.
REFERENCES
- 1.Brown, B. A., M. S. Oberste, J. P. J. Alexander, M. L. Kennett, and M. A. Pallansch. 1999. Molecular epidemiology and evolution of enterovirus 71 strains isolated from 1970 to 1998. J. Virol. 73:9969-9975. [DOI] [PMC free article] [PubMed] [Google Scholar]
- 2.Caro, V., S. Guillot, F. Delpeyroux, and R. Crainic. 2001. Molecular strategy for "serotyping" of human enteroviruses. J. Gen. Virol. 82:79-91. [DOI] [PubMed] [Google Scholar]
- 3.Casas, I., G. Palacios, G. Trallero, D. Cisterna, M. Freire, and A. Tenorio. 2001. Molecular characterization of human enteroviruses in clinical samples: comparison between VP2, VP1, and RNA polymerase regions using RT nested PCR assays and direct sequencing of products. J. Med. Virol. 65:138-148. [PubMed] [Google Scholar]
- 4.Casas, I., L. Powell, P. E. Klapper, and G. M. Cleator. 1995. New method for the extraction of viral RNA and DNA from cerebrospinal fluid for use in the polymerase chain reaction assay. J. Virol. Methods 53:25-36. [DOI] [PubMed] [Google Scholar]
- 5.Dagan, R., J. A. Jenista, and M. A. Menegus. 1988. Association of clinical presentation, laboratory findings, and virus serotypes with the presence of meningitis in hospitalized infants with enterovirus infection. J. Pediatr. 113:975-978. [DOI] [PubMed] [Google Scholar]
- 6.Duncan, I. B. 1968. A comparative study of 63 strains of ECHO virus type 30. Arch. Gesamte Virusforsch. 25:93-104. [DOI] [PubMed] [Google Scholar]
- 7.Melnick, J. L. 1996. Enteroviruses: polioviruses, coxsackieviruses, echoviruses, and newer enteroviruses, 3rd ed. Lippincott-Raven, Philadelphia, Pa.
- 8.Mulders, M. N., M. Salminen, N. Kalkkinen, and T. Hovi. 2000. Molecular epidemiology of coxsackievirus B4 and disclosure of the correct VP1/2A(pro) cleavage site: evidence for high genomic diversity and long-term endemicity of distinct genotypes. J. Gen. Virol. 81:803-812. [DOI] [PubMed] [Google Scholar]
- 9.Norder, H., L. Bjerregaard, and L. O. Magnius. 2001. Homotypic echoviruses share amino-terminal VP1 sequence homology applicable for typing. J. Med. Virol. 63:35-44. [PubMed] [Google Scholar]
- 10.Oberste, M. S., K. Maher, M. L. Kennett, J. J. Campbell, M. S. Carpenter, D. Schnurr, and M. A. Pallansch. 1999. Molecular epidemiology and genetic diversity of echovirus type 30 (E30): genotypes correlate with temporal dynamics of E30 isolation. J. Clin. Microbiol. 37:3928-3933. [DOI] [PMC free article] [PubMed] [Google Scholar]
- 11.Oberste, M. S., K. Maher, D. R. Kilpatrick, M. R. Flemister, B. A. Brown, and M. A. Pallansch. 1999. Typing of human enteroviruses by partial sequencing of VP1. J. Clin. Microbiol. 37:1288-1293. [DOI] [PMC free article] [PubMed] [Google Scholar]
- 12.Oberste, M. S., K. Maher, and M. A. Pallansch. 1998. Molecular phylogeny of all human enterovirus serotypes based on comparison of sequences at the 5′ end of the region encoding VP2. Virus Res. 58:35-43. [DOI] [PubMed] [Google Scholar]
- 13.Rico-Hesse, R., M. A. Pallansch, B. K. Nottay, and O. M. Kew. 1987. Geographic distribution of wild poliovirus type 1 genotypes. Virology 160:311-322. [DOI] [PubMed] [Google Scholar]
- 14.Santti, J., H. Harvala, L. Kinnunen, and T. Hyypia. 2000. Molecular epidemiology and evolution of coxsackievirus A9. J. Gen. Virol. 81:1361-1372. [DOI] [PubMed] [Google Scholar]
- 15.Savolainen, C., T. Hovi, and M. Mulders. 2001. Molecular epidemiology of echovirus 30 in Europe: succession of dominant sublineages within a single major genotype. Arch. Virol. 146:521-537. [DOI] [PubMed] [Google Scholar]
- 16.Trallero, G., I. Casas, A. Tenorio, J. E. Echevarria, A. Castellanos, A. Lozano, and P. P. Brena. 2000. Enteroviruses in Spain: virological and epidemiological studies over 10 years (1988-97). Epidemiol. Infect. 124:497-506. [DOI] [PMC free article] [PubMed] [Google Scholar]
- 17.Wenner, H. A., P. Harmon, A. M. Behbehani, H. Rouhandeh, and P. S. Kamitsuka. 1967. The antigenic heterogeneity of type 30 echoviruses. Am. J. Epidemiol. 85:240-249. [DOI] [PubMed] [Google Scholar]
- 18.Zhang, G., D. T. Haydon, N. J. Knowles, and J. W. McCauley. 1999. Molecular evolution of swine vesicular disease virus. J. Gen. Virol. 80:639-651. [DOI] [PubMed] [Google Scholar]


