Abstract
The human papillomavirus (HPV) protein E2 possesses dual roles in the viral life cycle. By interacting directly with host transcription factors in basal keratinocytes, E2 promotes viral transcription. As keratinocyte differentiation progresses, E2 associates with the viral helicase, E1, to activate vegetative viral DNA replication. How E2's major role switches from transcription to replication during keratinocyte differentiation is not understood, but the presence of a TATA site near the viral origin of replication led us to hypothesize that TATA-binding protein (TBP) could affect HPV replication. Here we show that the C-terminal domain of TBP (TBPc) is a potent inhibitor of E2-stimulated HPV DNA replication in vitro (50% inhibitory concentration = 0.56 nM). Increasing the E1 concentration could not overcome TBPc inhibition in replication assays, indicating that TBPc is a noncompetitive inhibitor of E1 binding. While direct E2-TBPc association could be demonstrated, this interaction could not fully account for the mechanism of TBPc-mediated inhibition of viral replication. Because E2 supports sequence-specific binding of E1 to the viral ori, we proposed that TBPc antagonizes E1-ori association indirectly through inhibition of E2-DNA binding. Indeed, TBPc potently antagonized E2 binding to DNA in the absence (Ki = 0.5 ± 0.1 nM) and presence (Ki = 0.6 ± 0.3 nM) of E1. Since E2 and TBPc cannot be coadjacent on viral sequences, direct DNA-binding competition between TBPc and E2 was responsible for replication inhibition. Given the ability of TBPc to inhibit HPV DNA replication in vitro and data indicating that TBPc antagonized E2-ori association, we propose that transcription factors regulate HPV DNA replication as well as viral transcription.
Human papillomaviruses (HPVs) infect mucosal or cutaneous epithelia, causing pathologies as varied as cutaneous warts, genital condylomata accuminata, laryngeal papillomas, some skin cancers, and cervical and anogenital cancer (reviewed in reference 57). A link between papillomavirus replication and the process of keratinocyte differentiation has been demonstrated through in situ hybridization studies of bovine papillomavirus type 1 (BPV-1)-induced fibropapillomas (2). In basal keratinocytes, transcription of papillomavirus early genes predominates; a low level of viral DNA replication occurs when keratinocytes divide to perpetuate the genome. With progressive keratinocyte differentiation, there is increased viral DNA replication and expression of late gene products. How viral transcription and vegetative replication are mutually coordinated remains unclear. This process is likely dependent on the papillomavirus-encoded proteins E1, a 70- to 80-kDa DNA helicase/ATPase, and E2, a 50-kDa transcriptional modulator (5, 20, 21, 32, 45). E2 has an amino-terminal domain that is necessary for viral transactivation and for direct association with E1 (9). HPV-11 E1 binds DNA with low affinity and specificity to the viral origin of replication (ori) (11, 25, 60), but interaction with E2 confers sequence-specific binding and increased binding affinity (3, 4, 33, 45, 47). Many investigators have shown that the viral E1 and E2 proteins function together to initiate ori-dependent viral DNA replication, though E1-stimulated ori-independent replication is achievable in vitro (3, 4, 9, 33, 34, 47). During differentiation of papillomavirus-infected keratinocytes, E1 and E2 protein concentrations appear to increase, suggesting that in part, E1 and E2 levels orchestrate vegetative viral DNA replication (23, 35). These levels may also change with the stage of the cell cycle, which could direct viral replication during S phase in undifferentiated keratinocytes, but this has not been clearly demonstrated.
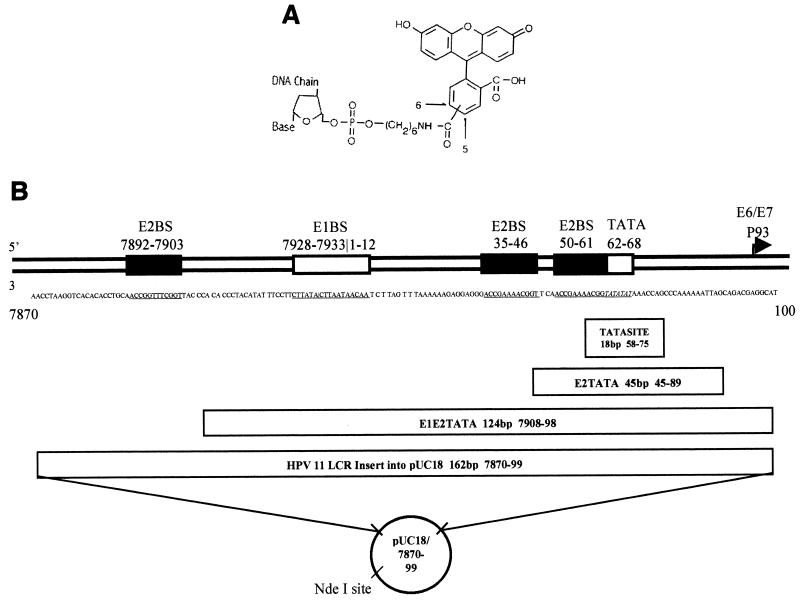
The HPV-11 long control region (LCR) of the genome contains the ori and binding sites for viral and host transcription and replication factors. At the 3′ end of the LCR, there are two E2 binding sites separated by three bases 5′ proximal to the P93 promoter (19) (Fig. 1). P93 is especially important for study because, like the BPV-1 P89 and HPV-16 P97 promoters, it controls transcription of the viral oncogenes E6 and E7 (14, 17, 48, 49, 58). In addition to transcription, P93 may also regulate HPV replication. The proximity of the E1 binding site (55) to the P93 promoter strongly suggests that E1 might directly affect P93 transcription and that P93 transcription would preclude viral replication. In the LCR, the E2 binding sites that support E1-ori binding are flanked on the 3′ side by the P93 TATA box. Although BPV E2 has been shown to interact directly with transcription factor TATA-binding protein (TBP) (37, 50), studies have predicted that high concentrations of HPV-11 and −16 E2 displace TBP from the TATA site, and vice versa (6, 53). These proposals are supported by functional assays that show repression of E6/E7 transcription when E2 binds the tandem sites nearest the TATA box (6, 12, 52). Competition for adjacent binding sites and steric hindrance presumably accounted for binding repression, but this was not formally tested. On the contrary, some have suggested that steric hindrance may not be important to E2-mediated transcriptional repression (19). Because ori-dependent E1 binding requires E2, we hypothesized that if TBP directly displaces E2 from the LCR, then TBP would reduce E1 binding to the ori indirectly, thereby suppressing DNA replication.
FIG. 1.
3′ end of the HPV-11 LCR (P93 promoter), structures of fluorescein-labeled oligonucleotides TATASITE, E2TATA, and E1E2TATA, and description of pUC18/7870-99. (A) The phosphoramidite-linked fluorescein moiety structure is illustrated. (B) The sequence of the 3′ end of the HPV-11 LCR and the positions of the E1, E2, and TBP binding sites are illustrated, as well as oligonucleotides TATASITE, E2TATA, and E1E2TATA. The sequence of TATASITE contains the full TATA box and its flanking bases, nucleotides 58 to 75. Oligonucleotide E2TATA, nucleotides 45 to 89, contains the TATA box and the adjacent E2 site. Oligonucleotide E1E2TATA, nucleotides 7908 to 98, contains the E1, two E2, and TBP binding sites. The plasmid pUC18/7870-99 contains nucleotides 7870 to 99 with the E1, three E2, and TBP binding sites ligated into pUC18. Note that sequence numbering begins at the origin in the E1 binding site.
To test the effect of TBP on HPV-11 DNA replication, we used in vitro DNA replication assays. The results indicate that the human C-terminal domain of TBP (TBPc) is a potent inhibitor of E1/E2-mediated viral DNA replication. Increasing E1 concentration could not overcome TBPc-mediated inhibition of DNA replication. We then studied protein-DNA complex formation in the context of the LCR using fluorescence polarization. We demonstrate quantitatively that TBPc antagonized E2-DNA association and effectively inhibited E2-mediated E1 binding to ori-containing oligonucleotides. We further show that TBPc was not bound to an E2-saturated oligonucleotide, indicating that E2 binding precludes TBPc-LCR association. These data indicate that TBPc antagonizes E1-ori association and E1/E2-mediated HPV DNA replication by inhibiting E2-DNA binding near the ori. Our data support a model for coordinated control of HPV transcription and replication in which transcription factors play an important role in viral DNA replication.
MATERIALS AND METHODS
HPV-11 E2 purification.
Full-length HPV-11 E2 was purified as described previously (4) with these amendments. Briefly, E2 was expressed in Escherichia coli BL21(DE3) and purified using heparin-agarose and DNA-affinity chromatography. Prior to eluting E2 from the DNA-affinity column, the column was washed with no-salt buffer (20 mM Tris [pH 8.0], 1 mM EDTA, 5 mM dithiothreitol, 0.1% Tween 20) containing 100 μg of salmon-sperm DNA/ml. Purified E2 protein fraction samples were analyzed by sodium dodecyl sulfate-polyacrylamide gel electrophoresis (PAGE) and Western blotting. E2-containing fractions were pooled, aliquoted, and kept at −80°C for long-term storage. No nuclease or polymerase activity was detected in the E2 pool. Since E2 was eluted from an E2-binding-site DNA affinity column, 100% of the E2 was active for DNA binding. A sample was removed from each E2 preparation for quantitative amino acid analysis. E2 exists as a dimer in solution, and thus, concentrations are in E2 dimers.
HPV-11 E1 purification.
Homogeneously pure HPV-11 E1 protein from baculovirus-transfected Sf9 cells was a gift from W. Rocque (GlaxoSmithKline, Inc.) (39). The concentration of E1 was determined by quantitative amino acid analysis. E1 was stored at −80°C.
Human TBPc purification.
Human TBPc (amino acids 159 to 344; 20,757 Da) protein purified from E. coli was a gift from D. Gewirth (Duke University). It was purified as described in previously published protocols (22). The TBPc concentration was determined by the Lowry assay, and the protein was stored at −80°C.
Cell-free replication assays.
Suspension 293 cells were maintained in Joklik's medium with 5% calf serum until the density reached 5 × 10⁵ cells/ml. Whole-cell extracts were prepared as with previously published protocols (29). The conditions for HPV-11 cell-free replication assays were modified from previous protocols (25, 31). Briefly, 5 nM HPV-11 origin plasmid (pUC18/7870-99; kindly provided by W. Phelps) (Fig. 1) was incubated in a replication mixture of 293 extract supplemented with 20 mM Tris (pH 7.5), 200 μg of bovine serum albumin/ml, 7 mM MgCl2, 2 mM β-mercaptoethanol, 100 μM (each) deoxynucleoside triphosphates, 140 nM ATP, 20 μM (each) nucleoside triphosphates, 2 mM phosphocreatine, and 125 U of creatine phosphokinase/liter. The viral proteins E1, E2, and human TBPc were added as indicated in the figures. Reactions were incubated at 25°C for 30 min before adding [α-32P]dATP to reduce background replication. The reactions were then placed at 37°C for 3 h. Replication was stopped by adding 10 μl of a solution containing 2% sodium dodecyl sulfate, 250 mM EDTA, and 2 mg of proteinase K/ml. Reactions were incubated for 30 min at 37°C and were phenol-chloroform-isoamyl alcohol (25:24:1) extracted. After ethanol precipitation, products were resuspended in 40 μl of 10 mM Tris (pH/8.0), and NdeI digested to aid quantification. Results were run on a 1% agarose gel, and the gel was dried and exposed to RXB film (Denville Scientific). Results were quantified by scintillation counting and/or use of PhosphorImager (Molecular Dynamics). To perform scintillation counting, digested product (10 μl) was dotted onto DE81 ion-exchange paper (Whatman). After drying, papers were washed with 5% NaH2PO4, distilled water, 100% ethanol, and acetone. Papers were placed in scintillation vials with 10 ml of scintillation fluid (Safety-Solve) and counted by a Beckman scintillation counter.
Synthetic oligonucleotides.
PAGE-purified, 5′-fluorescein phosphoramidite-labeled oligonucleotides (44) were obtained commercially (Sigma/Genosys Corp.). Contaminating unlabeled oligonucleotide was less than 2% (manufacturer's quality control report). Each oligonucleotide was resuspended to a concentration of 10 μM in a buffer with 20 mM Tris-HCl (pH 8.5), 1 mM EDTA, and 500 mM NaCl. To anneal complementary oligonucleotides, equimolar amounts were mixed and placed at 95°C for 5 min, and then the temperature was dropped slowly over 2 h to 20°C below the oligonucleotide's melting point or room temperature, whichever was higher, under which condition it continued to anneal overnight. PAGE analysis of samples indicated 100% annealing. Oligonucleotide concentrations were confirmed from measured optical densities at 260 nm. Annealed oligonucleotides were stored at −20°C. The sequences of TATASITE and E2TATA are shown in Fig. 1.
PCR-produced oligonucleotides.
PAGE-purified, 5′-fluorescein phosphoramidite-labeled oligonucleotide PCR primers were obtained commercially (Sigma/Genosys Corp.) and used without further purification. Contaminating unlabeled oligonucleotide was less than 2% (manufacturer's quality control report). These 18-mers (5′-FCACACCCTACATATTTCC and 5′-FGCCTCGTCTGCAATTTTT) were used to amplify a 124-bp region of the HPV-11 LCR containing the E1, E2, and TBP binding sites from plasmid pW7 (kindly provided by W. Phelps, GlaxoSmithKline, Inc.), which contains the entire HPV-11 genome. Amplification was done in a GeneMate PCR machine. The doubly labeled product, E1E2TATA, was checked by 2% agarose gel electrophoresis; a single PCR product of the expected length was made (results not shown). E1E2TATA was purified according to Qiagen's Gel Extraction Kit protocol. The sequence for E1E2TATA is shown in Fig. 1.
Antibodies.
Antibodies to E1 (mouse monoclonal 82.15) and E2 (rabbit polyclonal IC538 to HPV11-E2c) were gifts from W. Phelps. Rabbit polyclonal human TBP antibody was purchased from Santa Cruz Biotechnology.
Fluorescence anisotropy.
Because of the ease of reproducibility and the preciseness of data generated by using fluorescence anisotropy, this technique rather than gel shift analysis was used to measure protein-DNA binding in solution at equilibrium. Fluorescence anisotropy measures changes in the molecular rotation of a complex in solution. Molecular rotation (anisotropy) is affected by temperature (T), viscosity of the solution (η), and the Stokes volume of the particle (V), yielding equation 1 (26):
 |
(1) |
where τ is the fluorescence half-life and R is the gas constant. Keeping T and η constant, we can reliably and reproducibly measure binding of protein to a fluorescently labeled oligonucleotide by the changing Stokes radius, or hydrated volume, of a fluorescent molecule as proteins bind it. Large complexes rotate slowly and have high anisotropies (A), whereas small complexes rotate quickly and have low anisotropies.
All fluorescence measurements were made using an SLM-Aminco 8100 spectrofluorometer assembled in the “T” geometry and equipped with Glanz-Thompson polarizers in the excitation and emission beams. Experiments were repeated at least two times. Titration buffer consisted of 20 mM Tris, pH 8.0, 150 mM KCl, 5 mM EDTA, 200 μg of bovine serum albumin/ml, and 5 mM dithiothreitol. Samples, prepared in duplicate, were maintained at 25.0 ± 0.2°C. A minimum of 10 min equilibration time was given prior to each measurement. Samples were excited with 490-nm light, with the excitation slit at 4 mm. Emitted light was collected through 3-mm-thick OG-515 filters. The fluorescence anisotropy of each sample was determined by duplicate sets of 10 measurements per set. The dissociation constant for each complex was determined by measurement of the steady state anisotropy of the fluorescein-labeled oligonucleotide as a function of added protein. The anisotropy limits of the titrations, corresponding to free fluorescein-labeled oligonucleotide (Af) and protein-bound fluorescein-labeled oligonucleotide (Ab), as well as the observed anisotropy (A) and the fractional change in fluorescein quantum yield upon binding (q), were used to calculate the fraction of fluorescein-labeled oligonucleotide bound (Fb) with protein as described in equation 2 (26):
 |
(2) |
All sample measurements were corrected for blank fluorescence. Even at the lowest oligonucleotide concentrations (1 nM), blank fluorescence was initially less than 20% and remained less than 25% of the sample fluorescence intensity throughout the titrations. The fractional change in fluorescein quantum yield was calculated by measuring the total fluorescence intensities of the free and bound oligonucleotides, subtracting the intensities of the blank controls, and then correcting for dilution as described in equation 3 (26):
 |
(3) |
where I‖ and I⊥ are the fluorescence intensities with parallel and perpendicularly oriented excitation and emission polarizers.
Determination of Ki of TBPc.
Fluorescence anisotropy measurements as described above were done in the presence and absence of excess amounts of TBPc over oligonucleotide to determine the effect of TBPc on E2 binding. If the titration was saturable, an apparent Kd of the added protein in the presence of TBPc was determined. Comparing the actual Kd to the apparent Kds of the added protein, the Ki of TBPc was determined as described in equation 4 (46):
 |
(4) |
RESULTS
TBPc inhibits replication of HPV-11 origin-containing DNA.
To explore the role of transcription factors in coordinated regulation of HPV transcription and replication, we first examined the effect of TBPc on E1/E2-mediated DNA replication using cell-free replication assays. TBP is composed of two structural domains, an amino-terminal domain, which is dispensable for basal transcription and cell viability, and the carboxy-terminal domain, which is responsible for DNA binding and initiation of basal level transcription (8, 15, 38). Thus, the carboxyl-terminal core version of human TBP (TBPc, residues 159 to 344) was chosen for these experiments.
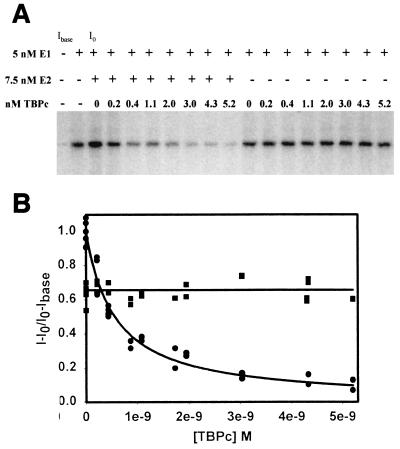
To determine the effects of TBPc on HPV-11 E1/E2-mediated DNA replication, increasing amounts of TBPc were added to replication reactions containing 5 nM E1 in either the presence or absence of 7.5 nM E2 (Fig. 2a). This E1 concentration allowed for measured stimulation by E2 (50% increase above E1 alone) but was still high enough to induce DNA replication in an E2-independent manner. Increasing the TBPc concentration did not affect E2-independent replication; conversely, the addition of TBPc to E2-stimulated replication assays effectively inhibited replication. The reduction of replication below that of E2-independent replication suggests that E2 sequesters E1 in solution in the presence of TBPc. Quantitative analysis of TBPc inhibition of E2-stimulated replication yielded a 50% inhibitory concentration (IC50) of 0.56 nM (Fig. 2b). Identical results were obtained when using full-length human TBP (Santa Cruz Biotechnology) rather than TBPc (data not shown).
FIG. 2.
TBPc inhibits E2-stimulated replication and does not affect E2-independent replication. (A) NdeI-digested replication products from cell-free replication assays using HPV-11 ori-containing plasmid (pUC18/7870-99) and increasing TBPc. Cell-free replication assays were performed as outlined in Materials and Methods. E1, E2, and TBPc are added as noted. Lanes correlating to initial and base intensity of counts (I0 and Ibase) are indicated. (B) Several E2-stimulated (circles) and E2-independent (squares) replication assays with increasing TBPc concentration were quantified by PhosphoImager and filter washing as outlined in Materials and Methods. Data were normalized to E2-stimulated replication. The data were fit to 2-parameter hyperbolic decay (r2 = 0.96 with E2 present) and first-order polynomial regression curves (y-intercept = 0.657; correlation coefficient = 1.12 × 10⁻⁵ without E2 present). Analysis of 2-parameter hyperbolic decay yields an IC50 of 0.56 nM.
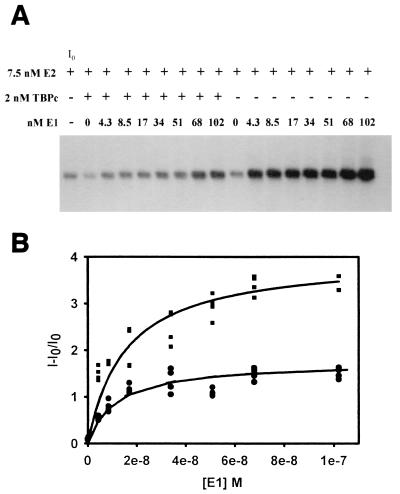
To determine if increasing the concentration of E1 could overcome the inhibitory effect of TBPc, replication reactions with increasing E1 concentration were performed in the presence and absence of 2 nM TBPc (Fig. 3a). E1 stimulated replication in both the presence and absence of TBPc. However, TBPc proved to be a very strong replication inhibitor, and E1 was unable to overcome this inhibition. The great difference between the replication maxima obtained by quantitative analysis suggests that TBPc is a noncompetitive inhibitor of E1-induced replication (Fig. 3b). As a noncompetitive inhibitor, TBPc does not directly interfere with E1-ori binding or function, whether by binding E1 or the ori. Rather, this result suggests that TBPc interferes with replication at another level, perhaps by binding E2 directly and sequestering it in solution or by interfering with E2 binding to its sites on the DNA.
FIG. 3.
Increasing E1 concentration is not sufficient to overcome inhibition by TBPc in cell-free replication assays. (A) NdeI-digested replication products from cell-free replication assays using HPV-11 ori-containing plasmid (pUC18/7870-99) and increasing E1. Cell-free replication assays were performed as outlined in Materials and Methods. E1, E2, and TBPc are added as noted. Lanes correlating to initial intensity (I0) are indicated. (B) Several replication assays with (circles) and without (squares) TBPc were quantified by PhosphoImager and filter washing as outlined in Materials and Methods. The data were fit to single rectangular hyperbolic curves (r2 = 0.97 and 0.95, with and without TBPc present, respectively). Note that the curves generated by the data indicate that TBPc acts as a noncompetitive inhibitor.
Affinity of HPV-11 E2 for TBPc.
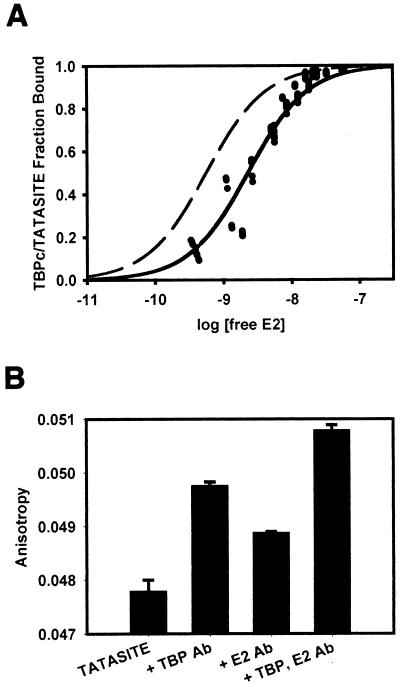
Since previous studies have shown that TBP and BPV E2 interact with each other in solution (37), it was possible that TBPc was merely sequestering HPV E2 in solution to inhibit our replication assays. To test if this was the case, binding experiments were conducted to determine the affinity of the HPV-11 E2-TBPc association in solution by fluorescein fluorescence anisotropy. If TBPc was merely sequestering E2 in solution, the Kd of the E2-TBPc interaction would be very near the IC50 from the replication assays. Rather than directly labeling the protein with fluorescein, we used DNA to “label” TBPc. To this end, a double-stranded, 18-bp oligonucleotide of the TATA site present in P93, specified TATASITE, was constructed (Fig. 1). Binding of TBPc to this oligonucleotide was found to be stoichiometric (Kd < 500 pM; data not shown). Since the Kd of the TBPc-TATASITE complex was subnanomolar and even high E2 concentrations did not bind TATASITE (data not shown), changes in anisotropy of TBPc-TATASITE must be attributed to direct TBPc-E2 binding. Therefore, to measure the Kd of the E2-TBPc complex, E2 was titrated into 1 nM TBPc-TATASITE. The titration was saturable and consistent with a single class of noninteracting binding sites (Fig. 4a). Thus, the data were plotted as the log [free E2] versus the fraction of TBPc-TATASITE bound. The resulting Kd of the E2-TBPc association was 2.3 nM, which is higher than the IC50 from the replication assay. A theoretical curve corresponding to a Kd of 0.56 nM is illustrated. It is clear that the E2-TBPc interaction is much weaker than the primary mechanism of TBPc-induced inhibition. Because the Kd of this interaction is statistically significantly higher than the calculated IC50 of TBPc (0.56 nM), the association of E2 and TBPc in solution alone cannot account for the mechanism of inhibition.
FIG. 4.
Association of HPV-11 E2 with TBPc-TATASITE. (A) E2 was titrated onto 1 nM TBPc-TATASITE in titration buffer as described in Materials and Methods. The fluorescence anisotropy of the solution was determined after each addition of E2. The data behaved as a single class of noninteracting E2 binding sites. Using the observed fluorescence anisotropies of the free and bound TBPc-TATASITE, the fraction of TBPc-TATASITE bound to E2 was calculated. The data were fit to the Michaelis-Menton equation using a Newton-Gauss iterative least-squares regression analysis assuming a single class of noninteracting E2 binding sites (SigmaPlot). The fraction of TBPc-TATASITE bound by E2 was plotted as a function of the log of the free E2 concentration. The binding curve shown corresponds to an E2-TBPc-TATASITE Kd of 2.3 nM (r2= 0.96). A theoretical curve (dashed line) corresponding to a Kd of 0.56 nM (r2 = 0.58 with this data) is illustrated. (B) Upon saturation of TBPc-TATASITE with E2, rabbit polyclonal anti-TBP and rabbit polyclonal anti-E2 antibodies were added. The fluorescence anisotropy of the solutions was determined for each antibody separately and combined. The addition of each antibody resulted in statistically significant anisotropy increases, confirming that fluorescence anisotropy is affected by the presence of each protein. The anisotropy measurement from adding both antibodies was cumulative and significant, showing the presence of both TBPc and E2 on TATASITE.
To confirm that changes in TATASITE anisotropy must be attributed to a direct E2-TBPc association, anti-E2 and anti-TBP antibodies were added at the end of E2 titration. The addition of anti-TBP and anti-E2 antibodies contributed statistically significant increases in anisotropy, and the combination of the antibodies yielded a cumulative increase in anisotropy (Fig. 4b). This corroborated the presence of TBPc on TATASITE, and E2 must in turn be bound to TBPc.
Affinity of HPV-11 E2 protein for DNA is reduced in the presence of TBPc.
To test whether TBPc affects E2-DNA binding directly, we first determined the affinity of E2 for its binding site nearest the TATA site in the absence of TBPc and E1. A fluorescein-labeled oligonucleotide, E2TATA (Fig. 1), was titrated with purified E2 protein, and an E2-E2TATA association was determined by measuring changes in fluorescein fluorescence anisotropy of E2TATA upon titration with E2 (Fig. 5). E2TATA binding by E2 was saturable, and the data were consistent with a single class of noninteracting binding sites. The Kd for this interaction was 1.1 nM.
FIG. 5.
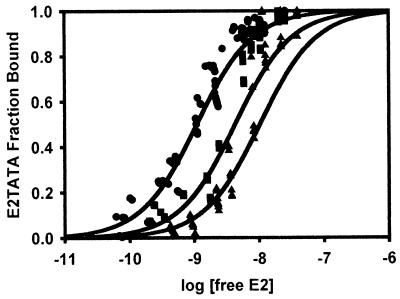
Association of HPV-11 E2 with E2TATA in the presence and absence of excess TBPc. E2 was titrated into 1 nM E2TATA in titration buffer, and the fluorescence anisotropy of the solution was determined after each addition of E2 as described in Materials and Methods. For titrations in the presence of TBPc, a final concentration of 2 or 4 nM TBPc was added prior to the addition of E2. Using the observed fluorescence anisotropies of the free and bound oligonucleotide, the fraction of oligonucleotide bound to E2 could be calculated as described in Materials and Methods. The fraction of E2TATA bound by E2 was then plotted as a function of the log of the free E2 concentration as described in Fig. 4. The binding curves shown correspond to E2-E1E2TATA Kds of 1.1 nM (no TBPc, circles; r2 = 0.96), 4.3 nM (with 2 nM TBPc, squares; r2 = 0.99), and 10.3 nM (with 4 nM TBPc, triangles; r2 = 0.96), respectively. The Ki of TBPc was determined to be 0.5 ± 0.1 nM.
To determine the effect of TBPc on the affinity of E2 for E2TATA, E2 was titrated onto E2TATA in the presence of TBPc. Titration of E2 into a solution containing 1 nM E2TATA and 2 nM TBPc yielded an apparent Kd of 4.3 nM (Fig. 5). The apparent Kd increased to 10.3 nM when 1 nM E2TATA was titrated with E2 in the presence of 4 nM TBPc (Fig. 5). Taken together, these data show that TBPc effectively antagonizes E2-E2TATA binding. The Ki of TBPc for E2-DNA binding was calculated as 0.5 ± 0.1 nM. This number is consistent with the IC50 of 0.56 nM calculated in the replication assays.
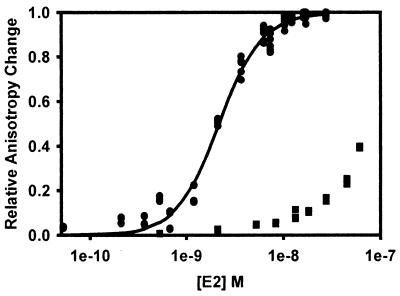
To determine the overall affinity of E2 for its tandem binding sites in the E6 promoter, E1E2TATA (Fig. 1) was titrated with purified E2. E2-E1E2TATA association was determined by measuring changes in fluorescein fluorescence anisotropy upon titration with E2 as outlined previously (Fig. 6). Because the anisotropy changes for each E2 association with E1E2TATA are unknown, the data are presented in terms of relative anisotropy change rather than as oligonucleotide fraction bound versus total E2 concentration. E1E2TATA binding by E2 did not appear to be saturable at attainable E2 concentrations, yielding an apparent [E2]0.5 bound (≈Kd) of >150 nM. This is consistent with our previous experiments with other long oligonucleotides (4) (see Discussion).
FIG. 6.
Association of HPV-11 E2 with E1E2TATA in the presence and absence of excess HPV-11 E1. E1E2TATA (1nM) in titration buffer was titrated with E2. For titrations in the presence of E1, a final concentration of 10 nM E1 was added prior to titration with E2. Data were collected and analyzed as described above. Since the E2-E1E2TATA interaction did not reach saturation, the data were not fit to a curve, and the [E2]0.5 (≈Kd) could only be estimated. The E1-E2-E1E2TATA interaction was analyzed by Hill fit to examine cooperativity of E2 binding. Because E2 binds to two sites, the graph is expressed as total E2 concentration as a function of relative anisotropy change, experimental saturation being 1.0. The binding curves correspond to an [E2]0.5 bound of 2.1 nM with a Hill coefficient of 1.5 (with E1, circles; r2 = 0.99) and an [E2]0.5 bound of >150 nM (without E1, squares; estimated).
Since our previous findings have shown that E1 promotes E2 association with DNA (4), the [E2]0.5 bound of E2-E1E2TATA was also measured in the presence of excess E1. E2 was titrated into a solution of 1 nM E1E2TATA and 10 nM E1, and E2 binding became saturable (Fig. 6). The addition of E1 substantially reduced the [E2]0.5 bound of E2 for E1E2TATA from >150 nM to 2.1 nM. Because there are two E2 binding sites on E1E2TATA, the resulting [E2]0.5 bound is a combination of two sets of E2 dimers binding the oligonucleotide, and the steep slope of the curve is characteristic of cooperative binding. A Hill coefficient of 1.5 was estimated.
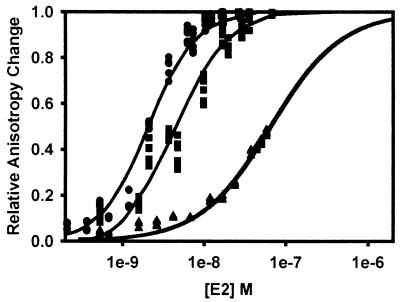
Since TBPc was an effective inhibitor of E2 binding to E2TATA, E2 was titrated into E1E2TATA with 10 nM E1 and various amounts of TBPc in excess over the oligonucleotide to determine if TBPc inhibits E2 binding in the presence of E1 (Fig. 7). As above, E2-E1E2TATA association was determined by changes in fluorescence anisotropy. Titration of E2 into a solution containing 1 nM E1E2TATA, 10 nM E1, and 2 nM TBPc yielded an apparent [E2]0.5 bound of 6.3 nM and a Hill coefficient of 1.4 (Fig. 7). The apparent [E2]0.5 bound increased to approximately 65 nM when E2 was titrated in the presence 1 nM E2TATA, 10 nM E1, and 8 nM TBPc (Fig. 7). When compared to E2 binding in the absence of TBPc (Fig. 7), these data suggest that TBPc effectively inhibits E2-DNA binding even in the presence of E1. Importantly, the Ki of TBPc in these experiments was determined to be 0.6 ± 0.3 nM, within the statistical deviation of the Ki determined for TBPc-mediated antagonism of E2 binding to E2TATA in the absence of E1 and consistent with the IC50 calculated by replication assays.
FIG. 7.
Association of HPV-11 E2 and HPV-11 E1 with E1E2TATA in the presence and absence of excess TBPc. One nanomolar E1E2TATA and 10 nM E1 in titration buffer were titrated with E2. In titrations with excess TBPc, a final concentration of 2 or 8 nM TBPc was added before titration with E2. Data were collected and analyzed as above. The binding curves correspond to apparent [E2]0.5 bound values (as defined above) of 2.1 nM (no TBPc, circles; Hill coefficient = 1.5; r2 = 0.99), 6.3 nM (with 2 nM TBPc, squares; Hill coefficient = 1.4; r2 = 0.98), and 65 nM (with 8 nM TBPc, triangles; r2= 0.98). The Ki of TBPc was determined to be 0.6 ± 0.3 nM.
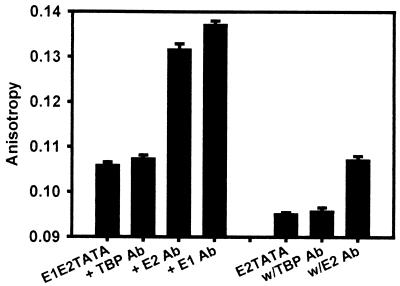
In comparing one titration curve to another, it was important to ascertain if the final complexes at E2 saturation were the same. To determine the proteins present on E2TATA or E1E2TATA at saturating E2 concentrations in the presence of TBPc, the differences in fluorescence anisotropy were measured when saturating amounts of rabbit polyclonal anti-TBPc and anti-E2 antibodies were added to the E2-TBPc-oligonucleotide mixtures (Fig. 8). The addition of anti-TBPc antibody did not cause statistically significant anisotropy changes for either oligonucleotide; however, the subsequent addition of anti-E2 antibody made a measurable difference in anisotropy for both oligonucleotides. This implies that E2, but not TBPc, was present on each oligonucleotide at saturating E2 concentrations. Anti-E1 antibody was then added in the case of E1E2TATA, yielding another significant increase in anisotropy, implying that E1 was also present in the final, E2-saturated complex with E1E2TATA. Thus, E2-TBPc-E2TATA and E1-E2-TBPc-E1E2TATA were not the complexes at saturation. Rather, E2-E2TATA and E1-E2-E1E2TATA were the complexes at E2 saturation.
FIG. 8.
No TBPc is present on fluorescent oligonucleotides at the point of saturation with E2. First anti-TBP and then anti-E2 rabbit polyclonal antibodies were added to 1 nM E2TATA or E1E2TATA, 2 nM TBPc, a saturating concentration of E2 (32 nM), and 10 nM E1, in the case of E1E2TATA, in titration buffer. A small (nonsaturating) amount of murine anti-E1 antibody was added to the E1E2TATA sample after anti-E2 was added. After each addition of antibody the change in fluorescence anisotropy was measured. The addition of anti-TBP antibody did not yield a statistically significant anisotropy increase for either oligonucleotide saturated with E2, but the addition of anti-E2 (and anti-E1) antibody did produce significant increases.
DISCUSSION
In this work, we demonstrate that TBPc is a potent, noncompetitive inhibitor of E1 binding to the viral origin and HPV replication (Fig. 2–3). Since TBPc and E1 do not interact directly, TBPc inhibition of E1-ori association is proposed to be mediated through TBPc antagonism of E2-DNA association. In support of this proposal, we showed that TBPc was a potent, direct, competitive inhibitor of E2-LCR binding, and inhibition was due to steric competition for DNA binding (Fig. 4 to 8). The strength of the steric inhibition of E2 binding (0.5 to 0.6 nM) was akin to the strength of the IC50 (0.56 nM) shown in replication assays. While others have predicted for E6/E7 transcription that E2 and TBP displace each other from the LCR (6, 53), our quantitative methods have allowed us to show that this phenomenon occurs and that it affects DNA replication as well. Our results support a model of viral replication control that involves transcription as well as replication factors. This model may be extended to other viruses, since the interaction of TBP with simian virus 40 T antigen, which shares functional similarities with E2 and E1, also interferes with simian virus 40 DNA replication in vitro (18). This suggests that other viruses employ host transcription factors to modulate replication.
In reaching the conclusions of this work, some seeming irregularities in the data surfaced. As shown in Fig. 5, where E2 is titrated onto E2TATA in the presence of TBPc, the slopes of the data increased at increasing E2 concentrations. This was unexpected given the presence of only a single E2 site on the fluorescent oligonucleotide. This effect was not seen in the case without TBPc. A possible explanation for this phenomenon would be interaction between free E2 and TBPc in solution that effectively titrated out inhibitor at high E2 concentrations. This is supported by the Kd (2.3 nM) calculated for the TBPc-E2 interaction (Fig. 4). In the absence of TBPc available to bind DNA at high E2 concentrations (i.e., removing the competitive inhibitor), E2 would bind E2TATA increasingly as it did in the curve without TBPc present. This effect is not seen at low E2 concentrations because nearly all of the TBPc is free in solution or bound to DNA. Since this circumstance appears to occur at concentrations above the apparent Kd, it is unlikely to have a large effect on the overall apparent Kd used in the calculations for TBPc's Ki. The phenomenon, however, does portend a dual mechanism for overcoming TBPc-mediated E2 binding suppression at increasing E2 concentrations.
A second irregularity is that E2TATA and E1E2TATA were titrated under identical conditions with E2, and titration onto the former oligonucleotide was saturable while titration onto the latter was not (Fig. 5 and 6). This is consistent with previous findings using a 62-bp oligonucleotide containing one E2 site and suggests that variation of DNA structure surrounding the E2 binding site palindrome may be a determinant of DNA binding affinity (4). Others have also presented evidence that DNA binding by BPV-1 and HPV-16 E2 are also affected by structures extending beyond the 12-bp E2 binding site palindrome (30, 54). Though one might speculate that E1E2TATA contains secondary structure that would interfere with E2 binding, this possibility is unlikely. We purified the PCR product from a 2% agarose gel and noted that one product of the predicted length was purified. This would refute the notion that E1E2TATA contains secondary structure. Given E2's very low tissue concentrations, significant E2 binding to the tandem sites in the P93 promoter is likely to occur only with the concurrent association of the E1 protein, as the presence of E1 greatly enhances binding of E2 to the longer oligonucleotide, E1E2TATA (Fig. 6). E2's cooperative binding to adjacent sites upon the addition of E1 shows that the decreased affinity for the long oligonucleotide is not due to steric occlusion of one E2 binding site by the other. The cooperation of E1-E2 and E2-E2 association at the P93 promoter may work to block transcription and initiate replication by preventing TBP binding to the TATA box.
Role of E1/E2 binding in transcription control.
Our data complement much of what others have shown for transcriptional control of the P93 promoter. E2-mediated dislocation of TBP from the TATA site in P93 would explain the inhibitory effect that E2 has in some transcriptional assays (7, 13, 16, 40, 51, 52, 53, 56). In this work, excess TBPc consistently inhibits E2-DNA association with a Ki of 0.5 to 0.6 nM (Fig. 5 and 7). According to the principle of conservation of Gibb's free energy (59), we predict in turn that E2 would inhibit TBPc binding at P93. Indeed, E2 does displace TBPc from the oligonucleotides (Fig. 8), though TBPc binds each oligonucleotide when it is added prior to the addition of E2 (data not shown). This supports conclusions made by others who found that TBP and E2 binding at P93 were mutually exclusive (19). As indicated by the identical Kis calculated in Fig. 5 and 7, the mechanism of TBPc inhibition is not oligonucleotide length dependent, suggesting that structures outside the TATA site are unimportant in directing E2-P93 binding inhibition.
One might imagine that DNA bending or other distortion conferred by E2 binding would inhibit TBPc binding. When E2 interferes with TBPc binding, bending of the DNA in P93 may add to E2's inhibitory effect, but the strength of TBPc's Ki would suggest that it is not very significant in our study. Additionally, if DNA bending by E2 contributed a great deal of binding inhibition to TBPc, the presence of E1, which stabilizes E2 on the DNA, should increase the Ki of TBPc. We have shown in fact that TBPc's Ki does not change in the presence of E1.
Using transcriptional assays, others have demonstrated that E2's inhibition of TBP binding is independent of cofactors and transcriptional corepressors (19). They go on to speculate that E2 inhibits multiple steps of the transcriptional preinitiation assembly complex and that steric interference may not be important. Even the simplest transcriptional assay is not ideally suited to measuring the intrinsic value of steric interference and the essential nature of E2-TBP binding repression. In addition, they did not assess the effect of E1 or its ability to enhance E2 binding in their assays. This is an important effect to consider, since previous studies have indicated that HPV-16 and BPV-1 E1-mutant viruses had increased transforming and transcriptional activity because regulation from the major early promoters P97 and P89 was disrupted (27, 41, 43). Consistent with transcriptional repression by E1, high concentrations of BPV-1 E1 protein significantly repressed transcription from P89 (28, 42). In contrast to transcriptional assays, our fluorescence system has the advantage of looking directly at the E1-E2-TBPc-P93 interaction, and though E2 may play a more complex role in transcriptional repression, the data here suggest that the underlying mechanism of binding repression is steric hindrance. This repression phenomenon may differ throughout the genome where E2 binding site affinities change and may explain the differences in the trans activation or repression capabilities of E2 depending on the promoter contexts.
Model for HPV replication initiation.
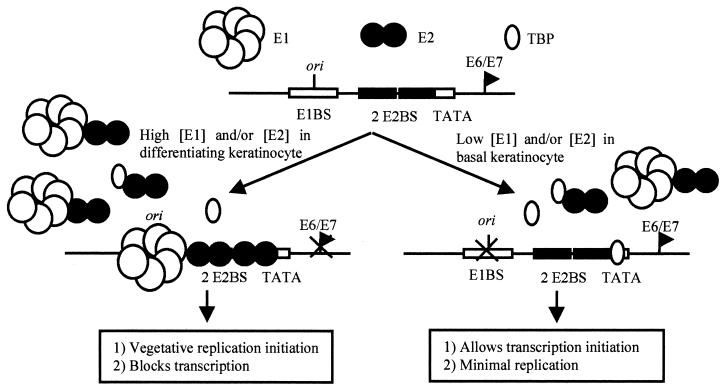
Combining these observations, we propose a working model for coordinated control of papillomavirus transcription and replication based upon interactions between host cell transcription factors and the viral E1 and E2 proteins (Fig. 9). The fact that TBPc behaves as a noncompetitive inhibitor of E1 yet acts competitively with E2 yields insight into the mechanism of TBPc inhibition. In this model, transcription factor proteins, such as TBP, would bind the viral LCR, thereby excluding E2-LCR association. In the absence of binding of E2 to the LCR, E1 binding to the viral origin of replication would be inefficient, resulting in TBP-mediated suppression of DNA replication by stimulating transcription. Low concentrations of E1 and E2 in undifferentiated keratinocytes may allow enough viral DNA replication to occur during cell division to maintain the genome. Reciprocally, increased E1 and E2 protein concentrations, such as occur during differentiation of papillomavirus-infected keratinocytes (23, 35), would promote E1 and E2 binding to the LCR, thereby displacing TBP from its binding site. It is uncertain what happens to TBP levels during keratinocyte differentiation, so our model reflects the idea that increasing E1 and E2 levels initiate vegetative replication, not necessarily a decrease in the TBP concentration. Decreased binding of TBP at the P93 promoter would suppress transcription of the E6/E7 open reading frames and promote initiation of replication. This steric model provides a simple explanation of how TBP represses replication by inhibiting binding of the E1-E2 complex at the ori.
FIG. 9.
Model of TBP-mediated coordinated control of viral replication and transcription. See Discussion.
In vivo, the processes coordinating transcription and replication are more complex than described above. The interrelations between TBPc, E2, and E1 as described here are clearly a small part of the larger, more complex, control apparatus. This process likely involves additional host transcription factors, such as Sp1. Sp1 is an appropriate transcription factor to examine next, as there is evidence to support that its concentrations vary during keratinocyte differentiation (1, 24). An Sp1 site overlaps the second E2 binding site upstream from the P93 start site. Investigators have already demonstrated a possible steric mechanism for E2 repression of Sp1 binding at P93 (12). One could predict that the formation of an E1-E2 complex would turn on replication by overcoming Sp1 binding in a manner similar to TBP, inhibiting at the same time binding of TBP and Sp1 to P93. Furthermore, host cell replication factors, such as DNA polymerase α, associate with E1 and very likely affect the affinity of E1 for DNA (36). Each of these factors will impinge upon the E2-DNA interaction, directly or through other proteins, to provide differentiation-specific control of papillomavirus transcription and replication.
Acknowledgments
We are grateful to Daniel Gewirth for providing TBPc and Warren Rocque for supplying E1. We also thank William Phelps for providing pW7, pUC18/7870-99, and E1 and E2 antibodies. We extend our appreciation to Robert Ott for replication advice and to Ellen Fanning for a critical review of the manuscript.
This work was supported by grants from The Smokeless Tobacco Research Council, Inc., The Children's Miracle Network, and the National Institutes of Health (R01 CA81214).
REFERENCES
- 1.Apt, D., R. M. Watts, G. Suske, and H. U. Bernard. 1996. High Sp1/Sp3 ratios in epithelial cells during epithelial differentiation and cellular transformation correlate with the activation of the HPV-16 promoter. Virology 224:281-291. [DOI] [PubMed] [Google Scholar]
- 2.Barksdale, S. K., and C. C. Baker. 1993. Differentiation-specific expression from the bovine papillomavirus type 1 P2443 and late promoters. J. Virol. 67:5605-5616. [DOI] [PMC free article] [PubMed] [Google Scholar]
- 3.Bream, G. L., C. A. Ohmstede, and W. C. Phelps. 1993. Characterization of human papillomavirus type 11 E1 and E2 protein expressed in insect cells. J. Virol. 67:2655-2663. [DOI] [PMC free article] [PubMed] [Google Scholar]
- 4.Chao, S.-F., W. J. Rocque, S. Daniel, L. E. Czyzyk, W. C. Phelps, and K. A. Alexander. 1999. Subunit affinities and stoichiometries of the human papillomavirus type 11 E1:E2:DNA complex. Biochemistry 38:4586-4594. [DOI] [PubMed] [Google Scholar]
- 5.Chiang, C.-M., G. Dong, T. R. Broker, and L. T. Chow. 1992. Control of human papillomavirus type 11 origin of replication by the E2 family of transcription regulatory proteins. J. Virol. 66:5224-5231. [DOI] [PMC free article] [PubMed] [Google Scholar]
- 6.Chin, M. T., R. Hirochika, H. Hirochika, T. R. Broker, and L. T. Chow. 1988. Regulation of human papillomavirus type 11 enhancer and E6 promoter by activating and repressing proteins from the E2 open reading frames: functional and biochemical studies. J. Virol. 62:2994-3002. [DOI] [PMC free article] [PubMed] [Google Scholar]
- 7.Chin, M. T., T. R. Broker, and L. T. Chow. 1989. Identification of a novel constitutive enhancer element and an associated binding protein: implications for human papillomavirus type 11 enhancer regulation. J. Virol. 63:2967-2976. [DOI] [PMC free article] [PubMed] [Google Scholar]
- 8.Cormack, B. P., M. Strubin, A. S. Poticelli, and K. Struhl. 1991. Functional differences between yeast and human TFIID are localized to the highly conserved region. Cell 65:341-348. [DOI] [PubMed] [Google Scholar]
- 9.Cripe, T. P., T. H. Haugen, J. P. Turk, F. Tabatabai, P. G. Schmid III, M. Durst, L. Gissmann, A. Roman, and L. P. Turek. 1987. Transcriptional regulation of the human papillomavirus-16 E6-E7 promoter by a keratinocyte-dependent enhancer, and by viral E2 trans-activator and repressor gene products: implications for cervical carcinogenesis. EMBO J. 6:3745-3753. [DOI] [PMC free article] [PubMed] [Google Scholar]
- 10.Dartmann, K., E. Schwarz, L. Gissmann, and H. zur Hausen. 1986. The nucleotide sequence and genome organization of human papillomavirus type 11. Virology 151:124-130. [DOI] [PubMed] [Google Scholar]
- 11.Dixon, E. P., G. L. Pahel, W. J. Rocque, J. A. Barnes, D. C. Lobe, M. H. Hanlon, K. A. Alexander, S.-F. Chao, K. Lindley, and W. C. Phelps. 2000. The E1 helicase of human papillomavirus type 11 binds to the origin of replication with low specificity. Virology 270:345-357. [DOI] [PubMed] [Google Scholar]
- 12.Dong, G., T. R. Broker, and L. T. Chow. 1994. Human papillomavirus type 11 E2 proteins repress the homologous E6 promoter by interfering with the binding of host transcription factors to adjacent elements. J. Virol. 68:1115-1127. [DOI] [PMC free article] [PubMed] [Google Scholar]
- 13.Dostatni, N., P. F. Lambert, R. Sousa, J. Ham, P. M. Howley, and M. Yaniv. 1991. The functional BPV-1 E2 trans-activating protein can act as a repressor by preventing formation of the initiation complex. Genes Dev. 5:1657-1671. [DOI] [PubMed] [Google Scholar]
- 14.Durst, M., A. Kleinheinz, M. Hotz, and L. Gissmann. 1985. The physical state of human papillomavirus type 16 DNA in benign and malignant genital tumours. J. Gen. Virol. 66:1515-1522. [DOI] [PubMed] [Google Scholar]
- 15.Gill, G., and R. Tijan. 1991. A highly conserved domain of TFIID displays species specificity in vivo. Cell 65:333-340. [DOI] [PubMed] [Google Scholar]
- 16.Goodwin, E. C., L. K. Naeger, D. E. Breiding, E. J. Androphy, and D. DiMaio. 1998. Transactivation-competent bovine papillomavirus E2 protein is specifically required for efficient repression of human papillomavirus oncogene expression and for acute growth inhibition of cervical carcinoma cell lines. J. Virol. 72:3925-3934. [DOI] [PMC free article] [PubMed] [Google Scholar]
- 17.Hawley-Nelson, P., K. H. Vousden, N. L. Hubbert, D. R. Lowy, and J. T. Schiller. 1989. HPV16 E6 and E7 proteins cooperate to immortalize human foreskin keratinocytes. EMBO J. 8:3905-1910. [DOI] [PMC free article] [PubMed] [Google Scholar]
- 18.Herbig, U., K. Weisshart, P. Taneja, and E. Fanning. 1999. Interaction of the transcription factor TFIID with simian virus 40 large T antigen interferes with replication of the SV40 DNA in vitro. J. Virol. 73:1099-1107. [DOI] [PMC free article] [PubMed] [Google Scholar]
- 19.Hou, S. Y., S.-Y. Wu, T. Zhou, M. C. Thomas, and C.-M. Chiang. 2000. Alleviation of human papillomavirus E2-mediated transcriptional repression via formation of a TATA binding protein (or TFIID)-TFIIB-RNA polymerase II-TFIIF preinitiation complex. Mol. Cell. Biol. 20:113-125. [DOI] [PMC free article] [PubMed] [Google Scholar]
- 20.Hughes, F. J., and M. A. Romanos. 1993. E1 protein of human papillomavirus is a DNA helicase/ATPase. Nucleic Acids Res. 21:5817-5823. [DOI] [PMC free article] [PubMed] [Google Scholar]
- 21.Jenkins, O., D. Earnshaw, G. Sarginson, A. Del Vecchio, J. Tsai, H. Kallender, B. Amegadzie, and M. Browne. 1996. Characterization of the helicase and ATPase activity of human papillomavirus type 6b E1 protein. J. Gen. Virol. 77:1805-1809. [DOI] [PubMed] [Google Scholar]
- 22.Juo, Z.-S., T.-K. Chiu, P. M. Leiberman, I. Baikalov, A. J. Berk, and R. E. Dickerson. 1996. How proteins recognize the TATA box. J. Mol. Biol. 261:239-254. [DOI] [PubMed] [Google Scholar]
- 23.Klumpp, D. J., and L. A. Laimins. 1999. Differentiation-induced changes in promoter usage for transcripts encoding the human papillomavirus type 31 replication protein E1. Virology 257:239-246. [DOI] [PubMed] [Google Scholar]
- 24.Kumar, A. P., and A. P. Butler. 1999. Enhanced Sp1 DNA-binding activity in murine keratinocyte cell lines and epidermal tumors. Cancer Lett. 137:159-165. [DOI] [PubMed] [Google Scholar]
- 25.Kuo, S.-R., J.-S. Liu, R. T. Broker, and L. T. Chow. 1994. Cell-free replication of the human papillomavirus DNA with homologous viral E1 and E2 proteins and human cell extracts. J. Biol. Chem. 269:24058-24065. [PubMed] [Google Scholar]
- 26.Lakowicz, J. R. 1999. Fluorescence anisotropy, p. 291-319. In Principles of fluorescence spectroscopy, 2nd ed. Plenum Press, New York, N.Y.
- 27.Lambert, P. F., and P. M. Howley. 1988. Bovine papillomavirus type 1 E1 replication-defective mutants are altered in their transcriptional regulation. J. Virol. 62:4009-4015. [DOI] [PMC free article] [PubMed] [Google Scholar]
- 28.Le Moal, M. A., M. Yaniv, and F. Thierry. 1994. The bovine papillomavirus type 1 (BPV) replication protein E1 modulates transcriptional activation by interacting with BPV1 E2. J. Virol. 68:1085-1093. [DOI] [PMC free article] [PubMed] [Google Scholar]
- 29.Li, J. J., and T. J. Kelly. 1984. Simian virus 40 DNA replication in vitro. Proc. Natl. Acad. Sci. USA 81:6973-6977. [DOI] [PMC free article] [PubMed] [Google Scholar]
- 30.Li, R., J. Knight, G. Bream, A. Stenlund, and M. R. Botchan. 1989. Specific recognition nucleotides and their DNA context determine the affinity of E2 protein for 17 binding sites in the BPV-1 genome. Genes Dev. 3:510-526. [DOI] [PubMed] [Google Scholar]
- 31.Liu, J.-S., S.-R. Kuo, T. R. Broker, and L. T. Chow. 1995. The functions of human papillomavirus type 11 E1, E2, and E2c proteins in cell-free DNA replication. J. Biol. Chem. 270:27283-27291. [DOI] [PubMed] [Google Scholar]
- 32.McBride, A. A., H. Romanczuk, and P. M. Howley. 1991. The papillomavirus E2 regulatory proteins. J. Biol. Chem. 266:18411-18414. [PubMed] [Google Scholar]
- 33.Mohr, I. J., R. Clark, S. Sun, E. J. Androphy, P. MacPherson, and M. R. Botchan. 1990. Targeting the E1 replication protein to the papillomavirus origin of replication by complex formation with the E2 transactivator. Science 250:1694-1699. [DOI] [PubMed] [Google Scholar]
- 34.Muller, F., Y. S. Seo, and J. Hurwitz. 1994. Replication of bovine papillomavirus type 1 origin-containing DNA in crude extracts and with purified proteins. J. Biol. Chem. 269:17086-17094. [PubMed] [Google Scholar]
- 35.Ozbun, M. A., and C. Meyers. 1998. Human papillomavirus type 31b E1 and E2 transcript expression correlates with vegetative viral genome amplification. Virology 248:218-230. [DOI] [PMC free article] [PubMed] [Google Scholar]
- 36.Park, P., W. Copeland, L. Yang, T. Wang, M. R. Botchan, and I. J. Mohr. 1994. The cellular DNA polymerase α-primase is required for papillomavirus DNA replication and associates with the viral E1 helicase. Proc. Natl. Acad. Sci. USA 91:8700-8704. [DOI] [PMC free article] [PubMed] [Google Scholar]
- 37.Rank, N. M., and P. F. Lambert. 1995. Bovine papillomavirus type 1 E2 transcriptional regulators directly bind two cellular transcription factors, TFIID and TFIIB. J. Virol. 69:6323-6334. [DOI] [PMC free article] [PubMed] [Google Scholar]
- 38.Reddy, P., and S. Hahn. 1991. Dominant negative mutations in yeast TFIID define a bipartite DNA-binding region. Cell 65:349-357. [DOI] [PubMed] [Google Scholar]
- 39.Rocque, W. J., D. J. T. Porter, J. A. Barnes, E. Dixon, D. C. Lobe, J.-L. Su, D. H. Willard, R. Gaillard, J. P. Condreay, W. C. Clay, C. R. Hoffman, L. K. Overton, G. Pahel, T. A. Kos, and W. C. Phelps. 2000. Replication-associated activities of purified human papillomavirus type 11 E1 helicase. Protein Expr. Purif. 18:148-159. [DOI] [PubMed] [Google Scholar]
- 40.Romanczuk, H., F. Thierry, and P. M. Howley. 1990. Mutational analysis of cis elements involved in E2 modulation of human papillomavirus type 16 P93 and type 18 P105 promoters. J. Virol. 64:2849-2859. [DOI] [PMC free article] [PubMed] [Google Scholar]
- 41.Romanczuk, H., and P. M. Howley. 1992. Disruption of either the E1 or E2 regulatory gene of human papillomavirus type 16 increases viral immortalization capacity. Proc. Natl. Acad. Sci. USA 89:3159-3163. [DOI] [PMC free article] [PubMed] [Google Scholar]
- 42.Sandler, A. B., S. B. Vande Pol, and B. A. Spalholz. 1993. Repression of bovine papillomavirus type 1 transcription by the E1 replication protein. J. Virol. 67:5079-5087. [DOI] [PMC free article] [PubMed] [Google Scholar]
- 43.Schiller, J. T., E. Kleiner, E. J. Androphy, D. R. Lowy, and H. Pfister. 1989. Identification of bovine papillomavirus E1 mutants with increased transforming and transcriptional activity. J. Virol. 63:1775-1782. [DOI] [PMC free article] [PubMed] [Google Scholar]
- 44.Schubert, F., K. Ahlert, D. Cech, and A. Rosenthal. 1990. One-step labeling of oligonucleotides with fluorescein during automated synthesis. Nucleic Acids Res. 18:3427. [DOI] [PMC free article] [PubMed] [Google Scholar]
- 45.Sedman, J., and A. Stenlund. 1998. The papillomavirus E1 protein forms a DNA-dependent hexameric complex with ATPase and DNA helicase activities. J. Virol. 72:6893-6897. [DOI] [PMC free article] [PubMed] [Google Scholar]
- 46.Segel, I. H. 1975. Simple inhibition systems, p. 100-160. In enzyme kinetics: behavior and analysis of rapid equilibrium and steady-state enzyme systems. John Wiley & Sons, New York, N.Y.
- 47.Seo, Y. S., F. Muller, M. Lusky, E. Gibbs, H. Y. Kim, B. Phillips, and J. Hurwitz. 1993. Bovine papilloma virus (BPV)-encoded E2 protein enhances binding of E1 protein to the BPV replication origin. Proc. Natl. Acad. Sci. USA 90:2865-2869. [DOI] [PMC free article] [PubMed] [Google Scholar]
- 48.Smotkin, D., and F. O. Wettstein. 1986. Transcription of human papillomavirus type 16 early genes in a cervical cancer and a cancer-derived cell line and identification of the E7 protein. Proc. Natl. Acad. Sci. USA 83:4680-4684. [DOI] [PMC free article] [PubMed] [Google Scholar]
- 49.Smotkin, D., H. Prokoph, and F. O. Wettstein. 1989. Oncogenic and nononcogenic human genital papillomaviruses generate the E7 mRNA by different mechanisms. J. Virol. 63:1441-1447. [DOI] [PMC free article] [PubMed] [Google Scholar]
- 50.Steger, G., J. Ham, O. Lefebvre, and M. Yaniv. 1995. The bovine papillomavirus 1 E2 protein contains two activation domains: one that interacts with TBP and another that functions after TBP binding. EMBO J. 14:329-340. [DOI] [PMC free article] [PubMed] [Google Scholar]
- 51.Stenlund, A., and M. R. Botchan. 1990. The E2 trans-activator can act as a repressor by interfering with a cellular transcription factor. Genes Dev. 4:123-136. [DOI] [PubMed] [Google Scholar]
- 52.Tan, S.-H., B. Gloss, and H.-U. Bernard. 1992. During negative regulation of the human papillomavirus-16 E6 promoter, the viral E2 protein can displace Sp1 from a proximal promoter element. Nucleic Acids Res. 20:251-256. [DOI] [PMC free article] [PubMed] [Google Scholar]
- 53.Tan, S.-H., L. E.-C. Leong, P. A. Walker, and H.-U. Bernard. 1994. The human papillomavirus type 16 E2 transcription factor binds with low cooperativity to two flanking sites and represses the E6 promoter through displacement of Sp1 and TFIID. J. Virol. 68:6411-6420. [DOI] [PMC free article] [PubMed] [Google Scholar]
- 54.Thain, A., K. Webster, D. Emery, A. R. Clarke, and K. Gaston. 1997. DNA binding and bending by the human papillomavirus type 16 E2 protein. J. Biol. Chem. 272:8236-8242. [DOI] [PubMed] [Google Scholar]
- 55.Ustav, E., M. Ustav, P. Szymansky, and A. Stenlund. 1993. The bovine papillomavirus origin of replication requires a binding site for the E2 transcriptional activator. Proc. Natl. Acad. Sci. USA 90:898-902. [DOI] [PMC free article] [PubMed] [Google Scholar]
- 56.Vande Pol, S. B., and P. M. Howley. 1995. Negative regulation of the bovine papillomavirus E5, E6, and E7 oncogenes by the viral E1 and E2 genes. J. Virol. 69:395-402. [DOI] [PMC free article] [PubMed] [Google Scholar]
- 57.VanRanst, M., R. Tachezy, and R. D. Burk. 1996. Human papillomaviruses: a neverending journey? p. 1-19. In C. Lacey (ed.), Papillomavirus reviews: current research on papillomaviruses. Leeds University Press, Leeds, England.
- 58.Watanabe, S., T. Kanda, and K. Yoshiike. 1989. Human papillomavirus type 16 transformation of primary human embryonic fibroblasts requires expression of open reading frames E6 and E7. J. Virol. 63:965-969. [DOI] [PMC free article] [PubMed] [Google Scholar]
- 59.Weber, G. 1975. Energetics of ligand binding to proteins. Adv. Protein Chem. 29:1-83. [DOI] [PubMed] [Google Scholar]
- 60.Yang, L., R. Li, I. J. Mohr, R. Clark, and M. R. Botchan. 1991. Activation of BPV-1 replication in vitro by the transcription factor E2. Nature 353:628-632. [DOI] [PubMed] [Google Scholar]


