

Abstract
Serum response factor (SRF) binds a 1216-fold degenerate cis element known as the CArG box. CArG boxes are found primarily in muscle- and growth-factor-associated genes although the full spectrum of functional CArG elements in the genome (the CArGome) has yet to be defined. Here we describe a genome-wide screen to further define the functional mammalian CArGome. A computational approach involving comparative genomic analyses of human and mouse orthologous genes uncovered >100 hypothetical SRF-dependent genes, including 10 previously identified SRF targets, harboring a conserved CArG element within 4000 bp of the annotated transcription start site (TSS). We PCR-cloned 89 hypothetical SRF targets and subjected each of them to at least two of several validations including luciferase reporter, gel shift, chromatin immunoprecipitation, and mRNA expression following RNAi knockdown of SRF; 60/89 (67%) of the targets were validated. Interestingly, 26 of the validated SRF target genes encode for cytoskeletal/contractile or adhesion proteins. RNAi knockdown of SRF diminishes expression of several SRF-dependent cytoskeletal genes and elicits an attending perturbation in the cytoarchitecture of both human and rodent cells. These data illustrate the power of integrating existing algorithms to interrogate the genome in a relatively unbiased fashion for cis-regulatory element discovery. In this manner, we have further expanded the mammalian CArGome with the discovery of an array of cyto-contractile genes that coordinate normal cytoskeletal homeostasis. We suggest one function of SRF is that of an ancient master regulator of the actin cytoskeleton.
One of the more formidable challenges in the genomic revolution is delineating functional DNA elements within the 98% of the genome comprising non-coding sequence. Such elements include structural, recombinatorial, origin of replication, and transcriptional regulatory sequences. The latter have been of particular interest inasmuch as they facilitate all spatio-temporal patterns of gene expression during development and throughout the life of an organism. Moreover, an increasing number of human diseases have been linked to altered expression of genes due to polymorphisms within regulatory elements, some of which reside considerable distances from a gene's core promoter (Kleinjan and van Heyningen 2005). Several experimental methods have been developed to interrogate genomes for non-coding regulatory sequences. Chromatin immunoprecipitation (ChIP) assays coupled to microarrayed genomic sequences (“ChIP-chip”) have been instrumental in defining regulatory sequences in yeast and mammals (Horak et al. 2002; Lee et al. 2002; Blais et al. 2005). A related technique called serial analysis of chromatin occupancy has recently been reported for the definition of the cyclic AMP response element binding protein (CREB) regulon (Impey et al. 2004). Still another genome-wide approach to defining regulatory elements takes advantage of the fact that active genes are hypersensitive to DNase I cleavage (Crawford et al. 2004; Sabo et al. 2004). While these methods have attracted much interest in defining regulatory elements on a genome-wide scale, they are biased for the cell type used and/or its physiological state at the time of assay. Consequently, these methods will likely only capture those regulatory elements engaged for transcription in the cell or tissue under analysis and may miss functional elements engaged in other cell types or conditional states.
The burgeoning field of comparative genomics offers a complementary, facile approach to regulatory element discovery. Numerous reports have documented the utility of comparing orthologous sequences for functionally important regulatory elements (Hardison et al. 1997; Venkatesh et al. 1997; Wasserman et al. 2000; Nobrega and Pennacchio 2003; Thomas et al. 2003; Liu et al. 2004; Xie et al. 2005), and a growing list of algorithms has evolved for high-throughput cis regulatory element discovery (Loots et al. 2002; Boffelli et al. 2003; Pennacchio and Rubin 2003; Ovcharenko et al. 2004; Thompson et al. 2004; Dieterich et al. 2005). These analyses are particularly attractive for genome-wide surveys of well-defined regulatory elements. For example, CREB binds an 8-bp element (consensus TGACGTCA) that is generally found within a few hundred base pairs upstream of the transcription start site (TSS) (Montminy 1997; Tinti et al. 1997). A hidden Markov model based on known CREB target genes was recently used to survey the genome for novel, evolutionarily conserved CREB-binding sites, and 34 candidate target genes were identified. ChIP and reporter assays validated more than a dozen of these targets as genuine CREB target genes (Conkright et al. 2003). Another well-characterized transcription factor-binding site is the CArG box, a 10-bp element (consensus CCW6GG) bound by the widely expressed serum response factor (SRF) (Johansen and Prywes 1995; Treisman et al. 1998; Reecy et al. 1999; Miano 2003). SRF binding and crystal structure studies have helped elucidate the plasticity of the 10-bp CArG box (Leung and Miyamoto 1989; Pellegrini et al. 1995). These and scores of other reports have led to the definition of a functional CArG box as one in which the 10-bp consensus can deviate by no more than 1 bp across the CArG element (e.g., CCSWWWWWGG) yielding 1216 potential sequences that can be bound by SRF. In addition to base plasticity across the CArG box, there appears to be a bias for position as well since virtually all known CArG elements reside within 4 kb of the TSS (see Supplemental Table 1).
SRF is a versatile transcription factor that toggles between disparate programs of gene expression related to growth and muscle differentiation (Miano 2003). Growth genes include a variety of proto-oncogenes (e.g., Fos) and growth factor ligand/receptors (e.g., Il2ra). Muscle differentiation genes encompass various components of the actin-myosin complex found in each of the three muscle lineages as well as more specialized muscle-specific genes (Johansen and Prywes 1995; Miano 2003). The importance of SRF in normal developmental processes has been documented in species ranging from yeast to mice (Elble and Tye 1991; Guillemin et al. 1996; Arsenian et al. 1998; Escalante and Sastre 1998; Fraser et al. 2000; Miano et al. 2004; Parlakian et al. 2004; Alberti et al. 2005; Li et al. 2005; Niu et al. 2005). A clear understanding of SRF's functional role in developmental and homeostatic processes will require elucidating the full complement of SRF-dependent target genes. Studies using microarray assays have revealed several new SRF target genes with >100 hypothetical targets awaiting full validation (Philippar et al. 2004; Selvaraj and Prywes 2004; Tullai et al. 2004). More recently, a ChIP-like SRF-binding assay uncovered scores of potential SRF targets with 43 functionally validated (Zhang et al. 2005). Here, we have used an in silico approach toward further defining the functional mammalian CArGome and report on more than 100 new genes containing conserved CArG sequences, with over half of these functionally validated. Nearly half of the validated gene set encodes for proteins having a direct or indirect role in cytoskeletal-related processes. Consistent with this finding, RNA interference studies in which endogenous SRF is knocked down show compromised expression of various cytoskeletal genes and disruption in normal cytoarchitecture. We discuss these results in the context of a model wherein SRF, which is itself regulated by actin dynamics (Sotiropoulos et al. 1999), governs actin cytoskeletal homeostasis through the direct activation of numerous cytoskeletal target genes.
Results
Genome-wide computational screen for CArG-containing genes
Based on the statistical frequency of CArG boxes (1216 combinations; 1 CArG sequence every ∼910 bp), we estimate that more than 3 million CArG elements exist in the mouse genome. To design a rational approach toward elucidating functionally relevant CArG boxes among such a theoretically large number, we took advantage of the fact that previously characterized CArG sequences reside relatively close to the TSS. Thus, the average distance of 92 functionally characterized CArG elements from the TSS is 855 ± 1391 bp, with the vast majority (89/92; 97%) residing within 4 kb of the TSS (see Supplemental Table 1). These data, combined with our knowledge of the strict sequence requirements for SRF binding to CArG (see above), facilitated the development of a genome-wide screen for conserved CArG elements as outlined in Figure 1. This computational approach yielded 188 potential SRF-target genes with an additional six targets predicted based on a manual comparison of genes related to the cytoskeleton (see Methods and Supplemental Table 2). To determine the accuracy of our computational screen, each predicted mouse CArG element was subjected to a manual analysis to ascertain whether the orthologous human CArG was, indeed, conserved in both sequence and in space. The results of this analysis revealed 72/188 (38.3%) targets containing predicted mouse CArGs that either were not a true CArG sequence (e.g., CCATATATAC for Pcdh12) or were not conserved when compared to human (e.g., CCTAGAAAGG versus CGGAGGAAGG for mouse and human Hoxb7, respectively) (see Supplemental Table 2). The remaining 116/188 (61.7%) putative SRF targets contain conserved CArG sequences, including 10 (Acta2, Actb, Actg2, Cnn1, Cryab, Fos, Nrf4a1, Tagln1, Tnnc2, and Vcl) previously identified and validated (Schneider et al. 1992; Johansen and Prywes 1995; Miano 2003). We therefore focused our analysis on the 106 potentially novel SRF-dependent target genes (see Table 1).
Figure 1.

General strategy for defining the mammalian CArGome. Bioinformatics pipeline for evaluating mouse and human orthologous pairs of genes having accurately annotated TSS for the presence of conserved CArG boxes predicted either computationally (83) or manually (six) as described in Methods.
Table 1.
106 computer-predicted SRF target genes
Italicized genes (89) had conserved CArG plus flanking sequences PCR-amplified for experimental validation. All but six were amplified and authenticated by sequence analysis. The remaining 17 targets (bold italicized) have conserved CArG sequences within coding exons and were not pursued (see Methods for further details).
CArG element position and GO annotation of predicted SRF target genes
Figure 2 contrasts the relative positions to the TSS and the Gene Ontology (GO) annotation (Ashburner et al. 2000) of the 106 predicted CArG elements as compared to the 92 previously characterized CArG elements. Most known CArG sequences (81/92; 88%) are found in the 5′-promoter region with virtually all of these within 1 kb of the annotated TSS, indicating a significant potential ascertainment bias for traditional CArG-box discovery (Fig. 2A). In contrast, our computationally predicted CArG elements follow a much broader distribution around the annotated TSS with a slight skew toward 3′ CArGs (Fig. 2B). The latter are evenly distributed between intronic and exonic sequences (Supplemental Table 2). Inasmuch as regulatory elements within coding exons are rare (Lang et al. 2005), we limited our validation of novel CArGs within coding exons to two targets (Dnajb1 and Impact) (Table 1).
Figure 2.

Features of novel CArG-containing genes. Comparison of (A,C) known and (B,D) computationally predicted CArG elements and corresponding genes with respect to distance from TSS (A vs. B) and GO annotation (C vs. D), respectively. Note broad distribution of predicted CArG elements around the TSS (B) as compared to known CArG boxes (A). Dotted vertical lines in A and B indicate the TSS.
The 92 known CArG sequences are found in 62 authentic SRF-dependent target genes (Supplemental Table 1). Among known SRF target genes, 92% can be GO classified as either cytoskeletal/contractile (45%), nucleic acid binding (24%), or signaling (23%) (Fig. 2C). In contrast, the proportions of these categories among the initial 10,320 mouse RefSeq transcripts considered are 6% cytoskeletal/contractile, 16% nucleic acid binding, and 19% signaling. Consistent with the activities ascribed to known SRF target genes (Miano 2003; Philippar et al. 2004; Zhang et al. 2005), GO terms for the computer-predicted SRF targets include cytoskeletal/contractile (22%), nucleic acid binding (29%), and signaling (23%) (Fig. 2D). Hypergeometric analysis of the GO-classified putative SRF target genes did not reveal a statistically significant bias for any particular category. Nevertheless, the data in Figure 2 indicate some similarities in GO terms between previously characterized SRF target genes and the CArG-containing genes predicted here with no enrichment for genes in other GO categories (e.g., immunity).
Experimental validation of 60 novel SRF target genes
To begin assessing whether the computationally predicted CArG sequences respond to SRF stimulation and bind SRF, we successfully cloned from mouse genomic DNA a total of 83 target genes' CArG-containing regions as well as six additional targets that were identified in a manual screen (see Methods). Figure 3 shows representative data obtained from our validation assays, which are summarized in Table 2. All candidate targets were analyzed for responsiveness to SRFVP16 in a luciferase reporter assay and scored positive if normalized activity surpassed a predetermined threshold based on a collection of negative control sequences without any CArG boxes (see Methods). We validated 60/89 (67%) of the predicted targets in this manner with SRFVP16-dependent activation over empty-vector control ranging from 2.2-fold (Urod) to 33-fold (Fhl1) (Fig. 3A; Table 2). The ratio of target genes validated across the cell lines used was 49/89 (C2C12), 45/89 (Rat 2 fibroblasts), and 27/89 (P19), with 14/89 validated in all three cell lines. The higher percent of targets validated in C2C12 and Rat 2 fibroblasts may relate to their differentiated state (cytocontractile) as compared to the undifferentiated P19 cells.
Figure 3.

Functional validation studies of CArG-containing sequences. (A) Representative luciferase assay results for a sample of computer-predicted CArG sequences (13 novel and two known) in C2C12 myoblasts. The white vertical line across bars indicates the experimentally defined threshold for scoring a target CArG sequence as positive over the value obtained from a collection of negative controls (see Methods); (NC) negative control is the tk promoter-linked luciferase plasmid only. (B) Representative in vitro SRF-binding assays for predicted CArG sequences. (Top panel) The results of radiolabeled target sequences binding to in vitro translated (IVT) SRF. Note supershift of each nucleoprotein complex with antibody to SRF. Addition of unlabeled target DNA attenuates the nucleoprotein signal. (Bottom panel) A cold competition EMSA in which a radiolabeled probe containing the CArG sequence CCTTATTTGG was incubated with IVT SRF in the absence or presence of a molar excess of each target CArG-containing sequence. The results indicate that all target sequences except Hoxc6 and Gpc4 compete with labeled CArG probe for binding to IVT SRF, thus reducing the signal intensity of the nucleoprotein complex. The smearing below Actn1 and Tspan13 is an artifact of the gel. (C) ChIP assay results for a select group of novel SRF targets showing an enriched PCR product from cross-linked DNA immunoprecipitated with SRF antibody. No detectable PCR product is seen for a region of a negative control sequence (NC) corresponding to the Myocd gene, which does not contain any CArG sequences. Moreover, little or no amplified product is observed for any of the CArG targets when an IgG control antibody is used to immunoprecipitate cross-linked DNA.
Table 2.
Novel SRF target gene summary
| Gene | RefSeq no. | CArG Seq | TESSa | Positionb | GO term | Luciferasec | SRF bindingd |
|---|---|---|---|---|---|---|---|
| Actn1 | NM_134156 | CCAAAAATGG | 12.78 | 1500, intron | Cytoskeletal | 4.5 ± 0.9e | EMSAf |
| Actr3 | NM_023735 | CCTTATAAGG | 14.49 | 630, intron | Cytoskeletal | 5.8 ± 0.3e | EMSAh/ChIP |
| Aoc3 | NM_009675 | CCATGTAAGG | 11.11 | 100, 5′UTR | Adhesion | 7.1 ± 3.5g | EMSAf |
| Arhe | NM_028810 | CCATAAAAGG | 13.58 | – 100, prom | Cytoskeletal | 19.1 ± 1.5g | EMSAf |
| Atp2a2 | NM_009722 | CCAAATTTGG | 12.86 | 1950, intron | Contractile | 3.5 ± 0.5e | EMSAf |
| Casq1 | NM_009813 | CTTAATATGG | 8.06 | – 300, prom | Contractile | 8.8 ± 1.2e | EMSAf |
| Cfl1 | NM_007687 | CCTTATTAGG | 13.76 | – 1400, prom | Cytoskeletal | 8.4 ± 0.3i | EMSAh/ChIP |
| Cfl2 | NM_007688 | CCTTATGTGG | 9.08 | 600, intron | Cytoskeletal | 5.1 ± 0.7g | EMSAh |
| Coro1a | NM_009898 | CCTTAAAAGG | 13.68 | 2160, intron | Cytoskeletal | 2.5 ± 0.9g | EMSAf |
| Dstn | NM_019771 | CCAAAGTAGG | 7.39 | – 640, prom | Cytoskeletal | 8.9 ± 0.4i | ChIP |
| Dtna | NM_010087 | CTTTATATGG | 9.33 | 1100, intron | Cytoskeletal | 8.0 ± 0.6g | EMSAf |
| Efha1 | NM_028643 | CCTTATTTGG | 14.23 | – 3320, prom | Contractile | 4.3 ± 2.0e | EMSAf |
| Enah | NM_010135 | CCAAATATGA | 7.96 | – 2941, prom | Cytoskeletal | 2.5 ± 0.8g | EMSAf |
| Enh | NM_019808 | CCTTATTTGG | 14.23 | 800, intron | Cytoskeletal | 7.4 ± 0.5g | EMSAh/ChIP |
| Flna | XM_207130 | CCTTATGAGG | 8.62 | – 2354, prom | Cytoskeletal | 6.7 ± 0.4e | ND |
| Flnc | XM_284175 | CCTAAAAAGG | 12.42 | 992, intron | Cytoskeletal | 5.6 ± 0.7e | EMSAf |
| Hspb7 | NM_013868 | CCTTATAAAG | 10.32 | 895, 5′UTR | Cytoskeletal | 16.0 ± 1.6g | EMSAf |
| Itga5 | NM_010577 | ACTTATAAGG | 8.85 | – 1700, prom | Adhesion | 4.7 ± 0.7e | EMSAh |
| Itgb1bp2 | NM_013712 | CCATGTTTGG | 10.85 | – 120, prom | Contractile | 14.9 ± 3.1i | EMSAh |
| Pfn1 | NM_011072 | CCAAATAAGG | 13.13 | 1288, intron | Cytoskeletal | 6.3 ± 0.7e | EMSAh/ChIP |
| Pln | NM_023129 | CCATTTAAGG | 13.62 | – 1200, prom | Contractile | 4.2 ± 0.8g | EMSAf |
| Sdc4 | NM_011521 | CAATTAAAGG | 8.41 | 2600, intron | Cytoskeletal | 2.3 ± 0.1e | ChIP |
| Tgfb1i1 | NM_009365 | CCATACATGG | 10.77 | – 1300, prom | Adhesion | 7.2 ± 0.8g | EMSAf |
| Tln | NM_011602 | CCAAATTTGG | 12.86 | 3500, intron | Cytoskeletal | 3.7 ± 0.5e | EMSAh |
| Tnnc1 | NM_009393 | CCATACAAGG | 10.30 | 1150, intron | Contractile | 14.6 ± 1.5g | EMSAf |
| Trip6 | NM_011639 | CCAAAATTGG | 12.06 | 2, 5′UTR | Cytoskeletal | 5.7 ± 1.0e | EMSAf |
| Copeb | NM_011803 | CCTTATTTGG | 14.23 | 2146, intron | Transcription | 11.3 ± 3.3i | EMSAf |
| Elf5 | NM_010125 | CCATAAAAGG | 13.58 | 3400, intron | Transcription | 6.6 ± 2.7g | EMSAf |
| Etv1 | NM_007960 | CCATTTAAGG | 13.62 | – 1179, prom | Transcription | 2.8 ± 0.5e | EMSAf |
| Fhl1 | NM_010211 | CCATATATGG | 14.86 | 1900, intron | Transcription | 33.8 ± 6.8i | EMSAf |
| Fhl2 | NM_010212 | CCTTATATGG | 14.95 | – 140, prom | Transcription | 4.2 ± 0.8e | EMSAf |
| Hoxb5 | NM_008268 | CCATATTTGG | 14.13 | – 100, prom | Transcription | 4.5 ± 0.2g | EMSAf |
| Hoxc6 | NM_010465 | CCGTTTATGG | 6.27 | – 1500, prom | Transcription | 2.8 ± 0.3g | UB |
| Lef1 | NM_010703 | CCTTAAATGG | 14.15 | 1900, intron | Transcription | 6.7 ± 0.6g | EMSAf |
| Nfatc4 | NM_023699 | CCTTTTTAGG | 12.99 | 300, intron | Transcription | 7.1 ± 0.9g | EMSAf |
| Nfyb | NM_010914 | CCTTTAAAGG | 12.91 | 950, intron | Transcription | 2.9 ± 0.5g | EMSAf |
| Ring1 | NM_009066 | CCACATAAGG | 8.35 | – 848, prom | Transcription | 3.8 ± 1.0g | EMSAf |
| Tcfap2b | NM_009334 | CCATAATTGG | 13.32 | 3200, intron | Transcription | 4.7 ± 0.7e | EMSAf |
| Wwtr1 | NM_133784 | CCAAATATGG | 13.59 | – 622, prom | Transcription | 6.3 ± 0.7g | EMSAf |
| Adm | NM_009627 | CCTTATAAGG | 14.49 | – 730, prom | Signaling | 7.5 ± 0.9e | EMSAf |
| Ctgf | NM_010217 | CCTTAGAAGG | 9.48 | 1800, nitron | Signaling | 5.1 ± 2.9g | EMSAf |
| Dm15 | NM_032418 | CCTTAAAAGG | 13.68 | 1400, intron | Signaling | 4.6 ± 0.7g | EMSAh |
| Dusp6 | NM_026268 | CCTTGTATGG | 11.68 | 3400, 3′UTR | Signaling | 3.2 ± 0.2g | EMSAf |
| Gpc4 | NM_008150 | CCATTCATGG | 10.00 | 1700, intron | Signaling | 2.3 ± 0.5e | UB |
| Igf2 | NM_010514 | CCAAATTTGG | 12.86 | 750, 5′UTR | Signaling | 6.1 ± 0.7g | EMSAf |
| Mrgprf | NM_145379 | CCAAATAAGG | 13.13 | – 1500, prom | Signaling | 4.1 ± 1.0g | EMSAf |
| P2rx1 | NM_008771 | GCTTATAAGG | 9.38 | – 2500, prom | Signaling | 10.2 ± 0.7g | EMSAf |
| Rrad | NM_019662 | CCTTTTTAGG | 12.99 | – 1540, prom | Signaling | 2.6 ± 0.6e | EMSAf |
| Tspan13 | NM_025359 | CCAAAAAAGG | 12.32 | 1000, intron | Signaling | 2.6 ± 0.4e | EMSAf |
| Bin1 | NM_009668 | CCATTTTTGG | 13.36 | 3187, intron | Transport | 11.7 ± 3.0e | EMSAf |
| Dnajb1 | NM_018808 | CCTTTTTTGG | 13.46 | 1750, coding | Transport | 4.1 ± 1.3g | EMSAh |
| Mrvil | NM_010826 | CCTTTTATGG | 14.19 | – 2681, prom | Transport | 5.0 ± 0.7g | EMSAf |
| Car3 | NM_007606 | CCTAATAAGG | 13.22 | – 60, prom | Metabolism | 5.4 ± 0.9e | EMSAf |
| Mrrf | NM_026422 | CCATATTTGG | 14.13 | 2859, intron | Metabolism | 11.0 ± 2.1g | EMSAf |
| Urod | NM_009478 | CCTAATTAGG | 12.50 | – 2150, prom | Metabolism | 2.2 ± 1.6e | EMSAf |
| Galnt3 | NM_015736 | CCTAATTAGG | 12.50 | 880, intron | Transferase | 5.0 ± 1.5e | UB |
| D14Ertd231e | NM_153414 | CCATATTAGC | 8.57 | – 2200, prom | Unknown | 4.9 ± 0.2g | EMSAf |
| Impact | NM_008378 | CCATTTATGG | 14.09 | 2443, coding | Unknown | 6.3 ± 1.3i | EMSAh |
| Lzf | NM_133185 | CCTTTTATGG | 14.19 | – 630, prom | Unknown | 4.4 ± 0.9g | EMSAf |
| Shkbp1 | NM_138676 | CCAAATATGG | 13.59 | – 1530, prom | Unknown | 2.6 ± 0.2e | EMSAf |
Log-likelihood ratio determined by TESS indicates relative similarity in base composition of novel CArGs to known CArGome (see text)
Position of CArG sequence indicated relative to annotated TSS in mouse genome
Luciferase validations represent fold increases over controls in: eRat 2 fibroblasts; gC2C12 myoblasts; or iP19 cells. See Methods for further details
SRF binding was assessed by EMSA for essentially all of the predicted CArG elements and by ChIP for a subset. EMSA validations reflect either the ability of the predicted CArG to compete with SRF binding to a radiolabeled CArG element (fEMSA) or direct binding of the radiolabeled CArG-containing sequence to in vitro translated SRF (hEMSA); see Figure 3, B and C, and Methods for further details. (ND) Not determined; (UB) undetectable binding by EMSA or ChIP. Bold italicized genes have conserved CArG sequences ascertained manually as described in Methods
Most of the novel CArG elements exhibit higher luciferase activity than two of the 10 previously characterized CArG-dependent genes we predicted (cf. Cnn1 and Actg2 with novel targets in Fig. 3A), suggesting strongly that the predicted novel CArG elements are authentic and function to direct expression of their respective SRF-dependent target gene. The position of these new CArG elements is evenly distributed between 5′-promoter (27) and intronic sequences (26) with the balance found in untranslated (five) and coding (two) exonic sequences (Table 2). Two of the SRF target genes validated (Dnajb1 and Impact) are noteworthy because they harbor functional CArG elements within coding exons (Fig. 3A; Table 2). Previous studies have defined positively acting cis-regulatory elements in coding sequences (Hyder et al. 1995; Lang et al. 2005); however, to our knowledge this is the first report of functional CArG elements within protein-coding sequence.
To further evaluate the functionality of predicted CArG elements, we used gel shift (EMSA) to assess the presence of nucleoprotein complexes immunoreactive for SRF or the ability of CArG-containing sequences to compete off SRF binding to a radiolabeled CArG box. Figure 3B (top) shows that SRF binds to the computer-predicted CArG elements in Pfn1, Itgb1bp2, Itga5, and Actr3 as indicated by a supershift of the nucleoprotein complex upon addition of antisera to SRF. Moreover, most predicted CArG elements compete for SRF binding to a radiolabeled CArG box in a cold-competitor EMSA assay (Fig. 3B, bottom). Table 2 summarizes the EMSA data for essentially all the targets showing positive luciferase activity. As a final measure of validation, we selected a few of the predicted CArG elements and show by ChIP assay direct in vivo binding of SRF to CArGs in their native genomic context (Fig. 3C). Overall, there is very good concordance between luciferase and EMSA/ChIP validations supporting each of the computer-predicted CArG boxes as authentic SRF-dependent regulatory elements (see Table 2).
RNAi knockdown of SRF and the actin cytoskeleton
A growing number of SRF target genes have functions related to contractile activity or cytoarchitecture (Schratt et al. 2002; Philippar et al. 2004; Alberti et al. 2005). Inspection of the target genes in Table 2 reveals 26 targets with established functions related to these processes. We therefore examined the effect of knocking down SRF on actin cytoskeletal integrity. Figure 4A illustrates the effectiveness of our shSRF adenovirus in knocking down endogenous SRF in rodent (top panel) and human (bottom panel) cells. Application of this shSRF construct to cultured rat vascular smooth muscle cells results in a predicted decrease in expression of Cnn1, a known SRF target gene (Miano et al. 2000). Several novel SRF targets encoding cytoskeletal-associated proteins are similarly validated with this assay including Actn1, Actr3, Dstn, Flna, and Flnc (Fig. 4B). In contrast, little change in expression of Tuba (non-SRF target) is observed with shSRF knockdown (Fig. 4B). Thus, while not a direct measure of each target gene's requirement for SRF binding and activation, the RT-PCR data are consistent with the luciferase and EMSA validations showing each of the cytoskeletal targets assayed to be authentic CArG-dependent genes. To study the effects of reduced SRF expression on actin cytoskeleton directly, we stained cells with phalloidin (binds filamentous actin) following transduction with shSRF adenovirus. Results show a profound alteration in cytoskeletal organization (Fig. 5, A vs. C) with SRF knockdown (Fig. 5, B vs. D) in both human (Fig. 5A-D) and rodent (Fig. 5E-J) cell types. Taken together, these results suggest that one function of SRF is to coordinate a normal actin cytoskeleton through the direct activation of numerous target genes associated with cytoskeletal homeostasis (see Discussion).
Figure 4.

shRNA knockdown of SRF and novel CArG-containing target genes. (A) shRNA knockdown of endogenous SRF in A7r5 rat vascular smooth muscle cells (upper panel) and human coronary artery smooth muscle cells (HCASMC, lower panel). Cells were transduced with adenovirus carrying either a short hairpin (sh) to EGFP or SRF and total cell lysates harvested at the indicated days post-transduction (dpt) for Western blotting of SRF protein levels. Note the virtual absence of detectable SRF 5 dpt in both cell types; (NC) negative control protein Tuba whose gene does not contain functional CArG boxes. (B) Linear RT-PCR results showing shSRF-mediated suppression of Cnn1, Actn1, Actr3, Dstn, Flna, and Flnc mRNA expression in A7r5 smooth muscle cells. shSRF has little effect on the negative control (NC) gene Tuba, a gene that is not SRF-dependent.
Figure 5.

The actin cytoskeleton is dependent on SRF. (A,B,C,D) Human umbilical vein endothelial cells virally transduced for 5 d with either (A,B) shEGFP or (C,D) shSRF and then stained with phalloidin for (A,C) actin cytoskeleton or (B,D) a fluorescently tagged antibody to SRF. Arrows indicate nuclear staining for SRF. (E,F) Phase contrast micrographs of rat A7r5 smooth muscle cells transduced with (E) shEGFP or (F) shSRF for 3 d. Note the loss of cell definition in shSRF-transduced cells. This change is readily apparent by this time and remained apparent as long as 7 d post-transduction (not shown); size bars, 20 μm. (G,H) Normal cytoskeleton in A7r5 cells transduced with shEGFP for 3 and 5 d, respectively. As with human endothelial cells above, shSRF results in an alteration in normal cytoarchitecture (I) 3 d and (J) 5 d post-transduction. Note the shorter filament length, altered filament orientation, and overall lower phalloidin staining intensity in Ad-shSRF cells as compared to controls. The microtubule network in both shSRF and shEGFP transduced cells was similar, indicating the effect of shSRF is specific to the actin cytoskeleton (data not shown). Size bars, 10 μm.
Overlap between known and novel CArG sequences
We generated Sequence Logos of known CArG elements and the novel gene set reported here to determine whether any significant deviations exist. We report similar sequences between data sets with the only exceptions being tolerable A-nucleotide substitutions at positions -3 and +3 and subtle base substitutions at the -4 C and terminal G nucleotides within the novel SRF gene set (Fig. 6). A log-likelihood score of similarity between known CArG sequences and each of the 60 novel SRF targets was generated with TESS (Schug 2003), and the values are listed in Table 2. A predicted high similarity score is observed for most of the 60 new CArG elements, although some (in Enah and Hoxc6) have lower scores because of unusual base substitutions across the CArG box. The log-likelihood data illustrate the complexity of the CArGome, emphasizing the high nucleotide degeneracy across SRF-binding sites.
Figure 6.
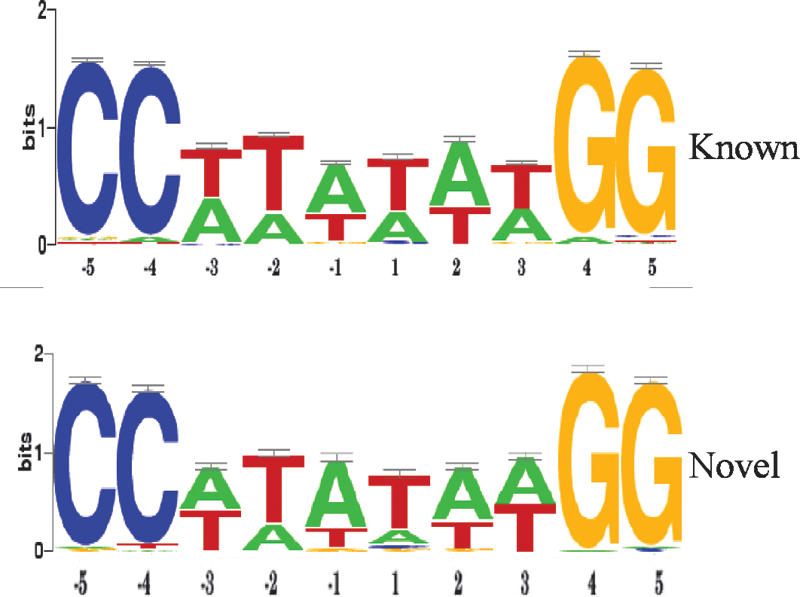
Sequence similarity of novel SRF targets with known CArGome. Sequence Logos of known and novel SRF-binding sequences show a high level of similarity in preferred base composition across the CArG element. Sequence Logos were generated from 92 known CArG sequences and compared to the 60 novel CArG sequences reported here (see Table 2).
Discussion
The results of this study further expand the mammalian CArGome, increasing by 55% the number of experimentally validated SRF target genes. This was accomplished by integrating several algorithms to interrogate the human-mouse genomes for CArG sequences that are conserved both in sequence and in space. The utility of this approach is highlighted by its good success in predicting conserved orthologous CArG sequences and in experimentally validating those sequences chosen for further study (both >60%). A large number of genes validated in our screen encode for proteins involved with cytoskeletal/contractile processes, and a direct role for SRF in cytoskeletal integrity is indicated by short-hairpin RNA knockdown of SRF in cultured cell lines. These data are consistent with an emerging model wherein SRF, whose function is under control of actin dynamics (Sotiropoulos et al. 1999), in turn activates genes directly involved in actin cytoskeletal homeostasis (Fig. 7; see below).
Figure 7.

Autoregulatory loop for SRF-dependent cytoskeletal target gene activation. The schematic models a positive feedback mechanism for SRF-mediated cytoskeletal gene expression wherein actin dynamics stimulate SRF activity, which, in turn, activates genes encoding the cytoskeletal apparatus. We propose this feedback loop is an ancient mechanism for SRF-dependent regulation of normal cytoskeletal homeostasis, which, in turn, is requisite for SRF activity.
The screen reported here was designed to capture CArG elements conserved in sequence and in space between human and mouse. However, owing to the incomplete number of orthologous pairs of genes with accurately mapped TSS from DBTSS at the start of this study in early 2004, only 10/62 previously validated SRF targets were detected. Our screen will likely detect additional known and novel SRF targets as the number of available high-confidence TSSs increases (in the DBTSS and other sources). For example, whereas 10/62 known SRF targets were identified at the outset of this study, we recently found a substantial increase in this ratio (32/62) when the screen was applied to the latest data from DBTSS. Because CArG-containing genes often contain multiple numbers of CArG boxes in close proximity to one another (Miano 2003), it may be informative to perform genome-wide screens for tandem CArG boxes residing close to annotated genes. One other limitation of our screen relates to the premise that all functional CArG elements are conserved across species. It is important to point out, however, that a regulatory element need not be conserved to be active in any given species. For example, the mouse Des gene contains several functional CArG sequences none of which are conserved in the human DES locus (Miano 2003). Moreover, we validated four mouse genes (Agpt1, Klf5, Hoxb7, and Rnf12) whose computer-predicted CArG sequences are not conserved in human (see Supplemental Table 2). Thus, the screen defined here for detecting functional CArG elements likely underestimates the total number of true positives in the mouse genome. Recently, Zhang et al. (2005) uncovered several SRF target genes with CArG sequences not conserved across species. The latter study also defined several SRF-binding sequences deviating >1 bp across the CArG element as well as CArG sequences positioned at great distances from the TSS (R.J. Schwartz, pers. comm.). Interestingly, similarly arranged sequences in yeast bind the SRF ortholog Mcm1, which mediates both gene transcription as well as DNA replication (Tye and Chang 2004). It will be fascinating to determine whether mammalian SRF bound to CArG mediates effects beyond transcription (e.g., DNA replication). In this context, we have observed one computer-predicted target (Capza3) to be unresponsive to SRFVP16 in the cells we used, yet its CArG sequence is bound by SRF in vivo (data not shown). This would suggest either the absence in such cells of SRF coregulators necessary for transcriptional activation of this gene or some novel function of SRF unrelated to transcription. Clearly, the development of novel assay systems for evaluating computer-predicted, non-coding sequences is crucial for disclosing fully the functionality of non-coding sequences in the genome.
A growing number of SRF target genes encode for proteins related to cytoarchitecture (Philippar et al. 2004). The actin cytoskeleton is known to regulate activity of SRF by changes in actin turnover, a process known as actin-treadmilling (Sotiropoulos et al. 1999). When levels of globular actin are depleted during the polymerization of filamentous actin, a critical coactivator of SRF called MAL1 translocates to the nucleus, where it associates with SRF and stimulates appropriate CArG-containing gene expression (Miralles et al. 2003). As we report here, many of the SRF targets include genes involved with the actin cytoskeleton. Interestingly, gene inactivation studies in amoeba, fly, and mouse indicate a critical role for SRF in cytoskeletal/contractile integrity (Guillemin et al. 1996; Schratt et al. 2002; Escalante et al. 2004; Miano et al. 2004; Alberti et al. 2005; Li et al. 2005; Niu et al. 2005). In the present report we have uncovered several novel SRF target genes involved with cytoskeletal homeostasis and show with RNAi knockdown of SRF a dramatic disruption in normal cytoskeletal structure across species. Thus, the activity of SRF, in part, relates to its ability to turn on genes associated with the actin cytoskeleton, the dynamics of which are known to directly regulate SRF activity (Sotiropoulos et al. 1999). This positive feedback loop therefore provides a finely tuned mechanism for maintaining both cytoskeletal homeostasis and the activity of a critical trans-acting factor (Fig. 7).
We have observed in a manual screen for CArG-containing genes, a preferential bias for CArG elements in actin cytoskeletal genes (targets with consensus CArG within 4 kb of TSS/total genes = 145/177, 82%) versus microtubule (52/114, 46%) and intermediate filament (31/69, 45%) genes. Thus, in addition to the cytoskeletal genes listed in Table 2, we have found conserved CArG elements in the following actin cytoskeletal genes: Anln, Arpc4, Flnb, Gsn, Pfn2, Tns, and Vasp. In a recent study, Gsn was demonstrated to be SRF-dependent in neuronal cells (Alberti et al. 2005). Given the high degree of SRF homology across animal, plant, and fungi kingdoms, as well as similar homology among its target genes, SRF likely serves an important and ancient function in normal actin cytoskeletal homeostasis. Support for this notion stems from gene inactivation studies (Schratt et al. 2002; Escalante et al. 2004; Miano et al. 2004; Alberti et al. 2005; Li et al. 2005) as well as the high degree of homology in CArG sequences across phyla. For example, Actg1 contains a proximal promoter CArG (CCATATATGG) that is 100% conserved in sequence and space between human and insects (Erba et al. 1988; Mangé et al. 1997). Whether similar high-evolutionary sequence conservation exists among other CArG-containing genes awaits further study. Such an analysis may provide insight into evolutionary relationships between SRF-dependent processes as well as the definition of an ancient CArG code.
The first gene shown to be SRF-dependent was the transcription factor Fos (Norman et al. 1988). Many of the SRF target genes reported here and in previous studies (Philippar et al. 2004; Zhang et al. 2005) encode for transcription factors indicating that SRF may control target gene expression indirectly. For example, the SRF coactivator Myocd (Wang et al. 2001) is reduced in the heart of mice lacking SRF, although no functional SRF-binding CArG sequences have yet been identified in and around the Myocd locus (Miano et al. 2004; Parlakian et al. 2004; Niu et al. 2005). Defining SRF-dependent transcription factors should therefore provide important insights into the regulation of Myocd expression as well as other genes with poorly characterized promoters. Such information will, in turn, be essential in the construction of accurate gene regulatory networks. Finally, the SRF-dependent transcription factors identified here and elsewhere provide new opportunities toward fully elucidating the expression control of both structural and/or regulatory actin cytoskeletal genes.
Gene transcription involves the cooperative interaction of several transcription factors to ensure proper levels and patterns of expression. In many cases, adjacent cis elements are bound by factors that interact directly with other DNA-binding transcription factors such as SRF (Reecy et al. 1999; Miano 2003). We therefore looked at flanking sequences of the 60 validated CArG elements for any trends in sequence conservation, but no obvious trends were evident. The lack of obvious trends may be due to heterogeneity of the roles or biological processes of genes regulated by SRF. As the number of genes identified within the CArGome increases, it may be possible to elucidate subsets of SRF target genes having signature sequences beyond the CArG box that confer specific responses and cell/tissue-restricted patterns of expression (Schug et al. 2005). Such an analysis should not be limited to proximal sequence similarities as transcription factors are known to coordinate long distance interactions.
SRF target genes have historically been classified as either immediate early, growth-related genes or muscle differentiation genes. The findings reported here and elsewhere (Philippar et al. 2004; Zhang et al. 2005) have expanded the CArGome considerably, providing a rich source of novel SRF target genes for further investigative study. For example, it will be important to evaluate the responsiveness of new SRF target genes to growth- or differentiation-inducing signals. In this context, Selvaraj and Prywes (2004) reported on several genes dependent on the Myocd family member Mkl1 in a microarray screen and found several validated SRF targets reported here (Enh, Adm, Tgfb1i1) to be Mkl1-dependent. It is also possible that SRF target genes may fall into a newly defined class of atypical CArG-dependent genes (Streb and Miano 2005).
In summary, we have used a computational method toward a definition of the functional mammalian CArGome. This approach has resulted in the disclosure of >100 putative SRF target genes, 60 of which we have functionally validated. Thus, as of this writing, 161 genes comprise the mammalian CArGome. The importance of defining the CArGome relates to the critical role of its binding factor SRF in life processes extending across kingdoms as well as SRF's interaction with a growing number of transcription factors that bind adjacent cis-regulatory elements. A major task that lies ahead will be to elucidate signature sequences encompassing CArG elements that can be classified functionally within a cell as well as defining the in vivo relevance of in vitro validated CArG elements in the context of transgenic mouse studies. In addition, a full characterization of the CArGome may reveal important non-coding polymorphisms linked to human disease.
Methods
Bioinformatics screen
The general strategy for performing the bioinformatics screen is summarized in Figure 1. Briefly, genomic positions of transcriptional start sites (TSS) were extracted from the Database of Transcription Start Sites (DBTSS, version 3). This database contained detailed information as to the genomic positions of the TSS (based on full-length cDNAs) and the adjacent promoters for 12,253 human (hg16) and 10,309 mouse (mm3) RefSeq transcripts. The genomic sequences around TSS (-4 kb/+4 kb) of each RefSeq transcript were retrieved from the UCSC DAS genomic sequence server. Using OrthoMCL, 4362 human-mouse orthologs were selected from the above 12,253 human (hg16) and 10,309 mouse (mm3) RefSeq transcripts. We used LAGAN to align the retrieved genomic sequences of each human-mouse ortholog pair and arbitrarily set the conservation threshold at 80% with a 50-bp scan window. Based on published data accumulated over the last 20 years on the composition of functional CArG sequences (Miano 2003), we used TESS to scan the conserved regions obtained from the above alignments. A total of 116 mouse RefSeq transcripts were reported as SRF-CArG-dependent gene candidates (10 of these were previously validated). We recently repeated this analysis with the September 2005 release of DBTSS using mm5 and hg17 RefSeq data (see Results). Manual ascertainment of conserved CArG sequences in several cytoskeletal and microtubule genes was done by downloading orthologous human and mouse sequences from the UCSC server and analyzing them with the FINDPATTERNS algorithm in the Genetics Computer Group Software Package (version 10.3). Using TESS (http://www.cbil.upenn.edu/tess), a log-likelihood score was assigned to each of the 60 validated CArG-box sequences. Specifically, the similarity between position weight matrix (PWM) and matching sequence can be defined as a scoring function for an alignment, which is a log-likelihood ratio as shown in the equation below.
 |
where Sj represents sequence j, M represents PWM, p represents the probability of observing a base, and g represents the background. The higher the score is, the better the alignment. This is the log of the increased (or decreased) probability of observing a base according to the weight matrix model as compared to the background model. Thus, the log-likelihood score (TESS-Score) reflects the similarity between each novel CArG box and the known CArGome (see Table 2). Based on known CArG-binding sites and the 60 novel ones reported here, two CArG Sequence Logos (Schneider and Stephens 1990) were generated by Weblogo (http://weblogo.berkeley.edu/). GO term annotation was by AmiGO, and a hypergeometric analysis of the data was performed to determine the statistical likelihood of enrichment for any GO category.
PCR cloning of CArG-containing target genes
Primers (containing BglII sites for cloning) were designed to flank non-coding CArG sequences in 87/106 computer-predicted and six manually defined targets (primer sequences available upon request). The remaining 19/106 computer-predicted targets all have CArG elements within coding exons (see Supplemental Table 2). Because no studies have yet reported on functional CArG sequences within coding exons, we arbitrarily selected two of the predicted targets within coding exons for further evaluation. Thus, we set out to PCR-clone a total of 89/106 computer-predicted and six manually defined SRF target genes for in vitro validation assays. PCR of mouse genomic DNA (C57BL/6 strain) resulted in correctly sized products for 84/89 computer-predicted and all six manually identified CArG sequences. PCR fragments (200-700 bp) were restrictiondigested, analyzed by agarose gel electrophoresis, gel-purified, and ligated into the BglII site of a thymidine kinase (tk) minimal promoter-driven luciferase reporter plasmid (Promega, Inc.). We used the tk minimal promoter instead of each target gene's promoter so as to avoid inherent differences in promoter strengths in the cell types used. Reporter plasmids were purified by ion exchange chromatography (Qiagen), and the inserts were verified by sequencing prior to transfection; all but one of the CArG-containing target sequences was correct. Thus, 83/89 computer-predicted targets (including two with potential functional CArGs within coding exons) and all six manually predicted sequences were subjected to further evaluation (see Fig. 1 and Table 1).
Cell culture
A7r5, C2C12, undifferentiated P19 embryonal carcinoma cells, and Rat 2 fibroblasts were maintained in Dulbecco's Modified Eagle's Medium (DMEM) containing high glucose, supplemented with 10% fetal bovine serum (FBS) and 200 μM L-glutamine on 100-mm plates. Human coronary artery smooth muscle cells were kept in medium 231 (Cascade Biologics) supplemented with the component SMGS. Human umbilical vein endothelial cells were grown in medium 200 (Cascade Biologics) supplemented with the component LGGS. Antibiotics and antimycotics were not included in the medium.
Transient transfection assays
Because putative SRF target sequences were derived from mouse genomic DNA, we chose to evaluate reporter gene activity in several well-established rodent cell lines that are easily transfected in a high-throughput manner. Thus, C2C12, Rat 2 fibroblasts, and P19 embryonal carcinoma cells were dispersed in either 96- or 24-well plates, allowed to adhere overnight, and grown to ∼70% confluence before cotransfecting each of the CArG-containing genomic sequences linked to tk-luciferase (100 ng/well) with 100 ng/well of either empty expression vector or SRFVP16 transactivator (Miano et al. 2000). To correct for varying transfection efficiencies, we also introduced 30 ng/well of a Renilla reporter gene (Promega) as an internal control. Transfections were done by calcium phosphate coprecipitation (Graham and Van der Eb 1973) for 15-20 h before adding fresh medium for an additional 24 h, after which cell lysates were prepared for a Dual Luciferase Assay as described by the manufacturer (Promega). All transfections were performed in quadruplicate and repeated at least twice in each cell line. In all, >2500 transfections were carried out. Importantly, we also performed cotransfections with SRFVP16 and a series of negative control sequences (without CArG elements, including pGL3 Basic Promoter containing only the tk promoter) in each of the cell lines to establish a threshold above which we scored targets as true positives. The negative control sequences were cloned into the same minimal tk-luciferase reporter as our target CArG sequences. We set as our threshold the normalized luciferase value that was two standard deviations above the mean for each of the three cell lines. This threshold averaged 2.2-fold above empty vector control across cell lines. Data in Figure 3A and Table 2 are expressed as the normalized fold increase over controls (±standard deviation) in which the empty expression plasmid was substituted for SRFVP16. Data were analyzed with GraphPad Prism Software (Version 4.0, GraphPad Software Inc.).
DNA-binding assays
Electromobility shift assays (EMSA) were performed as described previously (Miano et al. 2000). Briefly, in vitro translated SRF was incubated with 50,000 cpm of 32P-labeled probe (from selected SRF target genes) (see Table 2) and poly(dI-dC) in binding buffer. Nucleoprotein complexes were fractionated on 4% native polyacrylamide gels, dried, and exposed to Kodak X-AR film at -70°C. Competition and supershift assays were performed by the addition of 100-fold molar excess non-radioactive double-stranded probe and by the addition of 200 ng of rabbit anti-SRF antibody (Santa Cruz, sc-335), respectively. For cold competition EMSA assays, a CArG sequence was labeled and then incubated with in vitro translated SRF in the absence or presence of an excess of each CArG-containing target sequence. ChIP assays were performed with EZ ChIP in BC3H1 cells as specified by the manufacturer (Upstate Cell Signaling Solutions) using the same SRF antibody as in EMSA.
Western immunoblots
Western blotting was performed on lysates from indicated cell lines as described previously (Streb et al. 2004) with 1:1200 rabbit anti-SRF antibody (Santa Cruz, sc-335) or mouse anti-α-tubulin (Sigma) as an internal loading control.
RNAi knockdown of SRF
Endogenous SRF expression was knocked down in cells using a short hairpin RNA as described recently (Streb and Miano 2005). For adenoviral transductions, cells were seeded and allowed to adhere overnight. shSRF was used to transduce cells with a viral load of 100 infectious particles per cell; sh-EGFP was used as a control knockdown virus. Cells were washed and refed new media every other day until harvesting at the indicated times.
RNA isolation and semiquantitative reverse transcription-PCR
Total RNA from cultured A7r5 rat vascular smooth muscle cells was isolated using TRIzol (Invitrogen) as per the manufacturer's directions and quantitated using a spectrophotometer. For cDNA synthesis, 1 μg of total RNA from each condition was reverse-transcribed using the Transcriptor reverse transcription kit as per the manufacturer's instructions (Roche Applied Science). Linear PCR was then performed using the cDNA as template and corresponding primer pairs for Cnn1, Actn1, Actr3, Dstn, Flna, Flnc, and Tuba. Putative SRF targets were selected from Table 2 based on their established roles in maintaining actin cytoskeletal homeostasis. The PCR conditions were as follows: 94°C for 2 min and then 19-26 cycles (dependent on primer pair and relative abundance of transcript) at 94°C for 30 sec, 55°C for 30 sec, and 72°C for 1 min. PCR products were electrophoresed on a 1.5% agarose gel and visualized by ethidium bromide staining.
Immunocytochemistry
Cells were washed twice with PBS (pH at 7.4), then fixed in freshly prepared 4% paraformaldehyde for 10 min. After being rinsed three times with PBST, cells were permeabilized with 0.1% Triton-100 for 5 min. A 1:1200 dilution of rabbit anti-SRF (Santa Cruz) in PBST was used to verify reduced SRF staining upon knockdown. The actin cytoskeleton was stained with 1:500 dilution of TexasRed-Phalloidin (Molecular Probes) for 20 min in the dark. Nuclear profiles were revealed with a brief incubation in DAPI prior to coverslipping. Staining was observed with an inverted Olympus IX70 fluorescence microscope and photographed for direct importation into Adobe Photoshop.
Acknowledgments
We thank the URMC Functional Genomics Center and the New York State-funded AMDeC MRC for performing the sequencing of CArG-containing targets. This work was supported by National Institutes of Health grant HL62572 to J.M.M. G.C. and C.J.S. were supported in part by U01-DK56947 and R01DK63336. The authors thank Robert J. Schwartz for communicating results prior to publication and Bradford C. Berk for the generous gift of human umbilical vein endothelial cells.
Article published online ahead of print. Article and publication date are at http://www.genome.org/cgi/doi/10.1101/gr.4108706.
Footnotes
[Supplemental material is available online at www.genome.org.]
References
- Alberti, S., Krause, S.M., Kretz, O., Philippar, U., Lemberger, T., Casanova, E., Wiebel, F.F., Schwarz, H., Frotscher, M., Schutz, G., et al. 2005. Neuronal migration in the murine rostral migratory stream requires serum response factor. Proc. Natl. Acad. Sci. 102 6148-6153. [DOI] [PMC free article] [PubMed] [Google Scholar]
- Arsenian, S., Weinhold, B., Oelgeschlager, M., Ruther, U., and Nordheim, A. 1998. Serum response factor is essential for mesoderm formation during mouse embryogenesis. EMBO J. 17 6289-6299. [DOI] [PMC free article] [PubMed] [Google Scholar]
- Ashburner, M., Ball, C.A., Blake, J.A., Botstein, D., Butler, H., Cherry, J.M., Davis, A.P., Dolinski, K., Dwight, S.S., Eppig, J.T., et al. 2000. Gene ontology: Tool for the unification of biology. Nat. Genet. 25 25-29. [DOI] [PMC free article] [PubMed] [Google Scholar]
- Blais, A., Tsikitis, M., Acosta-Alvear, D., Sharan, R., Kluger, Y., and Dynlacht, B.D. 2005. An initial blueprint for myogenic differentiation. Genes & Dev. 19 553-569. [DOI] [PMC free article] [PubMed] [Google Scholar]
- Boffelli, D., McAuliffe, J., Ovcharenko, D., Lewis, K.D., Ovcharenko, I., Pachter, L., and Rubin, E.M. 2003. Phylogenetic shadowing of primate sequences to find functional regions of the human genome. Science 299 1391-1394. [DOI] [PubMed] [Google Scholar]
- Conkright, M.D., Guzmán, E., Flechner, L., Su, A.I., Hogenesch, J.B., and Montminy, M. 2003. Genome-wide analysis of CREB target genes reveals a core promoter requirement for cAMP responsiveness. Mol. Cell 11 1101-1108. [DOI] [PubMed] [Google Scholar]
- Crawford, G.E., Holt, I.E., Mullikin, J.C., Tai, D., Blakesley, R., Bouffard, G., Young, A., Masiello, C., Green, E.D., Wolfsberg, T.G., et al. 2004. Identifying gene regulatory elements by genome-wide recovery of DNase hypersensitive sites. Proc. Natl. Acad. Sci. 101 992-997. [DOI] [PMC free article] [PubMed] [Google Scholar]
- Dieterich, C., Grossmann, S., Tanzer, A., Ropcke, S., Arndt, P.F., Stadler, P.F., and Vingron, M. 2005. Comparative promoter region analysis powered by CORG. BMC Genomics 6 24. [DOI] [PMC free article] [PubMed] [Google Scholar]
- Elble, R. and Tye, B.-K. 1991. Both activation and repression of a-mating-type-specific genes in yeast require transcription factor Mcm1. Proc. Natl. Acad. Sci. 88 10966-10970. [DOI] [PMC free article] [PubMed] [Google Scholar]
- Erba, H.P., Eddy, R., Shows, T., Kedes, L., and Gunning, P. 1988. Structure, chromosomal location, and expression of the human g-actin gene: Differential evolution, location, and expression of the cytoskeletal b- and g-actin genes. Mol. Cell. Biol. 8 1775-1789. [DOI] [PMC free article] [PubMed] [Google Scholar]
- Escalante, R. and Sastre, L. 1998. A serum response factor homolog is required for spore differentiation in Dictyostelium. Development 125 3801-3808. [DOI] [PubMed] [Google Scholar]
- Escalante, R., Yamada, Y., Cotter, D., Sastre, L., and Sameshima, M. 2004. The MADS-box transcription factor SrfA is required for actin cytoskeleton organization and spore coat stability during Dictyostelium sporulation. Mech. Dev. 121 51-56. [DOI] [PubMed] [Google Scholar]
- Fraser, A.G., Kamath, R.S., Zipperlen, P., Martinez-Campos, M., Sohrmann, M., and Ahringer, J. 2000. Functional genomic analysis of C. elegans chromosome I by systematic RNA interference. Nature 408 325-330. [DOI] [PubMed] [Google Scholar]
- Graham, F.L. and Van der Eb, A.J. 1973. A new technique for the assay of infectivity of human adenovirus 5 DNA. Virology 52 456-467. [DOI] [PubMed] [Google Scholar]
- Guillemin, K., Groppe, J., Dücker, K., Treisman, R., Hafen, E., Affolter, M., and Krasnow, M.A. 1996. The pruned gene encodes the Drosophila serum response factor and regulates cytoplasmic outgrowth during terminal branching of the tracheal system. Development 122 1353-1362. [DOI] [PubMed] [Google Scholar]
- Hardison, R., Oeltjen, J., and Miller, W. 1997. Long human-mouse sequence alignments reveal novel regulatory elements: A reason to sequence the mouse genome. Genome Res. 7 959-966. [DOI] [PubMed] [Google Scholar]
- Horak, C.E., Mahajan, M.C., Luscombe, N.M., Gerstein, M., Weissman, S.M., and Snyder, M. 2002. GATA-1 binding sites mapped in the β-globin locus by using mammalian chIp-chip analysis. Proc. Natl. Acad. Sci. 99 2924-2929. [DOI] [PMC free article] [PubMed] [Google Scholar]
- Hyder, S.M., Nawaz, Z., Chiappetta, C., Yokoyama, K., and Stancel, G.M. 1995. The protooncogene c-jun contains an unusual estrogen-inducible enhancer within the coding sequence. J. Biol. Chem. 270 8506-8513. [DOI] [PubMed] [Google Scholar]
- Impey, S., McCorkle, S.R., Cha-Molstad, H., Dwyer, J.M., Yochum, G.S., Boss, J.M., McWeeney, S., Dunn, J.J., Mandel, G., and Goodman, R.H. 2004. Defining the CREB regulon: A genome-wide analysis of transcription factor regulatory regions. Cell 119 1041-1054. [DOI] [PubMed] [Google Scholar]
- Johansen, F.E. and Prywes, R. 1995. Serum response factor: Transcriptional regulation of genes induced by growth factors and differentiation. Biochim. Biophys. Acta 1242 1-10. [DOI] [PubMed] [Google Scholar]
- Kleinjan, D.A. and van Heyningen, V. 2005. Long-range control of gene expression: Emerging mechanisms and disruption in disease. Am. J. Hum. Genet. 76 8-32. [DOI] [PMC free article] [PubMed] [Google Scholar]
- Lang, G., Gombert, W.M., and Gould, H.J. 2005. A transcriptional regulatory element in the coding sequence of the human Bcl-2 gene. Immunology 114 25-36. [DOI] [PMC free article] [PubMed] [Google Scholar]
- Lee, T.I., Rinaldi, N.J., Robert, F., Odom, D.T., Bar-Joseph, Z., Gerber, G.K., Hannett, N.M., Harbison, C.T., Thompson, C.M., Simon, I., et al. 2002. Transcriptional regulatory networks in Saccharomyces cerevisiae. Science 298 799-804. [DOI] [PubMed] [Google Scholar]
- Leung, S. and Miyamoto, N.G. 1989. Point mutational analysis of the human c-fos serum response factor binding site. Nucleic Acids Res. 14 1177-1195. [DOI] [PMC free article] [PubMed] [Google Scholar]
- Li, S., Czubryt, M.P., McAnally, J., Bassel-Duby, R., Richardson, J.A., Wiebel, F.F., Nordheim, A., and Olson, E.N. 2005. Requirement for serum response factor for skeletal muscle growth and maturation revealed by tissue-specific gene deletion in mice. Proc. Natl. Acad. Sci. 102 1082-1087. [DOI] [PMC free article] [PubMed] [Google Scholar]
- Liu, Y., Liu, X.S., Wei, L., Altman, R.B., and Batzoglou, S. 2004. Eukaryotic regulatory element conservation analysis and identification using comparative genomics. Genome Res. 14 451-458. [DOI] [PMC free article] [PubMed] [Google Scholar]
- Loots, G.G., Ovcharenko, I., Pachter, L., Dubchak, I., and Rubin, E.M. 2002. rVISTA for comparative sequence-based discovery of functional transcription factor binding sites. Genome Res. 12 832-839. [DOI] [PMC free article] [PubMed] [Google Scholar]
- Mangé, A., Julien, E., Prudhomme, J.C., and Couble, P. 1997. A strong inhibitory element down-regulates SRE-stimulated transcription of the A3 cytoplasmic actin gene of Bombyx mori. J. Mol. Biol. 265 266-274. [DOI] [PubMed] [Google Scholar]
- Miano, J.M. 2003. Serum response factor: Toggling between disparate programs of gene expression. J. Mol. Cell. Cardiol. 35 577-593. [DOI] [PubMed] [Google Scholar]
- Miano, J.M., Carlson, M.J., Spencer, J.A., and Misra, R.P. 2000. Serum response factor-dependent regulation of the smooth muscle calponin gene. J. Biol. Chem. 275 9814-9822. [DOI] [PubMed] [Google Scholar]
- Miano, J.M., Ramanan, N., Georger, M.A., de Mesy-Bentley, K.L., Emerson, R.L., Balza Jr., R.O., Xiao, Q., Weiler, H., Ginty, D.D., and Misra, R.P. 2004. Restricted inactivation of serum response factor to the cardiovascular system. Proc. Natl. Acad. Sci. 101 17132-17137. [DOI] [PMC free article] [PubMed] [Google Scholar]
- Miralles, F., Posern, G., Zaromytidou, A.-I., and Treisman, R. 2003. Actin dynamics control SRF activity by regulation of its coactivator MAL. Cell 113 329-342. [DOI] [PubMed] [Google Scholar]
- Montminy, M. 1997. Transcriptional regulation by cyclic AMP. Annu. Rev. Biochem. 66 807-822. [DOI] [PubMed] [Google Scholar]
- Niu, Z., Yu, W., Zhang, S.X., Barron, M., Belaguil, N.S., Schneider, M.D., Parmacek, M.S., Nordheim, A., and Schwartz, R.J. 2005. Conditional mutagenesis of the murine serum response factor gene blocks cardiogenesis and the transcription of downstream target genes. J. Biol. Chem. 280 32531-32538. [DOI] [PubMed] [Google Scholar]
- Nobrega, M.A. and Pennacchio, L.A. 2003. Comparative genomic analysis as a tool for biological discovery. J. Physiol. 554 31-39. [DOI] [PMC free article] [PubMed] [Google Scholar]
- Norman, C., Runswick, M., Pollock, R., and Treisman, R. 1988. Isolation and properties of cDNA clones encoding SRF, a transcription factor that binds to the c-fos serum response element. Cell 55 989-1003. [DOI] [PubMed] [Google Scholar]
- Ovcharenko, I., Loots, G.G., Hardison, R.C., Miller, W., and Stubbs, L. 2004. zPicture: Dynamic alignment and visualization tool for analyzing conservation profiles. Genome Res. 14 472-477. [DOI] [PMC free article] [PubMed] [Google Scholar]
- Parlakian, A., Tuil, D., Hamard, G., Tavernier, G., Hentzen, D., Concordet, J.-P., Paulin, D., Li, Z., and Daegelen, D. 2004. Targeted inactivation of serum response factor in the developing heart results in myocardial defects and embryonic lethality. Mol. Cell. Biol. 24 5281-5289. [DOI] [PMC free article] [PubMed] [Google Scholar]
- Pellegrini, L., Tan, S., and Richmond, T.J. 1995. Structure of serum response factor core bound to DNA. Nature 376 490-498. [DOI] [PubMed] [Google Scholar]
- Pennacchio, L.A. and Rubin, E.M. 2003. Comparative genomic tools and databases: Providing insights into the human genome. J. Clin. Invest. 111 1099-1106. [DOI] [PMC free article] [PubMed] [Google Scholar]
- Philippar, U., Schratt, G., Dieterich, C., Müller, J.M., Galgóczy, P., Engel, F.B., Keating, M.T., Gertler, F., Schüle, R., Vingron, M., et al. 2004. The SRF target gene Fhl2 antagonizes RhoA/MAL-dependent activation of SRF. Mol. Cell 16 867-880. [DOI] [PubMed] [Google Scholar]
- Reecy, J.M., Belaguli, N.S., and Schwartz, R.J. 1999. Serum response factor-NK homeodomain factor interactions, role in cardiac development. In Heart development (eds. R.P. Harvey and N. Rosenthal), pp. 273-290. Academic Press, New York.
- Sabo, P.J., Humbert, R., Hawrylycz, M., Wallace, J.C., Dorschner, M.O., McArthur, M., and Stamatoyannopoulos, J.A. 2004. Genome-wide identification of DNaseI hypersensitive sites using active chromatin sequence libraries. Proc. Natl. Acad. Sci. 101 4537-4542. [DOI] [PMC free article] [PubMed] [Google Scholar]
- Schneider, T.D. and Stephens, R.M. 1990. Sequence logos: A new way to display consensus sequences. Nucleic Acids Res. 18 6097-6100. [DOI] [PMC free article] [PubMed] [Google Scholar]
- Schneider, M.D., McLellan, W.R., Black, F.M., and Parker, T.G. 1992. Growth factors, growth factor response elements, and the cardiac phenotype. Basic Res. Cardiol. 87 33-48. [DOI] [PubMed] [Google Scholar]
- Schratt, G., Philippar, U., Berger, J., Schwarz, H., Heidenreich, O., and Nordheim, A. 2002. Serum response factor is crucial for actin cytoskeletal organization and focal adhesion assembly in embryonic stem cells. J. Cell Biol. 156 737-750. [DOI] [PMC free article] [PubMed] [Google Scholar]
- Schug, J. 2003. Using TESS to predict transcription factor binding sites in DNA sequence. In Current protocols in bioinformatics (eds. A.D. Baxevanis et al.), 2.6.1-2.6.15. John Wiley, New York. [DOI] [PubMed]
- Schug, J., Schuller, W.P., Kappen, C., Salbaum, J.M., Bucan, M., and Stoeckert Jr., C.J. 2005. Promoter features related to tissue specificity as measured by Shannon entropy. Genome Biol. 6 R33. [DOI] [PMC free article] [PubMed] [Google Scholar]
- Selvaraj, A. and Prywes, R. 2004. Expression profiling of serum inducible genes identifies a subset of SRF target genes that are MKL dependent. BMC Mol. Biol. 5 13. [DOI] [PMC free article] [PubMed] [Google Scholar]
- Sotiropoulos, A., Gineitis, D., Copeland, J., and Treisman, R. 1999. Signal-regulated activation of serum response factor is mediated by changes in actin dynamics. Cell 98 159-169. [DOI] [PubMed] [Google Scholar]
- Streb, J.W. and Miano, J.M. 2005. AKAP12a: An atypical serum response factor-dependent target gene. J. Biol. Chem. 280 4125-4134. [DOI] [PubMed] [Google Scholar]
- Streb, J.W., Kitchen, C.M., Gelman, I.H., and Miano, J.M. 2004. Multiple promoters direct expression of three AKAP12 isoforms with distinct tissue and subcellular distribution profiles. J. Biol. Chem. 279 56014-56023. [DOI] [PubMed] [Google Scholar]
- Thomas, J.W., Touchman, J.W., Blakesley, R.W., Bouffard, G.G., Beckstrom-Sternberg, S.M., Margulies, E.H., Blanchette, M., Siepel, A.C., Thomas, P.J., McDowell, J.C., et al. 2003. Comparative analyses of multi-species sequences from targeted genomic regions. Nature 424 788-793. [DOI] [PubMed] [Google Scholar]
- Thompson, W., Palumbo, M.J., Wasserman, W.W., Liu, J., and Lawrence, C.E. 2004. Decoding human regulatory circuits. Genome Res. 14 1967-1974. [DOI] [PMC free article] [PubMed] [Google Scholar]
- Tinti, C., Yang, C., Seo, H., Conti, B., Kim, C., Joh, T.H., and Kim, K.-S. 1997. Structure/function relationship of the cAMP response element in tyrosine hydroxylase gene transcription. J. Biol. Chem. 272 19158-19164. [DOI] [PubMed] [Google Scholar]
- Treisman, R., Alberts, A.S., and Sahai, E. 1998. Regulation of SRF activity by Rho family GTPases. Cold Spring Harb. Symp. Quant. Biol. 63 643-651. [DOI] [PubMed] [Google Scholar]
- Tullai, J.W., Schaffer, M.E., Mullenbrock, S., Kasif, S., and Cooper, G.M. 2004. Identification of transcription factor binding sites upstream of human genes regulated by the phosphatidylinositol 3-kinase and MEK/ERK signaling pathways. J. Biol. Chem. 279 20167-20177. [DOI] [PubMed] [Google Scholar]
- Tye, B.-K. and Chang, V.K. 2004. Dual functional regulators coordinate DNA replication and gene expression in proliferating cells. Front. Biosci. 9 2548-2555. [DOI] [PubMed] [Google Scholar]
- Venkatesh, B., Si-Hoe, S.L., Murphy, D., and Brenner, S. 1997. Transgenic rats reveal functional conservation of regulatory controls between the Fugu isotocin and rat oxytocin genes. Proc. Natl. Acad. Sci. 94 12462-12466. [DOI] [PMC free article] [PubMed] [Google Scholar]
- Wang, D.-Z., Chang, P.S., Wang, Z., Sutherland, L., Richardson, J.A., Small, E., Krieg, P.A., and Olson, E.N. 2001. Activation of cardiac gene expression by myocardin, a transcriptional cofactor for serum response factor. Cell 105 851-862. [DOI] [PubMed] [Google Scholar]
- Wasserman, W.W., Palumbo, M., Thompson, W., Fickett, J.W., and Lawrence, C.E. 2000. Human-mouse genome comparisons to locate regulatory sites. Nat. Genet. 26 225-228. [DOI] [PubMed] [Google Scholar]
- Xie, X., Lu, J., Kulbokas, E.J., Golub, T.R., Mootha, V., Lindblad-Toh, K., Lander, E.S., and Kellis, M. 2005. Systematic discovery of regulatory motifs in human promoters and 3′ UTRs by comparison of several mammals. Nature 434 338-345. [DOI] [PMC free article] [PubMed] [Google Scholar]
- Zhang, S.X., Gras, E.G., Wycuff, D.R., Marriot, S.J., Kadeer, N., Yu, W., Olson, E.N., Garry, D.J., Parmacek, M.S., and Schwartz, R.J. 2005. Identification of direct serum response factor gene targets during DMSO induced P19 cardiac cell differentiation. J. Biol. Chem. 280 19115-19126. [DOI] [PubMed] [Google Scholar]