

Abstract
We conduct an extensive simulation study to compare the merits of several methods for using null (unlinked) markers to protect against false positives due to cryptic substructure in population-based genetic association studies. The more sophisticated “structured association” methods perform well but are computationally demanding and rely on estimating the correct number of subpopulations. The simple and fast “genomic control” approach can lose power in certain scenarios. We find that procedures based on logistic regression that are flexible, computationally fast, and easy to implement also provide good protection against the effects of cryptic substructure, even though they do not explicitly model the population structure.
Population-based association studies provide an attractive approach to the identification of susceptibility genes underlying complex genetic traits. However, the recent track record of such studies has been mixed: Many reported associations have not been replicated, and the number of confirmed, positive associations to date is less than might have been expected a few years ago. Some of the nonreplicated reported associations might be due to population structure. If a higher proportion of cases than controls is sampled from a particular subpopulation, for example, because of biased ascertainment or higher prevalence of the disease in that subpopulation, then association can potentially be detected between case-control status and any markers having unusual allele frequencies in that subpopulation. Many such associations will be spurious: not due to any causal relationship between phenotype and genomic variants in the vicinity of the marker. If the population structure is recognized, it can be accounted for either at the design or the analysis stage of a study. Thus, the most important potential threat from population structure arises when the structure is unknown, so-called cryptic substructure.
Freedman et al. (2004) observed that even well-designed studies can incorporate modest levels of cryptic substructure, enough to generate a substantial risk of false positives. Similarly Helgason et al. (2005) detected population structure within Iceland, which would normally be regarded as genetically homogeneous for the purposes of study design. Differentiation among the Icelandic regions is modest, with FST estimates well below 1%, and is most pronounced in older individuals, but it is sufficient to generate a noticeable inflation of the type 1 error rate for genetic association studies. Recently Campbell et al. (2005) reported an SNP associated with height in European Americans, but they argued that the association was due to population substructure.
Since the mid-1990s, many researchers have protected themselves against spurious associations due to cryptic substructure by implementing family-based designs (Thomson 1995) that eliminate the problem, for example, by matching spouses. Family-based studies remain widely used, and are being further developed (Van Steen et al. 2005). However, family-based designs typically imply higher genotyping costs and can face difficulty in recruiting enough suitable families. The use of family-based designs solely to avoid cryptic substructure has been criticized as not cost-effective (Cardon and Palmer 2003), in large part because there are statistical procedures for dealing with the problem of cryptic substructure that seem to have good properties. These statistical procedures require the genotypes of cases and controls at several “null” markers that are not in linkage disequilibrium with the gene being tested for association. The null markers are, in effect, used to infer aspects of the underlying population structure. Although typing these markers may imply additional genotyping costs, this is typically modest compared with the cost of implementing a family-based design. For a study involving many candidate genes, there may be little or no additional genotyping cost.
Perhaps the simplest established method for adjusting for the effects of cryptic substructure is Genomic Control (Devlin and Roeder 1999), which considers the distribution over the null markers of Y2, the Armitage test statistic that compares average allele counts in cases and controls. Since few, if any, of the null markers are expected to have a causal association with the disease phenotype, any inflation of the empirical Y2 values above their nominal  distribution may be attributed to demographic effects, such as cryptic substructure. Moreover, Devlin and Roeder (1999) argue that the deviation from
  can adequately be encapsulated in an over-dispersion factor, λ, which takes value 1 in the absence of population structure. Thus, by estimating λ from all the null markers and using Y2/λ at individual candidate markers in place of Y2, any inflation attributable to cryptic structure will be canceled, restoring approximately the nominal
  null distribution.
Structured association methods are more sophisticated than genomic control, and are computationally more demanding. These methods aim to allocate an individual's genome to one or more subpopulations, and to test for association conditional on this allocation. The most widely used structured association method seems to be that of Pritchard et al. (2000a), in which an association test STRAT is developed that works with the output of the STRUCTURE program (Pritchard and Rosenberg 1999; Pritchard et al. 2000b; Falush et al. 2003) for subpopulation allocation. Satten et al. (2001) adopted a latent class analysis approach within a maximum-likelihood framework, using the E-M algorithm. The association model of Zhu et al. (2002) is similar, but these authors infer the number of subpopulations via a mixture model. Hoggart et al. (2003) developed AdmixMap, combining Bayesian and classical methodology. Although these approaches differ, the underlying statistical models are similar: the beta-binomial likelihood is used for SNP allele counts in different subpopulations, and subpopulation allocation is made in such a way that deviations from Hardy-Weinberg and linkage equilibria are minimized in the inferred cryptic subpopulations.
None of the structured association analyses is straightforward to implement, the most important difficulty being the selection of the number of subpopulations. This must be chosen in each method, yet is difficult to estimate from the data. Since the notion of subpopulation is a theoretical construct that only imperfectly reflects reality, it is clear that the problem of estimating the number of subpopulations will never satisfactorily be resolved and it is preferable, if feasible, to implement a method that does not rely on the number of subpopulations being correctly assessed.
Despite concerns being raised over many years about the effects of cryptic substructure, there does not yet seem to be any extensive overview assessing the methods available to protect association studies against its adverse effects. Some simulation studies have been published, and we briefly review the principle studies below. These have been limited in different respects, for example, most consider only genomic control (GC) and not other statistical methods for population association studies; some use only extreme levels of population differentiation that will rarely arise in practice, or small sample sizes or a small number of genetic markers. Most studies do not compare performance with and without including the causal polymorphism among the markers typed. Some studies do not incorporate genealogical effects into their simulation, and hence the validity of their conclusions is severely compromised.
Bacanu et al. (2000) conducted a simulation study that considered FST values up to 3%, up to 80 null markers, and a broad range of disease models. They only considered the GC methodology for population association studies, and showed that it is more powerful than a familial study analyzed using the TDT, except in the presence of substantial stratification.
Marchini et al. (2004) examined populations consisting of three subpopulations, corresponding to continental human populations with overall FST around 15%, and also with two subpopulations corresponding to within-continent groups with FST around 1.3%. They conclude that even for their more realistic within-continent scenario, false positives can be problematic for large sample sizes and penetrances varying across subpopulations. They only examined the performance of GC, and reported that it can be anticonservative if only 50 to 100 null SNPs are used to estimate λ, but that it can become conservative when 500 to 2000 SNPs are used.
Hao et al. (2004) carried out a study to assess GC using samples of 20 Asians and 42 African Americans, and two Caucasian samples of sizes 42 and 54. These authors found that GC maintains approximately the correct type 1 error rate even under biased ascertainment, but they did not investigate the power of GC to detect true associations.
Köhler and Bickeböller (2005) developed a modification of structured association in which phenotype information is used to help identify subpopulation structure. They conducted a simulation study that is perhaps the most extensive to date prior to the present study, comparing their new method with GC and adapted structured association methods that uses the EM algorithm to perform the clustering, which is faster than STRUCTURE's Bayesian algorithm. Their study examined FST values up to 4%, sample sizes from 500 to 8000, and from 25 to 400 null markers. The authors concluded that, for simple population structures, structured association methods are superior to GC, although they are dependant on the correct inference of the underlying population substructure.
Thus, although some results are available, there is clearly much more to be done to investigate the relative merits of the different statistical analyses in scenarios that reflect real, well-designed studies and actual populations. For example, the degree of structuring that is sufficiently problematic to require a prophylactic statistical method has not been adequately characterized, nor has the potential loss of power from implementing such a method when it is in fact not needed. Finally, the use of logistic regression to account for cryptic substructure has not yet been extensively investigated. Recently, Wang et al. (2005) investigated the use of a single well-chosen null marker to adjust for population stratification within a logistic-regression framework. They did not compare this approach with other methods, and did not use any population genetics' model in their simulations. They argue that the inclusion of a well-selected null marker in a logistic regression model will correct for the effects of population structure within a well-designed candidate gene study, for which important environmental and genetic risk confounders have been considered.
We present here the most extensive simulation study to date of statistical methods to allow for the effects of population stratification. Our study is unique in several respects: It assesses multiple statistical methods (five that are designed to allow for population stratification, and for comparison one that is not) and different levels of between-population variation (FST) and relative population sizes. We distinguish the situation in which the causal variant itself is included among the markers typed in the study from that in which only noncausal markers tightly linked with the causal variant are included, and we separately test the methods under a scenario of no causal association. Further, we also consider a “biased” ascertainment scenario, as well as variation in the numbers of cases and controls and the disease model, and the number of markers used to adjust for population stratification.
Results
For each of five demographic scenarios, we simulated 50 sets of 500 cases and 500 controls genotyped at 110 SNPs in 51 genes: 10 SNPs in gene 1 (causal), and two SNPs in each of the remaining 50 genes (null). In our simulation the 51 genes are unlinked, but this corresponds in practice to genes that are widely spaced, so that any linkage disequilibrium due to linkage is negligible. Case/control status was assigned according to genotype at a randomly chosen SNP in gene 1, with genotype relative risks 1:2:4 (see Methods for details).
The demographic scenarios vary according to relative population size and between-population variance in allele proportions, measured by FST (for definitions and a review, see Balding 2003). We only considered two underlying subpopulations as this is the worst-case scenario for cryptic structure. The five scenarios were: (1) no substructure; (2) two subpopulations of equal size with low FST; (3) same as (2) but with high FST; (4) two subpopulations with sizes in the ratio 4:1 and low FST; and (5) same as (4) but with high FST. Average estimates of FST over the 50 data sets for each demographic scenario are shown in Table 1: What we have called low FST is ∼3.5%, whereas our high FST values are close to 8.3%. Genome-wide average values of FST estimated from comparisons between European populations are often under 1%. There is typically more variation among African populations, and FST estimates of 2% or 3% are not uncommon. Estimates of FST can be 5% or higher for comparisons of small, isolated populations within a continent. Although world-wide comparisons can generate FST estimates of ∼15% (Cavalli-Sforza et al. 1996), these comparisons are unrealistic for well-designed association studies in humans, which are typically genetically homogeneous. Thus our low FST value is in fact high for most practical purposes, and our high value is very high, but useful here for comparison of the methods under demanding assumptions. Another measure of the effect of population structure at the causal SNP on case/control ascertainment is given in Table 1, which shows the average excess of cases over controls in one of the two subpopulations (there is an equal excess of controls in the other subpopulation). The expected excess under random allocation to subpopulations is 18 for Scenarios 2 and 3 and 14 for Scenarios 4 and 5.
Table 1.
Average properties (with standard errors) of the 50 data sets in the simulation study underlying Tables 2, 3, 4, 5, 6
| FST/struct | FST (%) | |#cont – #case| | λ |
|---|---|---|---|
| (1) No structure | — | — | 1.2 (0.03) |
| (2) Low/eq | 3.5 (0.1) | 24 (2) | 1.2 (0.04) |
| (3) High/eq | 8.3 (0.1) | 43 (4) | 1.9 (0.19) |
| (4) Low/un | 3.5 (0.1) | 19 (2) | 1.2 (0.05) |
| (5) High/un | 8.4 (0.1) | 20 (2) | 1.4 (0.06) |
The first column gives a short label for each of the five demographic scenarios described in the text. Columns 2–4 give the average maximum-likelihood estimate of FST; the average absolute difference between the numbers of cases and of controls drawn from one population; and the average estimate of the λ parameter of the genomic control method.
The 110 SNPs were individually tested for association with case/control status applying six different methods: (a) Armitage's trend test (CHISQ); (b) genomic control (GC); (c) stepwise logistic regression (SLR); (d) Bayesian logistic regression (BLR); (e) STRAT assuming K = 2, where K is the assumed number of underlying subpopulations (STR2); and (f) AdmixMap assuming K = 2 (AM2). Methods (a), (c), and (d) do not make any explicit adjustment for population stratification. The adjustment for method (b) is encapsulated in the value of λ, which is estimated from data via the median of the CHISQ statistics. Average estimates of λ under each demographic scenario are shown in Table 1.
Table 2 shows the total number of false positives over the 50 simulated studies for each of the five demographic scenarios. A false positive is a declaration of significance for an SNP in any of the 50 genes other than gene 1. For CHISQ, GC, STR2, and AM2, the nominal type 1 error rate was set to 2 × 10⁻⁴, corresponding to an expected total of one false positive for these methods in each row of Table 2. CHISQ displays few false positives except under our most extreme demographic scenario, (3), suggesting that in many realistic settings the effect of population structure on type 1 error may be small. GC, STR2, and AM2 all appear to be well calibrated, with five, three, and four false positives overall in Table 2, compared with an expectation of five each. The nominal type 1 error rate cannot be directly assigned for SLR and BLR, but the actual rate appears to be extremely low with just one false positive for SLR in the 250 data sets of the simulation study, and none for BLR.
Table 2.
The total number of false positives generated by each method over the 50 simulated data sets for each demographic scenario when all 10 SNPs from gene 1 are included
|
Total false positives
|
||||||
|---|---|---|---|---|---|---|
| FST/struct | CHISQ | GC | SLR | BLR | STR2 | AM2 |
| (1) No structure | 0 | 0 | 0 | 0 | 0 | 0 |
| (2) Low/eq | 3 | 2 | 0 | 0 | 1 | 2 |
| (3) High/eq | 45 | 3 | 0 | 0 | 1 | 1 |
| (4) Low/un | 0 | 0 | 0 | 0 | 0 | 0 |
| (5) High/un | 2 | 0 | 1 | 0 | 1 | 1 |
The empirical power for the simulation study (Table 3) is defined as the proportion of data sets for which at least one of the 10 SNPs in gene 1 is significantly associated with case/control status. With increasing FST, all methods showed at least a modest loss of power, and this appears to be more severe for demographic Scenarios 4 and 5, with unequal population sizes. The empirical power is similar across all methods, but CHISQ, SLR, and AM2 display equal or greater power than both GC and STR2 in each of the five scenarios, although none of the individual differences was statistically significant. STR2 shows the lowest power of all six methods in four of the five demographic scenarios, whereas CHISQ and AM2 both achieve the highest power in four scenarios, as does SLR in three scenarios.
Table 3.
The percentage of the 50 data sets under each demographic scenario for which at least one of the 10 markers in gene 1 is significantly associated with disease
|
Power (%)
|
||||||
|---|---|---|---|---|---|---|
| FST/struct | CHISQ | GC | SLR | BLR | STR2 | AM2 |
| (1) No structure | 98 | 96 | 96 | 98 | 96 | 100 |
| (2) Low/eq | 100 | 100 | 100 | 98 | 92 | 100 |
| (3) High/eq | 92 | 90 | 90 | 88 | 88 | 90 |
| (4) Low/un | 94 | 94 | 94 | 94 | 86 | 94 |
| (5) High/un | 90 | 84 | 90 | 84 | 88 | 90 |
| Average (SE) | 95 (1.5) | 93 (1.8) | 94 (1.7) | 92 (1.8) | 90 (2.1) | 95 (1.5) |
The final row gives the mean over the first five rows, and its standard error (SE).
All the data sets were then reanalyzed with the causal SNP removed, leaving nine SNPs in gene 1. Again, GC, STR2, and AM2 appear to be well calibrated, with totals of five, three, and five false positives, respectively, but the false-positive totals for SLR and BLR are both now slightly worse: seven and nine (Table 4). Power corresponds to detecting at least one of the nine SNPs in gene 1. CHISQ now displays the highest empirical power in every scenario, equaled in only one case by BLR (Table 5). Again, AM2 is consistently superior to both GC and STR2, but it is now consistently inferior to both SLR and BLR.
Table 4.
The total number of false positives generated by each method over the 50 simulated data sets for each demographic scenario when the causal SNP is excluded, leaving the nine noncausal SNPs in gene 1
|
Total false positives: Causal SNP excluded
|
||||||
|---|---|---|---|---|---|---|
| FST/struct | CHISQ | GC | SLR | BLR | STR2 | AM2 |
| (1) No structure | 0 | 0 | 0 | 0 | 0 | 0 |
| (2) Low/eq | 3 | 2 | 4 | 3 | 1 | 2 |
| (3) High/eq | 45 | 3 | 2 | 5 | 1 | 2 |
| (4) Low/un | 0 | 0 | 0 | 0 | 0 | 0 |
| (5) High/un | 2 | 0 | 1 | 1 | 1 | 1 |
Table 5.
The percentage of the 50 data sets under each demographic scenario for which, when the causal SNP is excluded, at least one of the nine other SNPs in gene 1 is significantly associated with disease
|
Power (%): Causal SNP excluded
|
||||||
|---|---|---|---|---|---|---|
| FST/struct | CHISQ | GC | SLR | BLR | STR2 | AM2 |
| (1) No structure | 86 | 82 | 84 | 84 | 62 | 84 |
| (2) Low/eq | 88 | 84 | 94 | 88 | 62 | 86 |
| (3) High/eq | 76 | 60 | 68 | 72 | 58 | 68 |
| (4) Low/un | 74 | 68 | 72 | 72 | 72 | 72 |
| (5) High/un | 70 | 60 | 68 | 66 | 66 | 66 |
| Average (SE) | 79 (2.8) | 71 (3.1) | 77 (2.9) | 76 (2.9) | 64 (3.4) | 75 (3.0) |
The final row gives the mean over the first five rows, and its standard error (SE).
In our next analysis, we removed the entire causal gene (gene 1) from each data set, generating a scenario in which there are no true causal associations. For this analysis every significant association is a type 1 error. GC, STR2, and AM2 have totals of six, six, and four false positives (Table 6), respectively, again close to the expectation of five, whereas SLR and BLR have 11 and four, respectively.
Table 6.
The total number of false positives generated by each method over the 50 simulated data sets for each demographic scenario when gene 1 is excluded from the analyses
|
Total false positives: Causal gene excluded
|
||||||
|---|---|---|---|---|---|---|
| FST/struct | CHISQ | GC | SLR | BLR | STR2 | AM2 |
| (1) No structure | 0 | 0 | 0 | 0 | 1 | 0 |
| (2) Low/eq | 3 | 2 | 2 | 3 | 1 | 2 |
| (3) High/eq | 45 | 4 | 8 | 0 | 4 | 1 |
| (4) Low/un | 0 | 0 | 0 | 0 | 0 | 0 |
| (5) High/un | 2 | 0 | 1 | 1 | 0 | 1 |
The results so far (Tables 2, 3, 4, 5, 6) do not indicate striking differences between the methods, although some trends are apparent. CHISQ tends to achieve the highest power, reflecting the fact that allowing for population structure does imply some cost in terms of power. Moreover, CHISQ produces few false positives except under Scenario 3. These observations invite the conclusion that, when any population stratification is expected to be weak, it may be best to adhere to the simple and familiar CHISQ test and ignore the effects of population structure. However, the power loss relative to CHISQ is small for SLR, BLR, and AM2, and still modest for GC; only STR2 suffers a substantial loss of power. In terms of type 1 error, GC, STR2, and AM2 all perform close to their nominal rates; SLR and BLR show fewer false positives when the causal SNP is included in the analysis, but more when the causal SNP is absent.
So far subpopulation bias in case/control assignments was a consequence of allele frequency differences at the causal SNP, with no contribution from differing disease penetrances due, for example, to different environmental exposures in the two subpopulations, or the effects of selection at the causal gene, or ascertainment bias such that cases are preferentially chosen from one subpopulation. It is difficult to devise realistic models for these possibilities. Since, by definition, cryptic population structure has escaped the attention of investigators, it might be argued that any differences between subpopulations in, say, diagnosis patterns or environmental exposures, is unlikely to be large. However, this possibility cannot be ruled out, and we decided to investigate an extreme setting that is the same as demographic Scenario 3 except that all 500 cases were sampled from only one subpopulation, while in the other subpopulation all individuals were treated as controls. The results for this “biased” simulation scenario are shown in Table 7. Of the four methods that have a prespecified type 1 error rate (CHISQ, GC, STR2, AM2), only GC is able to achieve the correct level under this extreme scenario: No false positives were observed, compared with an expected total of one for each of the three analyses. However the price paid by GC for correct type 1 error is zero power at this significance level. When we increased the nominal significance level for GC so that the expected number of false positives per analysis was five, the observed average was around seven, similar to that for SLR and STR2, but the empirical power was 52% (including causal SNP) and 48% (excluding causal SNP), in each case considerably less than for both SLR and STR2. Conversely, AM2 displays the greatest empirical power in Table 7, but at the cost of a high false-positive rate. When the nominal type 1 error rate was reduced to 10-10, the observed average number of false positives was also about seven, but the empirical power values were 80% and 60%, much better than GC but lower than for SLR and STR2. Thus, when tested under this extreme ascertainment bias, CHISQ and AM2 fail because of high type 1 error rates, and GC fails because of low power. SLR and STR2 appear to perform best, displaying good power and a false-positive rate that exceeds the nominal rate for STR2, but is modest relative to other methods.
Table 7.
Empirical power and average number of false positives generated by each method in 50 simulated data sets simulated under Scenario 3 but with cases chosen only from one population
|
Scenario 3: All cases from one population
| ||||||
|---|---|---|---|---|---|---|
| CHISQ | GC | SLR | BLR | STR2 | AM2 | |
| All SNPs included | ||||||
| Power (%) | 98 | 0 | 86 | 92 | 92 | 98 |
| Average no. false +ve | 52 | 0 | 6 | 13 | 7 | 29 |
| Causal SNP excluded | ||||||
| Power (%) | 98 | 0 | 68 | 80 | 78 | 94 |
| Average no. false +ve | 52 | 0 | 6 | 14 | 7 | 31 |
| Gene 1 excluded | ||||||
| Average no. false +ve | 52 | 0 | 6 | 15 | 6 | 30 |
The GRR considered so far (1:2:4) are relatively high compared with realistic scenarios in which substructure is of most concern, and the numbers of cases and controls (both 500) relatively small. These limitations are dictated by computational constraints in a large simulation study. However, we additionally investigated the effect of sample size under Scenario 2, by increasing the sample size to 2000 cases and 2000 controls and reducing the GRR to 1:1.4:1.6 (Table 8). Even with this larger sample size, the effect of population structure remains modest, with a total of only four false positives for CHISQ over the 50 data sets. CHISQ again displays greater empirical power than all the other methods, and STR2 shows substantially lower power than all the other methods. Once again GC, STR2, and AM2 all appear to be well calibrated, with false-positive totals close to their expected value of one.
Table 8.
Empirical power and total number of false positives generated by each method over 50 simulated data sets simulated under Scenario 2 but with 2000 cases, 2000 controls, and genotype relative risks 1:1.4:1.6
|
Scenario 2: Larger sample sizes and weaker disease model
| ||||||
|---|---|---|---|---|---|---|
| CHISQ | GC | SLR | BLR | STR2 | AM2 | |
| All SNPs included | ||||||
| Power (%) | 88 | 84 | 84 | 88 | 72 | 84 |
| Total no. false +ve | 4 | 1 | 1 | 1 | 0 | 3 |
| Causal SNP excluded | ||||||
| Power (%) | 56 | 52 | 52 | 54 | 38 | 56 |
| Total no. false +ve | 4 | 1 | 1 | 2 | 1 | 2 |
| Gene 1 excluded | ||||||
| Total no. false +ve | 4 | 1 | 2 | 2 | 1 | 1 |
Finally, we resampled data under Scenario 2 with the original disease model but now considering 200 rather than 50 null genes in each of the 50 new data sets. With two SNPs per gene, this increases the total number of null SNPs from 100 to 400, which permits improved estimation of λ in GC, and of subpopulation allocation for STR2 and AM2. The additional null SNPs also provide additional opportunities for false positives, allowing the effect of population stratification on the type 1 error rate to be measured more precisely. GC, STR2, and AM2, are again well calibrated, whereas CHISQ produces nine false positives over the 50 data sets compared with an expectation of four under the nominal type 1 error rate (Table 9). Surprisingly, a comparison with row 2 of Tables 3 and 5 suggests that the empirical power has declined for this simulation for all methods except STR2, but the differences are not statistically significant. In the case of STR2, the additional markers have led to an improved power, so that it here displays about the same power as GC and AM2.
Table 9.
Empirical power and total number of false positives generated by each method over 50 simulated data sets simulated under Scenario 2 but with 201 genes (410 SNPs)
|
Scenario 2: Additional null genes
| ||||||
|---|---|---|---|---|---|---|
| CHISQ | GC | SLR | BLR | STR2 | AM2 | |
| All SNPs included | ||||||
| Power (%) | 94 | 94 | 94 | 94 | 94 | 94 |
| Total no. false +ve | 9 | 3 | 1 | 4 | 4 | 3 |
| Causal SNP excluded | ||||||
| Power (%) | 72 | 68 | 68 | 72 | 74 | 76 |
| Total no. false +ve | 9 | 3 | 1 | 3 | 2 | 4 |
| Gene 1 excluded | ||||||
| Total no. false +ve | 9 | 3 | 2 | 6 | 3 | 4 |
Discussion
Our simulation study suggests that use of a simple χ2 test generates substantial false-positive rates only in the presence of very high levels of population structure or substantial between-subpopulation difference in penetrances. Thus, explicit allowance for cryptic substructure may often be unnecessary provided that good study design principles have been used so that case and control populations are similar. However, methods that do protect against cryptic substructure typically perform well in limiting the number of false positives, and the cost of this protection, in terms of lost power, is often small. Thus researchers may prefer to routinely implement such a prophylactic statistical method even if it is unlikely to be necessary. Our results suggest that 100 randomly-selected null SNPs suffice for GC and AdmixMap, whereas additional markers were required by STRAT to achieve the same empirical power as other methods.
Among the five methods for analyzing population-based genetic association studies in the presence of population structure, no one is uniformly superior to the others, nor is any one method uniformly inferior. GC is computationally very fast, and it performs reasonably well in many settings, but it has low power when cases arise in only one subpopulation. A major drawback of GC is its inflexibility in being directly applicable only to single-point analyses. AdmixMap performs well except under this biased ascertainment scenario, but here it suffers from an inflated false-positive rate. STRAT can be relatively robust even under this biased sampling scenario, but appears to lose power in standard settings unless a large number of null markers is used. However, we assumed the correct number of subpopulations for both STR2 and AM2, which is unrealistic, and their actual performance in practice may be worse than our results suggest. Zhu et al. (2002) report that STRUCTURE tends to over-estimate the number of subpopulations. Moreover, although discrete subpopulations underlie our simulations, in practice the subpopulation model may provide only a crude approximation to a more continuously varying reality. Both STR2 and AM2 are highly computationally intensive: In our study the STRUCTURE/STRAT approach required 72 h computing time per data set, while AM2 required 24 h.
Possibly our most important finding is that simple statistical procedures based on logistic regression perform well in all scenarios considered. Our stepwise and Bayesian logistic regression methods (SLR and BLR) both protect against false positives in standard settings and mitigate their effects under extreme ascertainment bias, without significantly compromising power. These methods do not require an estimate of the number of underlying subpopulations; indeed they dispense entirely with the notion of subpopulation. It may seem surprising that these methods are so successful in countering the effects of cryptic substructure, despite the fact that population structure is not explicitly modeled. Indeed, this may explain why these methods have been little studied in the context of protection against population stratification. A possible explanation of their effectiveness is that when null markers are included in a regression analysis, each of them soaks up some of the effect of population stratification, but because this effect is shared across many markers, none of them is individually significant. In the case of SLR, this explanation does not apply to the final steps in the procedure when only few SNPs remain, but here it seems from our results that we can rely on the causal variant having a stronger signal than any of a small number of variants displaying spurious association: Broadly speaking, problems only arise when causal variants have to compete with many spurious variants.
There seems little to choose between SLR and BLR, although SLR was more robust to ascertainment bias. They are both computationally very fast, with SLR requiring only a few minutes per data set, and BLR only a few seconds. SLR and BLR enjoy several other advantages, including the ability to simultaneously incorporate signals from multiple SNPs in the vicinity of a causal locus, without the need to infer phase (Clayton et al. 2004), and also the effects of multiple causal loci. Furthermore, it would be reasonably straightforward to adapt both these approaches to very large (e.g., genome-wide) analyses, for example, by randomly choosing a subset of the available null markers when analyzing any specific locus. One drawback of SLR is that there is no nominal type 1 error rate and thus the choice of penalty must be based on trial and error. However, BLR does have an intuitive interpretation in terms of prior and posterior probabilities. Here, for comparison with non-Bayesian methods, we have not fully exploited the Bayesian interpretation, but even in classical terms the performance of the Bayesian method is close to the best.
Overall we conclude that for well-designed studies, population structure might not be a serious cause for concern, even for large sample sizes. Structured association methods protect against false positives but are computationally intensive and lead to some loss of power. Genomic Control is fast and provides the best protection against false positives, but can be overly conservative in complex scenarios, such as differential penetrances or biased ascertainment. We believe that logistic regression using null markers as covariates provides a good solution, in terms of computational speed, flexibility, ease of implementation, statistical power, and robustness. Further work is required to refine the implementation details that provide the best solutions for specific association studies.
Methods
Where not otherwise indicated, all analyses were performed using R, a statistical software package freely available at http://www.r-project.org.
Simulation study
For each gene in each simulated data set, 20,000 haplotypes were simulated under the coalescent model using MS, a program developed by Hudson (2002), and randomly paired. We used a single population for the unstructured simulation, and otherwise an island model with two subpopulations and migration between them of six and 1.5 individuals per generation for the low- and high-FST scenarios, respectively. Using maximum-likelihood estimation (Balding 2003), we found that these migration rates corresponded to FST values of ∼3.5% and 8.3%, both for equal and unequal subpopulation sizes (Table 1). The scaled recombination and mutation rates were both 20 per 50-kb gene, corresponding to 10-8 per base pair per generation. Within each gene, the required number of SNPs (10 for the causal gene and two for the remaining 50 null genes) were sampled omitting markers with minor allele frequency below 5%. Case/control status was simulated according to a disease model in which the population disease prevalence was 10% and genotypic relative risks (GRR) at a SNP chosen at random in the causal gene [proportional to P(1 - P), where P is the population allele frequency] were 1:2:4. From the ∼1000 cases, 500 were sampled at random, and similarly 500 controls were randomly selected. For the studies consisting of 2000 cases and 2000 controls, four times as many individuals were simulated. Table 1 shows the average difference between the numbers of cases and of controls in either one of the subpopulations. For example, in Scenario 3, the subpopulation from which the majority of cases is drawn contributes on average 43 more cases than controls to the data set.
Armitage's trend test
The test statistic is
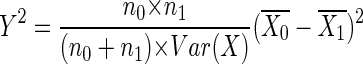 |
where n0 and n1 denote the numbers of cases and controls, respectively; X denotes the vector of genotypes, coded as 0, 1, and 2 according to the number of minor alleles; and  and
and  denote the mean genotype among cases and controls, respectively. Since Y2 is assumed to have a χ distribution, and we used α = 2 × 10⁻⁴, the critical value was 13.83. See Sasieni (1997) for further details and discussion.
Genomic control (GC)
We estimated λ by the median of the Y2 values for a SNP drawn at random from each gene, divided by the median of the  distribution. If the resulting estimate was <1, we used 1 (thus the average λ estimate exceeds 1, even under Scenario 1). We also considered estimating λ via the mean of the Y2 values, but found that the median gave slightly better power. For each SNP considered in the analysis, we assumed a
  distribution for Y2/λ.
Stepwise logistic regression (SLR)
Disease status was the outcome variable, and initially all SNP genotypes were included as predictors. From this full model we applied R function step(s), using a penalty 4 log(n), where n denotes the number of SNPs. Thus, terms were dropped from the model unless they improved the fit (measured by the deviance, which equals twice the log-likelihood) by at least this amount. Except for the study underlying Table 9, n was 110, 109, or 100 according to whether or not the causal SNP or the causal gene was excluded from the analysis. At each step we also considered reintroducing SNPs that had previously been dropped. When the procedure terminated (no further SNPs can be added or dropped), the SNPs retained in the model were treated as significant.
Bayesian logistic regression (BLR)
We used a Laplace prior that corresponds to Tibshirani's LASSO algorithm (Tibshirani 1996), implemented in software BBR developed by A. Genkin, D.D. Lewis, and D. Madigan [http://www.stat.rutgers.edu/~madigan/BBR/]). We standardized the genotype data to have mean 0 and unit variance, and the hyperparameter for the Laplace prior was set to 60 (or 120 for Table 8).
STRUCTURE/STRAT
We used the default settings assuming correlated allele frequencies and the admixture model for two subpopulations (recommended in the STRUCTURE manual as a good starting point for any analysis). We ran STRUCTURE for 20,000 burnin steps followed by 300,000 replications. We used 100,000 permutations to calculate empirical P-values within STRAT.
AdmixMap
We ran AdmixMap using the default settings assuming two ancestral populations for 2000 burnin steps and 3000 subsequent iterations. For these simulations, we assume that the genetic distance between SNPs within the same gene is 0.05 cM, whereas for loci in different genes it is 100 cM.
Acknowledgments
E.S. thanks GlaxoSmithKline for funding. We thank David Conti of USC and Members of GSK Worldwide Epidemiology and Genetics Research groups for helpful discussions.
Article published online ahead of print. Article and publication date are at http://www.genome.org/cgi/doi/10.1101/gr.4346306.
References
- Bacanu, S.A., Devlin, B., and Roeder, K. 2000. The power of genomic control. Am. J. Hum. Genet. 66 1933-1944. [DOI] [PMC free article] [PubMed] [Google Scholar]
- Balding, D.J. 2003. Likelihood-based inference for genetic correlation coefficients. Theoret. Pop. Biol. 63 221-230. [DOI] [PubMed] [Google Scholar]
- Campbell, C.D., Ogburn, E.L., Lunetta, K.L., Lyon, H.N., Freedman, M.L., Groop, L.C., Altshuler, D., Ardlie, K.G., and Hirschhorn, J.N. 2005. Demonstrating stratification in a European American population. Nat. Genet. 37 868-872. [DOI] [PubMed] [Google Scholar]
- Cardon, L.R. and Palmer, L.J. 2003. Population stratification and spurious allelic association. Lancet 361 598-604. [DOI] [PubMed] [Google Scholar]
- Cavalli-Sforza, L.L., Menozzi, P., and Piazza A. 1996. The history and geography of human genes. Princeton University Press, Princeton, NJ.
- Clayton, D., Chapman, J., and Cooper J. 2004. The use of unphased multilocus genotype data in indirect association studies. Genet. Epidem. 27 415-428. [DOI] [PubMed] [Google Scholar]
- Devlin, B. and Roeder, K. 1999. Genomic control for association studies. Biometrics 55 997-1004. [DOI] [PubMed] [Google Scholar]
- Falush, D., Stephens, M., and Pritchard, J.K. 2003. Inference of population structure using multilocus genotype data: Linked loci and correlated allele frequencies. Genetics 164 1567-1587. [DOI] [PMC free article] [PubMed] [Google Scholar]
- Freedman, M.L., Reich, D., Penney, K.L., McDonald, G.J, Mignault, A.A. Patterson, N., Gabriel, S.B., Topol, E.J., Smoller, J.W., Pato, C.N., et al. 2004. Assessing the impact of population stratification on genetic association studies. Nat. Genet. 36 388-393. [DOI] [PubMed] [Google Scholar]
- Hao, K., Li, C., Rosenow, C., and Wong, W.H. 2004. Detect and adjust for population stratification in population-based association study using genomic control markers: An application of Affymetrix Genechip Human Mapping 10K array. Eur. J. Hum. Genet. 12 1001-1006. [DOI] [PubMed] [Google Scholar]
- Helgason, A., Yngvadottir, B., Hrafnkelsson, B., Gulcher, J., and Stefansson, K. 2005. An Icelandic example of the impact of population structure on association studies. Nat. Genet. 37 90-95. [DOI] [PubMed] [Google Scholar]
- Hoggart, C.J., Parra, E.J., Shriver, M.D., Bonilla, C., Kittles, R.A., Clayton, D.G., and McKeigue, P.M. 2003. Control of confounding of genetic associations in stratified populations. Am. J. Hum. Genet. 72 1492-1504. [DOI] [PMC free article] [PubMed] [Google Scholar]
- Hudson, R.R. 2002. Generating samples under a Wright-Fisher neutral model of genetic variation. Bioinformatics 18 337-338. [DOI] [PubMed] [Google Scholar]
- Köhler, K. and Bickeböller, H. 2005. Case-control association tests correcting for population stratification. Ann. Hum. Genet. 69 1-18. [DOI] [PubMed] [Google Scholar]
- Marchini, J., Cardon, L.R., Phillips, M.S., and Donnelly, P. 2004. The effects of human population structure on large genetic association studies. Nat. Genet. 36 512-517. [DOI] [PubMed] [Google Scholar]
- Pritchard, J.K. and Rosenberg, N.A. 1999. Use of unlinked genetic markers to detect population stratification in association studies. Am. J. Hum. Genet. 65 220-228. [DOI] [PMC free article] [PubMed] [Google Scholar]
- Pritchard, J.K., Stephens, M., and Donnelly, P. 2000a. Inference of population structure using multilocus genotype data, Genetics 155 945-957. [DOI] [PMC free article] [PubMed] [Google Scholar]
- Pritchard, J.K., Stephens, M., Rosenberg, N.A., and Donnelly, P. 2000b. Association mapping in structured populations. Am. J. Hum. Genet. 67 170-181. [DOI] [PMC free article] [PubMed] [Google Scholar]
- Sasieni, P.D. 1997. From genotypes to genes: Doubling the sample size. Biometrics 53 1253-1261. [PubMed] [Google Scholar]
- Satten, G.A., Flanders, W.D., and Yang, Q. 2001. Accounting for unmeasured population structure in case-control studies of genetic association using a novel latent-class model. Am. J. Hum. Genet. 68 466-477. [DOI] [PMC free article] [PubMed] [Google Scholar]
- Thomson, G. 1995. Mapping disease genes: Family-based association. Am. J. Hum. Genet. 57 487-498. [PMC free article] [PubMed] [Google Scholar]
- Tibshirani, R. 1996. Regression shrinkage and selection via the lasso. J. R. Stat. Soc. [Ser. B] 58 267-288. [Google Scholar]
- Van Steen, K., McQueen, M.B., Herbert, A., Raby, B., Lyon, H., DeMeo, D.L., Murphy, A., Su, J., Datta, S., Rosenow, C., et al. 2005. Genomic screening and replication using the same data set in family-based association testing. Nat. Genet. 37 683-691. [DOI] [PubMed] [Google Scholar]
- Wang, Y., Localio, R., and Rebbeck, T.R. 2005. Bias correction with a single null marker for population stratification in candidate gene association studies. Hum. Hered. 59 165-175. [DOI] [PubMed] [Google Scholar]
- Zhu, X., Zhang, S.L., Zhao, H., and Cooper, R.S. 2002. Association mapping, using a mixture model for complex traits. Genet. Epidemiol. 23 181-196. [DOI] [PubMed] [Google Scholar]