

Abstract
Neurochemical variability among individual Drosophila heads has been examined with the sensitivity of electro-chemical detection and the selectivity of micellar electro-kinetic capillary chromatography. Homogenization of single Drosophila heads in volumes as small as 100 nL has been accomplished. Here we demonstrate reproducible separations for single fly heads in 250-nL volumes providing a 4-fold increase in sensitivity without overloading the electrochemical detector. This increase in sensitivity allows detection of previously undetected analytes, such as N-acetyltyramine (naTA) and octopamine (OA). Analytes including L-3,4-dihydroxyphenylalanine, N-acetyloctopamine, N-acetyldopamine, naTA, N-acetylserotonin, OA, dopamine, tyramine, and serotonin also have been consistently identified in single-head homogenates and observed with homogenates representing populations of Drosophila. Neurochemical variation between individual flies as well as the consistency within a population indicates varying amounts of neurotransmitter turnover. The inception, design, and fabrication of a miniature tissue homogenizer has enabled the separation of biogenic amines and metabolites from these severely volume-limited single Drosophila head homogenates.
As an organism develops from a single cell to a complex, multicellular being, many changes occur at the cellular and physiological levels. All individuals in a population share similar neurochemical foundations that control diverse neural processes ranging from simple reflexive behaviors to higher order brain functions. Monoamine systems in the central nervous system, in particular, are crucial for motor control, emotion, and cognition. Anomalies in these systems underlie pathogenesis of various neurological and psychiatric disorders including Parkinson's disease, schizophrenia, and depression.1-4 In normal individuals, subtle differences in monoamine levels and functions are postulated to affect traits and vulnerability to cognitive, addictive, and affective disorders. To facilitate the task of identifying the neurochemical and neurobiological basis of individual traits, it is critical to monitor the availability and turnover of each monoamine from one individual to another.
Analytically, great strides have been made to improve methodologies for the analysis of biological microenvironments, which could provide insight into the functional significance of biogenic amines present. Advances in miniaturizing analytical instrumentation have led to an increase in chemical, temporal, and spatial information from a variety of samples. The difficulty in examining volume-limited samples has largely been overcome as separations can be achieved with nanoliter volumes. This capability expands the number of applications possible, including the analysis of small amounts of tissue and even single cells, and is particularly useful in the area of neuroscience.5
Capillary electrophoresis (CE) is the separation scheme that is often employed for the investigation of neurochemical compounds in limited sample volumes.5-14 The fast separation times, high-resolution capabilities, and excellent mass detection limits make CE a powerful tool for the analysis of complex biological mixtures. Addition of a surfactant to the CE buffer generates an enhanced degree of resolution and aids in the separation of analytes with similar charge, such as biogenic amines. Moreover, CE can be coupled to a variety of detection techniques. Amperometric electrochemical detection (EC) is one such sensitive method that does not involve sample derivatization and yields enhanced selectivity by eliminating interference from nonelectroactive species.
Homogeneous mixtures of biological tissue samples are frequently examined by utilizing CE–EC. Model systems such as the fruit fly, Drosophila melanogaster, are employed as they provide an essential resource for understanding many neurophysiological functions. Drosophila is an invaluable asset for studying many developmental and physiological processes. Moreover, this genetically tractable model system exhibits many features in common with mammals. Functional conservation of high-order brain function, signal transduction pathways, and key molecules present in vertebrate systems, such as dopamine (DA) and serotonin (5-HT), have also been demonstrated in this small fly.15-18 Indeed, the presence of biogenic amines have been well documented in Drosophila. Separations-based methods such as high-performance liquid chromatography (HPLC) with EC detection19-22 and gas chromatography (GC) coupled to mass spectrometry (MS)23 have been used to resolve biogenic amines present in samples taken from homogenates of Drosophila populations, reporting limited quantification of several monoamines. More recently, micellar electrokinetic capillary chromatography (MEKC) with EC detection has addressed the analytical challenge of examining biogenic amines in homogenates of small populations of flies.24,25 This work has elucidated the presence of several principal biogenic amines relevant to Drosophila including L-3,4 dihydroxyphenylalanine (L-DOPA), DA, tyramine (TA), and 5-HT,24,25 as well as metabolites of extreme importance to the invertebrate including N-acetyl DA (naDA), N-acetyl 5-HT (na5-HT), and N-acetyloctopamine (naOA).24 In particular, this work has offered significant information for fly research as optimized and reproducible separations of biogenic amine precursors, transmitters, and metabolites in Drosophila homogenates have been carried out providing a method sensitive enough to detect changes in monoamine quantities between wild-type and genetically modified animals.
While separations-based research on populations of Drosophila promises to lead to neurological information about neuromodulator location and amount for broad studies aimed at a generalized outcome, it is desirable to determine the components of single flies to examine variability in biologically significant neurochemicals among individuals with distinct traits. It should also be possible to correlate levels of the biogenic amines and their metabolic byproducts obtained from an individual Drosophila having a specific behavioral propensity to certain external stimuli. These studies when applied, for example, to an animal model of disease and behavior, could provide a better understanding of the role of biogenic amines in neurological dysfunction.
In this paper, in contrast to previous work where populations of flies were examined, we have implemented MEKC–EC to determine biogenic amine and metabolite levels in single fly heads. Sample concentration of single Drosophila head homogenates by use of smaller sample volumes has allowed a 4-fold increase in sensitivity for the detection and quantification of amines existing in trace amounts. Variations in the neurochemical composition among individuals have been quantified at the picomole level. Preliminary data suggest that different levels of neurotransmitter turnover are present between individuals. Additionally, the identification and quantification of the previously undetected metabolite naTA has been achieved. Innovative construction of miniature tissue homogenizers from glass capillaries has enabled reliable, reproducible, and more sensitive separations of monoamines and their metabolites from the severely volume-limited single Drosophila head.
EXPERIMENTAL SECTION
Reagents. All amine standards, L-DOPA, dihydroxybenzylamine (DHBA), N-tris(hydroxymethyl)methyl-2-aminoethanesulfonic acid (TES), and metabolite standards (unless otherwise indicated) were purchased from Sigma (St. Louis, MO). The naDA, naOA, and naTA were obtained from the NIMH Chemical Synthesis and Drug Supply Program. SDS and a 48% aqueous solution of hydrofluoric acid were obtained from Aldrich (Milwaukee, WI). All chemicals were used as received. Separations were performed in 10 mM TES buffer containing 30 mM SDS and 2% 1-propanol, adjusted to pH 7.09. All standards were prepared as 10 mM stock solutions in 0.1 M perchloric acid and were diluted to the desired concentration with additional 0.1 M perchloric acid.
Drosophila Strains. Canton-S wild-type D. melanogaster strains were obtained from the Bloomington Drosophila Stock Center (Indiana University, Bloomington, IN) and were maintained in the laboratory. Flies were cultured on standard cornmeal/agar medium and collected between 3 and 5 days after emerging from pupal cages.
Miniature Tissue Homogenization. The miniature tissue homogenizer was fabricated as described in detail in the subsection on Procedures below. Briefly, a model P-97 micropipette puller (Sutter Instrument Co., Novato, CA) was employed to fabricate the glass homogenization rod using 1.2-mm-outer diameter, 0.69-mm-inner diameter, 10-cm-long borosilicate glass capillaries (Sutter Instrument Co.). The same puller was also utilized to pull standard 9-in. Pasteur pipets, which formed the glass homogenization vessel. Single-head homogenization was accomplished by manual grinding and ultrasonication using a modified VirSonic Digital 600 (Virtis, Gardiner, NY) for 30 s at power level 5. Images were obtained throughout the procedure using an Olympus SZXILLD100 microscope (Olympus, Melville, NY) and captured with a Kodak Digital Science MDS 100 camera (Eastman Kodak Co., Rochester, NY)
Instrumentation and Analysis. The CE system with end-column amperometric detection utilized in this study was built in-house and has been described previously.26,27 Briefly, 45–50 cm of fused-silica capillary with an outer diameter of 148 μm and i.d. of 13 μm (Polymicro Technologies, Phoenix, AZ) was used for all separations. Amperometric EC detection was carried out with a two-electrode format in which a 5-μm carbon fiber microelectrode was held between +0.70 and +0.75 V versus Ag/AgCl reference electrode (World Precision Instruments, Sarasota, FL). Faradaic currents were amplified with a Keithley model 427 current amplifier (Cleveland, OH) and collected with a LabView 5.1 interface (National Instruments, Austin, TX). Microsoft Excel (Redmond, WA) was used to generate the electropherograms and to perform statistical tests. Data analysis was performed using PeakFit Separation and Analysis Software (SPSS Inc., Chicago, IL) to estimate individual peak areas in all electropherograms.
Procedures. Capillaries were filled with separation buffer using a stainless steel reservoir with applied He pressure (100 psi). Buffer solutions were filtered with a 0.2-μm nylon filter (Alltech, Deerfield, IL) prior to use. Injections were performed electrokinetically at 5 kV for 5 s extracting ∼1 nL of homogenate from the single-head homogenate inside the tissue homogenizer. The electrokinetic injection from the microvial homogenizer has been accomplished by manual insertion of the capillary and electrode into the vial with no additional capillary manipulation required. To enhance microelectrode placement, the capillary inner diameter was enlarged via HF etching as previously described.27 Approximately 2 mm of the polyimide coating was removed from the capillary to expose the fused silica. The exposed portion of the capillary was placed in HF for 10 min at 200 psi, after which the same segment of capillary was placed in a sodium bicarbonate solution to neutralize the acid and was washed with water. Capillary clogging and reproducibility were closely monitored. Typically, one 45–50-cm piece of capillary was employed for a prestandard, a single homogenate, and a poststandard. However, if the capillary was not compromised, as determined by evaluation of the internal standard used with all samples, two or three single-head homogenized samples could be analyzed using the same capillary.
To create the glass homogenization chamber, the Pasteur pipet is scored with a glass cutter at ∼7 cm from the delivery tip. The 7-cm glass tube is subsequently placed in a micropipet puller and pulled into two halves, a manner consistent with creating micropipets possessing tapered tips.28 The pulled glass tip is then rotated in a flame to melt the glass, thereby sealing the end of the tube and generating a miniature glass homogenization chamber. The chamber is ultimately cut to a total height of ∼1 cm. Fabrication of glass homogenization rods is accomplished by utilizing the smaller borosilicate glass capillaries and the micropipet puller in the same manner as the homogenization chamber. The apex of the rod is uniformly rotated in a high-temperature flame to produce a rounded, smooth tip. Thus, in this manipulation, the micropipet puller provides a standard tool for creating the homogenization chamber and the glass homogenization rods.
Safety Considerations. An in-house built safety interlock box was utilized to protect the user from high voltage. Safe laboratory handling practices (HF was used in a hood with proper face protection and PVC gloves, and long-sleeve pants and shirts were worn) were observed for HF use, with the acid neutralized with sodium bicarbonate prior to disposal by the Penn State EHS office.
RESULTS AND DISCUSSION
Homogenization of a Single Fly Head. Homogenization of a single fly head is extremely challenging. Although single cells have been homogenized in early work,7,29 a Drosophila head has a hard cuticle with a small brain inside and has very small neurons (3–5 μm in diameter) necessitating a two-step homogenization in nanoliter volumes. To facilitate the analysis of single fly heads (the fly brain is ∼8 nL), a procedure has been developed to construct a miniature tissue homogenizer consisting of a glass chamber made from a 2-mL pipet tip and a glass rod fabricated from borosilicate capillaries. The micropipet puller provides a standard method for creating the homogenization chamber and the glass homogenizing rods. As illustrated in Figure 1A, a homogenization chamber with a width tapering from ∼1.5 mm to a well of ∼500 μm can be created with a high degree of consistency. The outer diameter of the borosilicate glass rod is maintained at 1.2 mm, enabling a snug fit between rod and well. The combination is ideally suited for homogenization of a single Drosophila head, as it allows the head to be positioned against the bottom of the glass.
Figure 1.
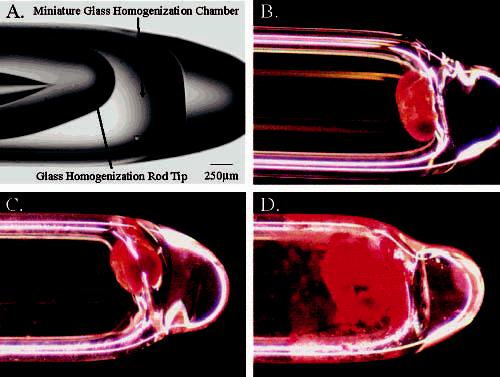
(A) Image of miniature tissue homogenizer with arrows indicating a glass pipet pulled and sealed serving as the homogenization chamber and a glass capillary pulled and sealed serving as a tissue homogenizing rod. (B) Glass microvial containing a single fly head. (C) Glass microvial containing a single fly head in 250 nL of homogenization solution before homogenization. (D) Glass microvial containing a single fly head in 250 nL of homogenization solution after homogenization. Scale bar is the same for all four panels.
The homogenization procedure involves placement of a single head into the miniature chamber (Figure 1B). A nanoliter-scale aliquot of perchloric acid containing a 100 μM internal standard is then added to the homogenization chamber (Figure 1C). The internal standard allows for adjustment of loss of sample due to absorption during homogenization, incomplete sample transfer, and differences in the manual injection. Mechanical tissue disruption is achieved by pulverizing with the glass homogenization rod for 1 min. This step is necessary to penetrate the cuticle, or outer exoskeleton, of the fly head and to expose the neuronal tissue. Following manual grinding, ultrasonication is employed to further break apart the tissue. Due to the extremely small size of the homogenization chamber, the commercial instrument has been modified utilizing a 30-gauge platinum wire as the sonication probe. This ultrasmall probe couples adequately with the existing sonication probe and provides ample disruption of the brain tissue as shown in Figure 1D and presumably cellular membranes. Taken together, this procedure has enabled systematic and efficient sample homogenization.
MEKC Separations of Amines from the Miniature Homogenizer. Figure 2 illustrates the separation and identification of 12 standard analytes injected from the miniature tissue homogenizer. The use of a micellar buffer enables the separation of similarly sized and charged biogenic amines and metabolites. Peak identification is similar to those previously published;25 however, in this study, several additional metabolites thought to be present in Drosophila have also been determined. As shown in Figure 2, resolution of all analytes is achieved consistently in less than 20 min.
Figure 2.
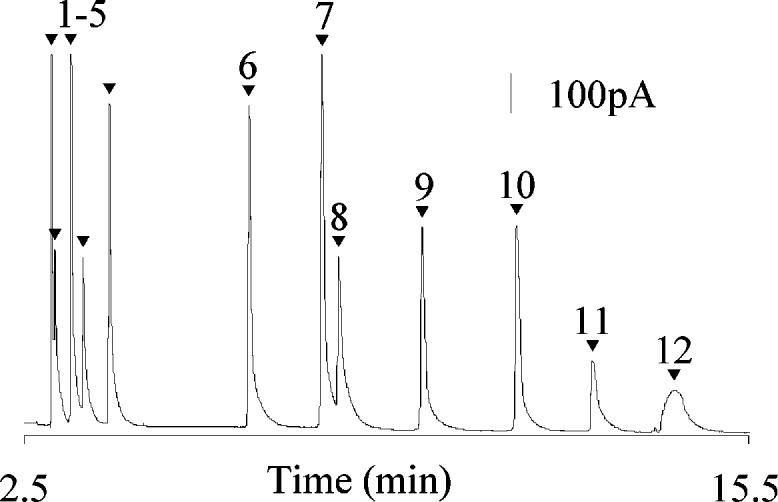
Separation of 100 μM concentration of each amine: l-DOPA (1), naOA (2), naDA (3), naTA (4), na5-HT (5), NE (6), E (7), OA (8), DHBA (9), DA (10), TA (11), and 5-HT (12). Separation was performed in a 13-μm-i.d. capillary with a separation potential of 562 V/cm. The working electrode was held at +750 mV vs a Ag/AgCl reference electrode. Buffer: 10 mM TES, 30 mM SDS, and 2% 1-propanol.
To establish the sensitivity of the MEKC–EC system utilizing miniature tissue homogenizers as sampling vessels, separations have been performed by electrokinetically introducing the 12-compound mixture at 100 μM concentration of each analyte in sample volumes less than 1 μL. Electropherograms obtained from sample volumes of 1000, 750, 500, 250, and 100 nL were all nearly identical. Consistent peak shape, resolution, and peak efficiency have been observed regardless of total sample volumes. The peak efficiency has been determined for each analyte at each volume and is consistent among differing sample volumes. Owing to use of the micellar buffer, the best calculated peak efficiency utilizing the N Moment method of the PeakFit Separation and Analysis Software is ∼60 000 theoretical plates for l-DOPA. The analyte E has the best relative standard error of the mean at 3.3%. An important invertebrate neurotransmitter, OA, elutes with calculated theoretical plate numbers of 4600 (1000 nL), 3800 (750 nL), 4700 (500 nL), 2900 (250 nL), and 2900 (100 nL) with a relative standard error of the mean of 10.3%. A similar trend is observed for the remaining analytes. Utilizing the N Moment method, the calculated efficiencies are low as many peaks tail somewhat; however, the peak efficiencies for the near-Gaussian peaks using the N Gaussian method of Peakfit are in the range of 30 000–120 000 theoretical plates for different analytes.
Volume Variation for Single-Head Analysis. Single Drosophila heads have been homogenized inside of miniature tissue homogenization chambers with varying volumes of homogenization solution in order to evaluate the ability of the system to resolve samples containing varying concentrations of monoamines. Past studies have utilized populations of Drosophila with sample volumes of 1 μL/head;24,25 thus, we initiated the current studies with a 1-μL addition of homogenization buffer to a single head (Figure 3a). The separation profile of a single Drosophila head in a 1-μL homogenization volume very closely matches that of previous population studies.25 This result clearly demonstrates the utility of the miniature tissue homogenizer for homogenizing a single fly head. Subsequently, addition of homogenization solution in 750-, 500-, 250-, and 100-nL quantities to a single head was performed (Figure 3b-e). Regardless of sample volume, the profile of a single Drosophila head homogenate remains quite consistent in all the homogenization solution volumes attempted. As the biological samples become more concentrated in the smaller homogenization solution volumes, on the other hand, peak intensities increase. This could be attributable to analyte overload at the electrochemical detector, ultimately causing a decrease in separation efficiency.
Figure 3.

Electropherograms of single Drosophila head homogenates in (a) 1000, (b) 750, (c) 500, (d) 250, and (e) 100 nL of homogenization buffer. Highlighted are na5-HT (5) and 5-HT (12) corresponding to the standards labeled in Figure 2. Separations were performed on unique 13-μm-i.d. capillaries with separation potentials of (a) 566, (b) 568, (c) 558, (d) 552, and (e) 563 V/cm. Unique working electrodes were used for each separation and were held at +750 mV vs a Ag/AgCl reference electrode. Buffer: 10 mM TES, 30 mM SDS, and 2% 1-propanol.
Balancing the reduction in sample volume without compromising resolution of analytes is not trivial. Several of the analyte peaks, such as na5-HT (5 in Figure 3) and 5-HT (12 in Figure 3), become more resolved as sample volume decreases, thus making quantification more reliable and consistent. Alternatively, reduced resolution has been observed in the first half of the separation especially in the 100-nL sample volume. This loss, defined as coelution of analytes and analyte overloading, is ascribed to not only the increased concentrations of analytes in the sample but also to the greater interference by organic and inorganic solutes present in the tissue. Additionally, with a smaller amount of sample solution present in Drosophila head tissue homogenate, it becomes more difficult to obtain reliable electropherograms via clean injections and unclogged capillary. Indeed, though separations using 100 nL of homogenization solution provide a 10-fold increase in analyte amount detected compared to that resolved from a 1-μL sample, these separations are significantly less reproducible than those performed with 250-nL samples. Thus, the volume chosen for the work reported in the following section is 250 nL.
Analyte Identification in a 250-nL Drosophila Head Homogenate. Quantitative and qualitative information has been acquired from electropherograms of single fly heads in 250-nL samples (Figure 4). Figure 4A shows the separation of a typical Drosophila single-head homogenate from a 250-nL sample. Analyte peak identification has been completed based upon the migration time of standards collected before and after the homogenate sample on the same capillary, as well as normalizing to the migration time of the internal standard DHBA. The biogenic amine precursor, l-DOPA (1) and four N-acetylated metabolites, naOA (2), naDA (3), naTA (4), and na5-HT (5), are highlighted in Figure 4B. At the 250-nL sample volume, these peaks are clearly present and resolved such that quantification is possible. NE and E have not been found in the single head, which is consistent with previous reports.24,25 On the other hand, the important Drosophila neurochemical, OA (8), is present along with the internal standard DHBA (9) and 5-HT (12) as shown in Figure 4C. DA (10) and TA (11) are also present but in very small quantities; thus, an enlarged view of the baseline between 11 and 13 min is shown in Figure 4D where both are visible. Nine different analytes have been reproducibly identified in a single Drosophila head homogenate without sample cleanup, which was previously adopted in the studies of Drosophila population homogenates.24,25
Figure 4.

Electropherogram of a single fly head homogenate in 250 nL of homogenization solution. (A) MEKC–EC separation of a single male head homogenate. (B) Enlargement of the first 5 min of the separation highlighting l-DOPA (1), naOA (2), naDA (3), naTA (4), and na5-HT (5). (C) Enlargement of the latter half of the separation highlighting OA (8), DHBA (9), and 5-HT (12). (D) Enlargement emphasizing DA (10) and TA (11). Field strength for the 13-μm-i.d. capillary is 568 V/cm. Working electrode was held at +750 mV vs a Ag/AgCl reference electrode. Buffer: 10 mM TES, 30 mM SDS, and 2% 1-propanol.
The identified peaks shown in Figure 4 are consistent with previous population studies on Drosophila.19-25 The presence of l-DOPA is expected as it is a synthetic precursor to DA. The ability to identify the N-acetylated metabolites is significant because they represent the primary products of monoamine deactivation in insects. naOA, naDA, and na5-HT have been previously identified in Drosophila fly head population homogenates;24 however, the separation and tentative identification of naTA in a Drosophila extract is novel. Interestingly, the neuromodulator OA (8 in Figure 4C) has become highly noticeable at the increased sample concentration of the smaller volume and single-head approach. This contrasts with our previous work where 30–50 heads were homogenized together in volumes of 1 μL/head and OA is not detectable.25 It is notable that the current results, in general, agree with other published reports,20,24 and it is not entirely clear why we do not observe OA under the previously described conditions. One possibility is that OA is below the detection limit for a real sample under those conditions and the better detection limits gained with the lower volume and better homogenization described here allow its detection. OA is an insect counterpart of mammalian neurotransmitter NE and thus is of extreme importance in the field of Drosophila research. TA represents a trace amine in both insect and mammalian central nervous systems although its physiological functions are poorly understood. Thus, the increase in the quantity of this analyte detected with the increase in sample concentrations is also promising.
Variability of Biogenic Amines among Single Fly Heads. A significant advantage for using CE techniques to examine single-head homogenates is the qualitative as well as the quantitative data that can be obtained at the level of an individual animal. This information may uncover the small variability in the monoamine content from one animal to another while demonstrating overall consistency within a homogeneous population. To determine the sensitivity of the MEKC–EC system for the analysis of concentrated, single-head samples, a series of individual Drosophila heads have been homogenized in 250 nL of buffer and their biogenic amine and metabolite levels have been evaluated. Electropherograms have been obtained for three single Drosophila head homogenates, and nine compounds native to the fly have been quantified. Figure 5 shows the amount of each analyte present in the individual head homogenate, and the numeric values for the average amount of analyte detected in the three homogenates ± the standard error of the mean (SEM) are reported.
Figure 5.
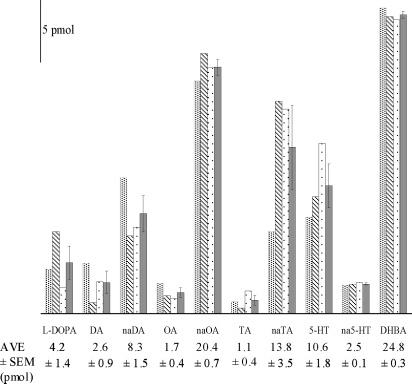
Quantification of neurochemicals from three single fly heads at 250-nL volumes injected from a micrometer-sized tissue homogenizer. Bars represent values for individual flies 1, 2, and 3 (patterns) and the average (solid) ± SEM of the amines in the three flies. Numeric averages and SEM are reported below each amine. Separations were performed in a 13-mm-i.d. capillary with separation potentials of (1) 568, (2) 568, and (3) 552 V/cm. The working electrodes were held at +750 mV vs a Ag/AgCl reference electrode. These numbers have been calculated based on the known concentration of the corresponding analyte in the standard mixture separated prior to the homogenate and the values normalized to the internal standard DHBA.
The picomole levels of biogenic amines detected in the single-head analysis are a distinct improvement in sensitivity over previous studies of populations of flies. In 2003, Ream et al. reported averages of 747 fmol for l-DOPA, 16 fmol for DA, 25 fmol for TA, and 61 fmol for 5-HT per head for three independent populations of ∼50 flies using MEKC–EC.25 Paxon et al. continued this study on fly populations in 2005, utilizing a MEKC–EC system with borate complexation to enhance the resolution of metabolic compounds such as naOA (87 fmol/head) and na5-HT (553 fmol/head), as well as resolving and quantifying OA (190 fmol/head).24 Similar results have also been found by HPLC–EC and GC/MS methods.20,21,23 The work presented here, when compared to previous work carried out on populations, shows an almost 4-fold improvement in sensitivity apparently resulting from a 4-fold increase in analyte concentration for single-head homogenates (1 μL of buffer/head for population samples vs 250 nL for a single head). The sonication step newly adopted in the single-head homogenate preparation might also result in an improvement in sensitivity by more effectively disrupting vesicular and cellular membranes.
The three Drosophila heads analyzed here clearly contain the biogenic amines and metabolites of interest; however, these levels vary among individuals and it is very interesting to speculate on the meaning of these variations, albeit for data from only three individual flies. These differences do, however, demonstrate the ability of the technique to examine fly-to-fly variability. Environmental conditions associated with fly culture including food, temperature, crowding, and humidity are minimized as these flies have been chosen from the same culture population. Given these caveats, the variation in the quantities of monoamines appears to represent authentic differences among individual animals with the same genetic background and environment. Additionally, the constancy of the internal standard DHBA quantification (RSD 1.1%) supports that these chemical changes are genuine. The metabolite naOA is present in the greatest abundance with an average of 20.4 pmol determined for the three heads with a RSD of 3.2%. This deviation is starkly contrasted by DA, for which larger variations are observed (36% RSD). Interesting correlations can be made from these data as well. For example, l-DOPA, the monoamine precursor, is observed to be present in higher quantities in fly 2, where the amount of DA in the same fly is quite low as compared to the other fly heads. This likely indicates varying rates of metabolism between flies that is further noted in fly 1, where a lower level of l-DOPA is correlated with higher levels of both DA and naDA. Similarly, much larger quantities of naOA are detected in the flies relative to the amount of OA observed. In past studies, OA has been difficult to detect; however, the abundance of naOA in the current study could indicate rapid turnover of OA and might explain the difficulty in measuring this primary neuromodulator. Similar results have been observed for the metabolism of TA to naTA. The identification of naTA in Drosophila is novel, and quantification of single fly heads could lead to a better understanding of the degradation pathway of TA. The abundance of the N-acetylated compounds supports previous notions that N-acetylation is the primary route of monoamine deactivation in the fly. Finally, the large fluctuations in 5-HT observed here may correlate with the individuality of Drosophila.
CONCLUSIONS
The challenging task of obtaining reproducible homogenization of single Drosophila heads has been accomplished with miniature tissue homogenizers in volumes as low as 100 nL. Considering sensitivity, overload, and ease, optimal homogenization volume for a single fly head is presently 250 nL. At this volume, a 4-fold increase in sensitivity is observed without excessive overloading of the detector; moreover, previously undetected analytes, such as naTA and OA, have been determined. The MEKC–EC system provides a method for probing intricate microenvironments with use of the novel miniature tissue homogenizer and has been used to resolve nine analytes, including l-DOPA, naOA, naDA, naTA, na5-HT, OA, DA, TA, and 5-HT. The separations shown here correspond well with previous population studies on Drosophila. The results obtained reveal picomole variability of each monoamine and its metabolite among individual flies sampled from a genetically homogeneous population. Moreover, a preliminary correlation of relative abundance among the synthetic precursor l-DOPA, DA, and its metabolite naDA in each fly head has been noted.
ACKNOWLEDGMENT
This work was supported, in part, by grants from the National Institutes of Health (K.-A.H.; A.G.E) and the National Science Foundation (A.G.E.). Dr. George A. Brine from the NIMH repository is gratefully acknowledged for generously providing N-acetylated compounds. Thanks to Youngcho Kim for aid in fly culture. Dr. Anne Andrews is also gratefully acknowledged for use of her tissue ultrasonicator.
References
- 1.Brown AS, Gershon S. J. Neural Transm. Gen. Sect. 1993;91:75–109. doi: 10.1007/BF01245227. [DOI] [PubMed] [Google Scholar]
- 2.Miyamoto S, Duncan GE, Marx CE, Lieberman JA. Mol. Psychiatry. 2005;10:79–104. doi: 10.1038/sj.mp.4001556. [DOI] [PubMed] [Google Scholar]
- 3.Ogawa N. Neurology. 1998;51:S13–20. doi: 10.1212/wnl.51.2_suppl_2.s13. [DOI] [PubMed] [Google Scholar]
- 4.Stoof JC, Winogrodzka A, van Muiswinkel FL, Wolters EC, Voorn P, Groenewegen HJ, Booij J, Drukarch B. Eur. J. Pharmacol. 1999;375:75–86. doi: 10.1016/s0014-2999(99)00260-5. [DOI] [PubMed] [Google Scholar]
- 5.Powell PR, Ewing AG. Anal. Bioanal. Chem. 2005;382:581–591. doi: 10.1007/s00216-005-3075-x. [DOI] [PubMed] [Google Scholar]
- 6.Bowser MT, Kennedy RT. Electrophoresis. 2001;22:3668–3676. doi: 10.1002/1522-2683(200109)22:17<3668::AID-ELPS3668>3.0.CO;2-M. [DOI] [PubMed] [Google Scholar]
- 7.Kennedy RT, Oates MD, Cooper BR, Nickerson B, Jorgenson JW. Science. 1989;246:57–63. doi: 10.1126/science.2675314. [DOI] [PubMed] [Google Scholar]
- 8.Kennedy RT, Watson CJ, Haskins WE, Powell DH, Strecker RE. Curr. Opin. Chem. Biol. 2002;6:659–665. doi: 10.1016/s1367-5931(02)00373-3. [DOI] [PubMed] [Google Scholar]
- 9.Shou M, Smith AD, Shackman JG, Peris J, Kennedy RT. J. Neurosci. Methods. 2004;138:189–197. doi: 10.1016/j.jneumeth.2004.04.006. [DOI] [PubMed] [Google Scholar]
- 10.Stuart JN, Hummon AB, Sweedler JV. Anal. Chem. 2004;76:121A–128A. [PubMed] [Google Scholar]
- 11.Stuart JN, Sweedler JV. LC-GC Eur. 2003;16:427–429. [Google Scholar]
- 12.Stuart JN, Sweedler JV. Anal. Bioanal. Chem. 2003;375:28–29. doi: 10.1007/s00216-002-1609-z. [DOI] [PubMed] [Google Scholar]
- 13.Stuart JN, Sweedler JV. Proc. Natl. Acad. Sci. U.S.A. 2003;100:3545–3546. doi: 10.1073/pnas.0830869100. [DOI] [PMC free article] [PubMed] [Google Scholar]
- 14.Woods LA, Roddy TP, Ewing AG. Electrophoresis. 2004;25:1181–1187. doi: 10.1002/elps.200405842. [DOI] [PubMed] [Google Scholar]
- 15.Fernandez-Chacon R, Sudhof TC. Annu. Rev. Physiol. 1999;61:753–776. doi: 10.1146/annurev.physiol.61.1.753. [DOI] [PubMed] [Google Scholar]
- 16.Korsching S. Curr. Opin. Neurobiol. 2002;12:387–392. doi: 10.1016/s0959-4388(02)00348-3. [DOI] [PubMed] [Google Scholar]
- 17.Panda S, Hogenesch JB, Kay SA. Nature. 2002;417:329–335. doi: 10.1038/417329a. [DOI] [PubMed] [Google Scholar]
- 18.Waddell S, Quinn WG. Trends Genet. 2001;17:719–726. doi: 10.1016/s0168-9525(01)02526-4. [DOI] [PubMed] [Google Scholar]
- 19.McClung C, Hirsh J. Curr. Biol. 1999;9:853. doi: 10.1016/s0960-9822(99)80389-3. [DOI] [PubMed] [Google Scholar]
- 20.Monastirioti M, Linn CE, Jr., White K. J. Neurosci. 1996;16:3900–3911. doi: 10.1523/JNEUROSCI.16-12-03900.1996. [DOI] [PMC free article] [PubMed] [Google Scholar]
- 21.Neckameyer WS. Dev. Biol. 1996;176:209–219. doi: 10.1006/dbio.1996.0128. [DOI] [PubMed] [Google Scholar]
- 22.Ramadan H, Alawi AA, Alawi MA. Cell Biol. Int. 1993;17:765–771. doi: 10.1006/cbir.1993.1138. [DOI] [PubMed] [Google Scholar]
- 23.Watson DG, Zhou P, Midgley JM, Milligan CD, Kaiser K. J. Pharm. Biomed. Anal. 1993;11:1145–1149. doi: 10.1016/0731-7085(93)80096-j. [DOI] [PubMed] [Google Scholar]
- 24.Paxon TL, Powell PR, Han K-A, Ewing AG. Anal. Chem. 2005;77:5349–5355. doi: 10.1021/ac050474m. [DOI] [PMC free article] [PubMed] [Google Scholar]
- 25.Ream PJ, Suljak SW, Ewing AG, Han KA. Anal. Chem. 2003;75:3972–3978. doi: 10.1021/ac034219i. [DOI] [PubMed] [Google Scholar]
- 26.Wallingford RA, Ewing AG. Anal. Chem. 1988;60:258–263. doi: 10.1021/ac00154a015. [DOI] [PubMed] [Google Scholar]
- 27.Sloss S, Ewing AG. Anal. Chem. 1993;65:577–581. [Google Scholar]
- 28.Brown KT, Flaming DG. Advanced Micropipet Techniques for Cell Physiology. Wiley; New York: 1986. [Google Scholar]
- 29.Kennedy RT, Jorgenson JW. Anal. Chem. 1989;61:436–441. doi: 10.1021/ac00180a012. [DOI] [PubMed] [Google Scholar]