Abstract
The hydration of gas-phase ions produced by electrospray ionization was investigated. Evidence that the hydrated ions are formed by two mechanisms is presented. First, solvent condensation during the expansion inside the electrospray source clearly occurs. Second, some solvent evaporation from more extensively solvated ions or droplets is apparent. To the extent that these highly solvated ions have solution-phase structures, then the final isolated gas-phase structure of the ion will be determined by the solvent evaporation process. This process was investigated for hydrated gramicidin S in a Fourier-transform mass spectrometer. Unimolecular dissociation rate constants of isolated gramicidin S ions with between 2 and 14 associated water molecules were measured. These rate constants increased from 16 to 230 s−1 with increasing hydration, with smaller values corresponding to magic numbers.
Information about the role of water on the structure and reactivity of ions can be obtained from studies of the physical properties of hydrated gas-phase ions. Such studies provide a bridge between the chemistry of an isolated gas-phase ion and an ion present in solution. Water is essential to the function of biomolecules. Studies of the hydration of gas-phase biomolecule ions should therefore provide an improved understanding of the role of water in both conformation and reactivity. Water clusters [1] and the hydration of small inorganic and organic ions [2] have been investigated extensively. However, there have been relatively few reports on the hydration of larger gas-phase biomolecule ions. Using electrospray ionization (ESI), several groups have demonstrated that hydrated ions can be produced under “gentle” ESI source conditions [3]. Hydration energies for the attachment of water molecules to some amino acids, small peptides and proteins have been measured in equilibria experiments [4].
There are several studies that address the question of how many water molecules are required in order for a biomolecule to have a solution-phase structure [5]. Calorimetry studies have shown that extensive hydration is not necessary in order for a protein to have its solution-phase thermodynamic properties. Using a drop calorimeter, Yang and Rupley [5b] measured the apparent specific heat capacity of the protein lysozyme as a function of water content. The heat capacity of the dry lysozyme is 1.26 J/K g. With the addition of water to the dry protein, the heat capacity steadily increased until reaching the solution limiting value of 1.483 J/K g at 38% hydration (h), i.e., 0.38 g of water bound per 1.0 g of protein (h = 0.38). The measured heat capacity does not change with further hydration. Based on these results, the authors concluded that at 38% hydration, the thermodynamic properties of the protein do not differ significantly from those of the protein in dilute solution. For lysozyme, 38% hydration corresponds to about 300 water molecules per protein molecule. These results are in good agreement with previous results obtained from NMR [5c], X-ray diffraction [5d], and preferential hydration [5e] experiments. Using NMR, Bryant and co-workers [5c] measured the relaxation rates for the protons of water molecules absorbed to lysozyme powders as a function of temperature and determined the amount of nonfreezing water to be h ~0.35. Rupley and co-workers [5d] located a total number of water molecules corresponding to about h = 0.25 at the surface of a crystalline lysozyme molecule by X-ray diffraction methods. A similar value, h = 0.24, was obtained by analysis of preferential hydration performed by Cox and Schumaker [5e]. More recently, molecular dynamics simulations done by Steinbach and Brooks [5g] of the hydration of carboxymyoglobin showed that this protein is fully hydrated by ~350 water molecules, or h = 0.35. The simulations indicate that the water molecules associate primarily with the charged surface groups of the protein.
Previously, we reported that extensively hydrated gramicidin S ions can be produced by ESI [3d]. The extent of hydration can be readily controlled by varying the temperature of the heated metal capillary of the ESI interface. A near Gaussian distribution of ions with more than 50 water molecules attached could be formed. A value of 38% by weight hydration corresponds to ~23 water molecules for gramicidin S. Thus, these ions can be formed with a sufficient number of water molecules attached that they should have solution-phase structures. At intermediate extents of hydration, “magic” numbers of water molecules attached occur (8, 11, and 14 water molecules). These magic numbers are indicative of an ordered structure or structures of water around the ion with unusually high stability. Yergey and co-workers have also reported magic number clusters for electrospray-generated hydrates of mono- and tetra-alkyl ammonium ions [3e]. However, no magic numbers were observed for the di-and tri-alkyl ammonium species. The authors suggest that the structures of the magic number clusters could correspond to exohedral structures in which the ion is located on the surface of a water cage. More recently, Beauchamp and co-workers reported the results of solvent evaporation studies on extensively hydrated peptides and primary amines generated by electrospray ionization [3f]. Even more extensively hydrated ions were generated for gramicidin S and magic numbers were again observed at 8, 11, and 14 waters. An additional magic number was also observed at 40 waters molecules. The authors assigned this to a structure in which each one of the two protonated ornithine residues side chains is incorporated as part of pentagonal dodecahedron clathrates. Fenn and co-workers have also observed magic numbers for gramicidin S at n = 8, 11, and 14 [6a].
There are two possible mechanisms for formation of these hydrated ions by ESI. First, condensation of solvent onto unsolvated or minimally solvated ions can occur in the expansion that takes place inside the ESI interface. Second, hydrated ions can be formed by solvent evaporation from an even more extensively hydrated ion or electrospray droplet [7]. From the standpoint of gas-phase ion structure, the difference in these mechanisms is significant only if the final hydrated ion structure is under kinetic control. Such may be the case for large biomolecule ions which can have complex potential energy surfaces and folding pathways. If ions are formed by solvent evaporation under sufficiently gentle conditions, ions that are in a global minimum on the solution-phase potential energy surface may be trapped in a local minimum on the gas-phase (unsolvated) potential energy surface. This local minimum may be one in which the ion retains elements of the solution-phase structure. This could occur even if this structure is not the most stable one in the gas phase.
Extensive evidence indicates that gas-phase biomolecule ions can adopt different conformations in the gas phase [8]. However, the relationship between gas-phase and solution-phase conformations is not well understood. A few years ago, Covey and Douglas [8a] reported collision cross sections for a series of gas-phase protein ions generated by ion spray. Cytochrome c ions obtained from aqueous solutions showed smaller cross sections than ions formed from solutions with a higher organic content. The more compact structure observed for ions of aqueous origin suggested that these gas-phase ions may retain some memory of their solution conformation. Similar results have been reported by Jarrold and co-workers [8b] and Clemmer and coworkers [8c] from ion mobility experiments. Loo and Smith [8d] have used proton transfer reactions between electrospray-generated proteins and neutral amines to probe the relationship between solution and gas-phase structure. No differences in reactivity were observed between proteins obtained from different solution conditions, suggesting that solution conformational differences were not retained under the electrospray conditions used. In contrast, Gross et al. [8e] found significant differences in proton transfer reactivity between disulfide intact and disulfide reduced lysozyme that were attributable to differences in ion conformation. More recently, blackbody infrared radiative dissociation (BIRD) experiments [8f] demonstrated that holomyoglobin ions, which dissociate by loss of the charged heme group, have different rate constants for dissociation when these ions are formed from solutions of different composition. These results show that ions can retain memory of their solution-phase conformation, i.e., these ions do not isomerize to a common structure in the gas phase. BIRD experiments on double-stranded oligonucleotide anions [8g], also indicate that some elements of solution structure, such as Watson–Crick base pairing and base stacking can be retained in the gas phase.
Here, the hydration of several ions formed by ESI is investigated. Evidence that the hydrated ions can be formed by both solvent condensation on bare ions as well as solvent evaporation from a more highly hydrated cluster is presented. These results suggest that the gas-phase ion structure of hydrated ions can be determined by studying the solvent evaporation from an extensively hydrated ion or droplet.
Experimental
All temperature dependence experiments were performed in a modified HP5989x quadrupole mass spectrometer equipped with a home-built ESI source (Figure 1). Ions are generated at atmospheric pressure and are introduced to the electrospray interface through a 0.5 mm i.d. stainless steel heated capillary (12 cm length; 15–20 V). A potential of 15–25 V is applied to a focusing stainless steel tube lens located at the end of the capillary. Two skimmers with 1.0 and 2.0 mm orifices (skimmer 1 and 2, respectively) separate two differentially pumped stages. Voltages applied to skimmer 1 and 2 are 10–15 and 5–10 V, respectively. Ions from the source are guided into a quadrupole mass analyzer through a 29.2 cm long octopole ion guide (2.0 MHz, 60 Vpk–pk, 0 V dc offset). The detection assembly consists of a high energy dynode (HED, −10.5 kV) and a channel electron multiplier (CEM, −2.0 kV).
Figure 1.
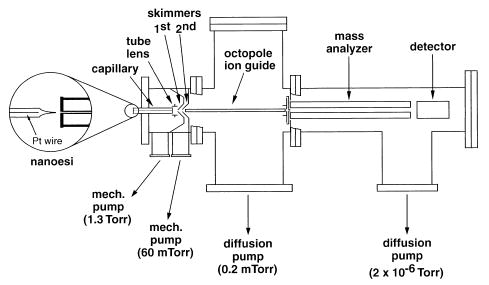
Modified HP 5989x quadrupole mass spectrometer equipped with a home-built ESI source and octopole ion guide.
All solutions, with the exception of heptylamine, were introduced to the instrument using nanoelectrospray capillary tips. Aluminosilicate tubing (1.0 mm o.d., 0.68 mm i.d.) is obtained from Sutter Instrument (Novato, CA) and nanoelectrospray tips are made using a Flaming/Brown Type Patch Micropipette Puller (Model P-87, Sutter Instrument, Novato, CA). Final capillaries are 5 cm long and have tips that taper to ~10 μm i.d. Electrical contact to the solution is established by inserting a Pt wire (0.127 mm diameter, Aldrich) and applying a voltage of 1.0–1.2 kV. The distance between the capillary tip and the entrance of the mass spectrometer is approximately 1 mm. Flow rates typically range from 10 to 60 nL/min.
ESI spectra of heptylamine were obtained using a flow rate of 0.35 μL/min which was controlled by a syringe pump (Harvard Apparatus Model 22, South Natick, MA). Solutions were introduced through a fused silica capillary (100 μm i.d., 350 μm o.d.)/aluminum clad silica tubing (100 μm i.d.) assembly. A voltage of 3.9 kV was applied and the distance between the electrospray needle and the entrance to the source was approximately 5 mm. Atmospheric pressure chemical ionization (APCI) spectra of heptylamine (M + H + nH2O)+ and H3O+(H2O)n ions were obtained using the same electrospray setup but the applied voltage on the capillary was increased to 5.0 kV. No solution is used for the APCI experiments.
All solutions were prepared at a concentration of 1 × 10⁻⁴ M in 100% H2O or CH3OH. No acid was added. Samples were obtained from Aldrich (Milwaukee, WI) or Sigma (St. Louis, MO) and were used without further purification. The gramicidin S (GS) analog, [Orn(Me3+)2,2′]GS, was synthesized following a previously reported method [9]. Briefly, CH3I (32 mmol) and KHCO3 (10 mmol) were added to a solution of GS · 2HCl (10−4 M) in methanol (20 mL). After stirring the mixture for 48 h, the KHCO3 precipitate was removed by filtration. The remaining solution was evaporated to dryness to obtain the trimethylammonium derivative of GS. No further purification steps were performed. An ESI mass spectrum of the product indicated that derivatization of the initial sample was complete.
Ion trapping experiments were performed using a home-built ESI-Fourier transform mass spectrometer (FTMS) that has been described previously [10]. Cluster ions were introduced to the cell for 1.5–2.0 s and collisionally trapped with N2(g) up to a pressure of 1.5 × 10⁻⁶ torr. Ions were isolated using SWIFT and single frequency excitation pulses. In two different types of experiments, both the whole distribution of hydrates and individual hydrated ions were allowed to dissociate in the cell at pressures of (5–7) × 10−9 torr and a temperature of 25 °C.
Calculations were performed using the Insight II v.4.0.0 molecular modeling package (Biosym Technologies, San Diego, CA). Structures are generated after 0.3 ns of a dynamics/minimization cycle algorithm (annealing process) using Discover v.2.9 with the CFF91 force field. After multiple cycles of the algorithm, several structures are generated, and all structures with energies that are within 5 kcal/mol of the lowest energy structure are saved.
Results and Discussion
Gramicidin S
Figure 2a shows a mass spectrum of gramicidin S (GS) formed from a 1 × 10⁻⁴ M aqueous solution using nanoelectrospray and “gentle” ESI interface conditions. Hydrated doubly protonated molecular ions are observed with over 50 water molecules attached. Although extensively hydrated ions can be readily formed using “standard” electrospray (flow rates ~1–5 μL/min), nanoelectrospray has the advantage that the spectra are more reproducible and extensively hydrated ions can be more readily produced. The same “magic” numbers (8, 11, and 14 water molecules) previously observed at intermediate extents of hydration with standard ESI are also observed using nanoelectrospray.
Figure 2.
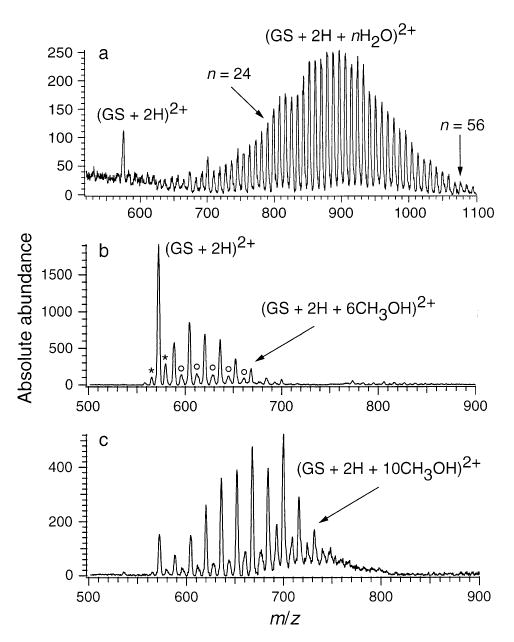
(a) ESI mass spectrum of gramicidin S (M + 2H + n H2O)2+ ions obtained from an aqueous solution; ESI mass spectra of gramicidin S obtained from a MeOH solution at (b) high and (c) low inlet capillary temperatures. Asterisk indicates impurities 14 Da above and below the mass of gramicidin S. Second distribution (open circles) is due to mixed methanol/water clusters on gramicidin S and/or the impurities.
Ions that have other solvent molecules attached can also be readily formed. For example, Figure 2b,c shows mass spectra of GS electrosprayed from 100% methanol at two different heated metal capillary temperatures. Primarily (M + 2H + nCH3OH)2+ ions are formed, but a less abundant distribution is also observed which corresponds to methanol attachment to GS impurities (asterisk) and also water/methanol mixed clusters (open circles). We are not able to resolve the latter two ion series on this instrument. Figure 2c shows the maximum extent of methanol attachment that could be obtained under any of the conditions tested. In contrast to the 50+ water molecules that can be readily attached to GS (Figure 2a), only a maximum of about 11 methanol molecules can be attached under comparable conditions. The (GS + 2H + 8CH3OH)2+ ion is observed in higher abundance relative to the adjacent solvated ions as also occurs with water. The expected sites of protonation in GS are the two primary amine groups of the ornithine residues. These results suggest that the eight solvent molecules are interacting primarily with these two charge sites. The significantly higher extents of solvent attachment possible for water is consistent with the ability of water to participate in a greater number of hydrogen bond interactions compared to methanol. Water molecules in the highly hydrated clusters are likely forming hydrogen bonding networks to and along the surface of the peptide.
Molecular mechanics simulations of gramicidin S with 14 water molecules show multiple solvent molecules forming hydrogen bonded bridges extending from the charged ornithine residues to carbonyl oxygens in the backbone of the peptide (Figure 3). Other water molecules, although still interacting with the charged site, extend away from the peptide also through hydrogen bonds. Simulations of gramicidin S with methanol also show solvent bridges to the peptide backbone, but no extensive networks are observed (results not shown).
Figure 3.
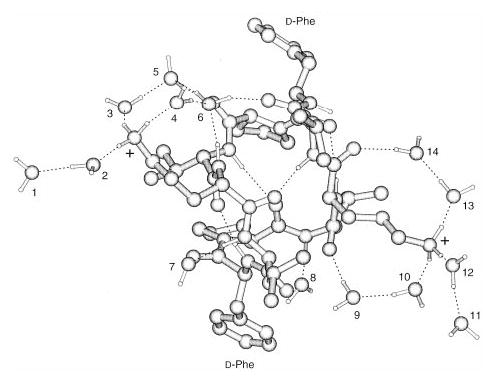
Representative low energy structure of gramicidin S (M + 2H)2+ ions with 14 water molecules obtained from molecular dynamics simulations. Hydrogen bonds are indicated with dashed lines; (plus) indicates the two charged sites (–NH3+) on the peptide; water molecules are numbered for clarity.
To elucidate the effect of the charged ornithine residues on the extent of solvent attachment, a GS analog in which the ornithine side chains, –(CH2)3N+H3, are changed to –(CH2)3N+(CH3)3 was synthesized. Figure 4a,b shows ESI mass spectra of GS and this trimethylammonium analog, [Orn(Me3+)2,2′]GS, respectively, measured under the same instrumental conditions. For GS, the unsolvated ion is only a minor peak; the most abundant ion corresponds to eight water molecules attached. In contrast, the base peak in [Orn(Me3+)2,2′]GS is the unsolvated ion. Under these conditions, GS attaches a maximum of 18 water molecules versus only 11 for [Orn(Me3+)2,2′]GS. Significant differences in the extent of hydration between GS and its analog are also observed at both higher and lower capillary temperatures. The reproducibility of the signal for hydrated ions obtained under similar experimental conditions is very good. Previous results with hydrated gramicidin S indicate that the relative error in signal intensity is less than 6% [3d]. The difference in the extent of hydration observed for GS and its analog is consistent with the decreased electrostatic interaction and the inability to form hydrogen bonds at the charge sites in [Orn(Me3+)2,2′]GS which greatly reduces the hydration energy of this ion.
Figure 4.
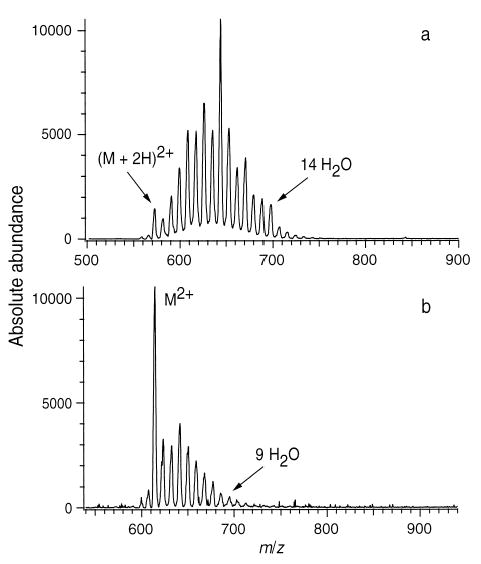
ESI mass spectra of (a) gramicidin S and (b) [Orn(Me3+)2,2′] GS, obtained from H2O solutions under the same experimental conditions.
Results on the solvation of primary and quaternary amines have been reported previously [3e, 11]. Meot-Ner and Deakyne [11a] measured the enthalpy change for the dissociation reactions of (CH3)4N+(H2O)n, for n = 1 and 2. They determined binding energy values of 9.0 and 9.4 kcal/mol for the first and second water molecule, respectively. Kebarle and co-workers [11b] studied the hydration of NH4+ and reported hydration energies of 17.3 and 14.7 kcal/mol for the first and second solvent molecule, respectively. The lower values measured by Meot-Ner and Deakyne are due to an absence of strong hydrogen bonds; the interaction between water and the quaternary amine is predominantly electrostatic. The results presented here confirm that the ornithine residues are the protonation sites in GS. No magic numbers are observed with the [Orn(Me3+)2,2′]GS under any of the experimental conditions used. If the n = 8, 11, and 14 magic numbers correspond to stable solvent structures around the charged ornithine groups and/or the surface of GS, then the inability to form such magic numbers for [Orn(Me3+)2,2′]GS indicates that hydrogen bonding to the primary amines is essential in order to stabilize those interactions.
Effects of Intramolecular Charge Solvation
The hydration of several different organic ions was also investigated. Electrospray mass spectra of 1,7 diaminoheptane, (Lys)3, and Lys-bradykinin at different heated capillary temperatures are shown in Figures 5–7. It should be noted that the temperatures reported for these mass spectra correspond to the temperature of a heated copper block inside the ion source (Figure 1). This temperature does not accurately reflect the temperature of the metal walls inside the capillary or that of the ions as they pass through the capillary. Both of these values are expected to be significantly lower than the temperature of the copper block. The temperature required to observe a given extent of hydration increases with extended ion source use, i.e., the time between cleaning the electrospray source. This presumably is due to coating of the inside of the inlet capillary with sample, which results in a reduction of the heat transfered to the sample.
Figure 5.
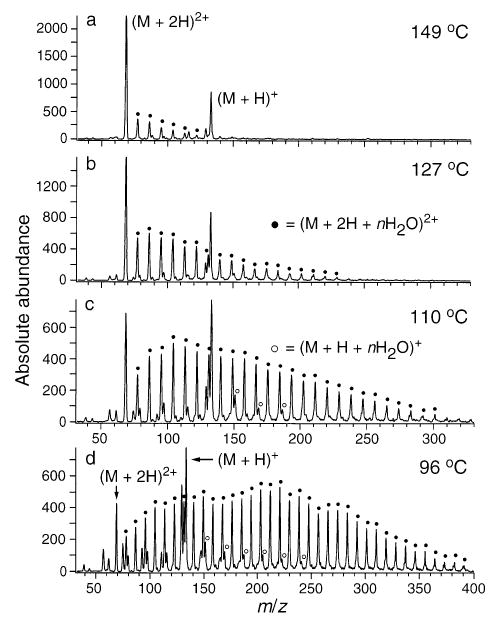
ESI mass spectra of 1,7-diaminoheptane obtained from an aqueous solution. Singly and doubly charged hydrated ion distributions are shown as a function of capillary temperature (marked on figure).
Figure 7.
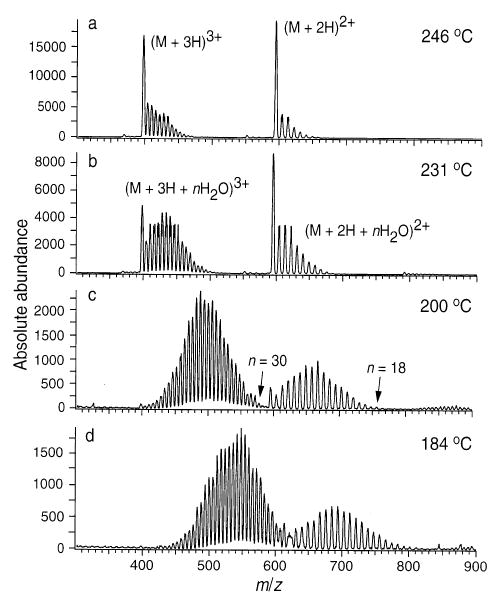
ESI mass spectra of Lys-bradykinin obtained from an aqueous solution. Doubly and triply charged hydrated ion distributions are shown as a function of capillary temperature (marked on figure).
For 1,7-diaminoheptane (Figure 5), a higher extent of hydration is observed for the 2+ than for the 1+ ion. For example, at 110 °C (Figure 5c), hydrated (M + 2H + nH2O)2+ ions are observed with n up to 24. However, only singly charged (M + H + nH2O)+ ions with n = 1–3 have significant abundance. These results are consistent with the higher binding energy of water to the doubly protonated ions due to effects of cyclization of the singly charged species (interaction of both terminal amino groups with the proton), and due to the increased electrostatic attraction. Kebarle and co-workers measured a −ΔG° = 5.6 kcal/mol for the binding energy of the first water of hydration (n = 1) on singly charged 1,7-diaminoheptane using equilibrium experiments [12]. For doubly charged 1,7-diaminoheptane ions, values of 8.0, 7.1, 5.9, and 5.3 kcal/mol for n = 3, 4, 5 and 6, respectively, were reported. Values for the first two waters of hydration on the doubly charged ion are considerably higher than 8.0 kcal/mol and were not determined.
Similar results are observed for both (Lys)3 and Lys-bradykinin. At 104 °C, the doubly protonated (Lys)3 ion has up to 33 water molecules attached, whereas solvation on the singly protonated ion is insignificant. This indicates that the protonation site in the singly charged ion is extensively solvated by intramolecular interactions. For Lys-bradykinin (Figure 7), however, the difference in solvation of the triply and doubly protonated charge states is less significant. At 200 °C, the triply protonated ion attaches up to 30 water molecules, whereas the doubly protonated ion attaches up to 18. This number of water molecules attached is roughly proportional to the charge state indicating the extent of intramolecular charge solvation in the triply and doubly protonated ions is similar.
How Are these Hydrated Ions Formed?
There are two possible mechanisms to form solvated ions by electrospray. Condensation on unsolvated or partially solvated gas-phase ions can occur during the expansion process that takes place inside the electrospray ionization source. Posey and co-workers [13] have taken advantage of this process to form a variety of solvated ions for subsequent characterization of their electronic properties by spectroscopy. Fenn and coworkers [6] have also demonstrated that solvated ions can be produced by condensation in an ESI source. Another possible mechanism is by evaporation of solvent from an even more extensively solvated ion or a small electrospray droplet [7]. In our earlier work [3d], we were unable to distinguish between these two mechanisms. Here, we provide evidence that both processes play a role in the formation of the solvated ions under our experimental conditions.
Condensation
Ions can be readily formed at atmospheric pressure by electrical discharge. Figure 8a shows a distribution of H3O+(H2O)n ions produced by atmospheric pressure chemical ionization (APCI) and introduced into the electrospray source of the mass spectrometer at a capillary temperature of 170 °C. The instrumental conditions are similar to those used for electrospray ionization. The electrical discharge was produced by applying a voltage to an aluminum clad fused silica capillary of the type often used for ESI. The distance between the fused silica capillary and the heated metal capillary was ~1 cm. In APCI, ions are initially produced by the electrical discharge and subsequent hydration readily occurs at atmospheric pressure. Figure 8b,c shows the calculated distributions of hydrated H3O+(H2O)n ions expected under thermal equilibrium both at 170 and 25 °C, respectively, and with a partial pressure of water equal to 10 Torr [1b,e]. Initially, the distribution of hydrated ions outside the mass spectrometer should be close to that calculated at 25 °C (Figure 8c). This thermal distribution may be shifted somewhat inside the heated metal capillary (e.g., Figure 8b at 170 °C). We do not know the temperature inside the capillary, but it is presumably less than the 170 °C measured at the surrounding copper block. Thus, the distribution of hydrated ions under thermal conditions should be somewhere between those shown in Figure 8b,c.
Figure 8.
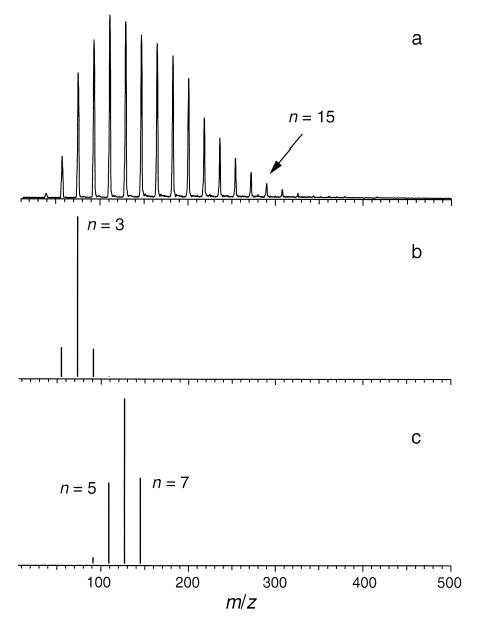
(a) Distribution of H3O+(H2O)n ions generated under atmospheric pressure chemical ionization conditions (APCI) at a heater block temperature of 170 °C. Expected thermal distribution of ions at (b) 170 and (c) 25 °C.
In contrast to the thermal distributions shown in Figure 8b,c, the measured distribution shown in Figure 8a is much broader and shows significantly more hydration. The more extensively hydrated ions observed in Figure 8a must be the result of condensation of water onto the ions occurring during the expansion that takes place inside the ESI source. The less extensively hydrated ions at n = 1–3 may reflect a thermal distribution at higher temperature or could be the result of collisionally activated dissociation of the more highly hydrated ions inside the electrospray ion source. The source conditions are similar to those used to observe hydrated clusters by ESI. Thus, condensation must play a role in the formation of the hydrated ions in the ESI mass spectra.
Solvent Evaporation
Two pieces of evidence indicate that condensation is not the only process involved in the formation of the hydrated ions observed in these electrospray mass spectra. Figure 9 shows two mass spectra of heptylamine measured under identical instrumental conditions but obtained using two different ionization methods. Figure 9a shows the results when heptylamine vapor is present at the APCI interface. This vapor is generated from an open reservoir of liquid heptylamine at room temperature located under the high voltage needle. Hydrated ions can be formed both by equilibrium with the atmospheric water vapor prior to the ions entering vacuum as well as by condensation inside the electrospray source. Figure 9b was obtained by electrospray ionization of an aqueous solution that is 1 × 10⁻⁴ M in heptylamine. The distribution of hydrated ions formed by electrospray is bimodal; the unsolvated ion has greater abundance than the n = 1 ion but the maximum hydration occurs at n = 3–7. In contrast, the APCI results show a continuous decrease in the abundance of the solvated ions. No conditions were found that resulted in the formation of a bimodal distribution such as that shown in Figure 9b using APCI. Similar bimodal distributions are typically observed in ESI mass spectra of multiply charged ions (see Figures 2, 5, and 6 for example). These results suggest that the bimodal distribution is due to the formation of solvated ions by two different processes. First, some ions with hydration given by the atmospheric equilibria enter the heated metal capillary and produce both the unsolvated ion and some of the hydrated ions by condensation. Other ions are likely entering the capillary with extents of hydration greater than that from ion equilibrium with water vapor. This would be the case if droplets formed by the ESI process entered the heated metal capillary. Solvent evaporation from these droplets could then produce the ions observed at the higher extents of hydration, and this results in a bimodal distribution.
Figure 9.
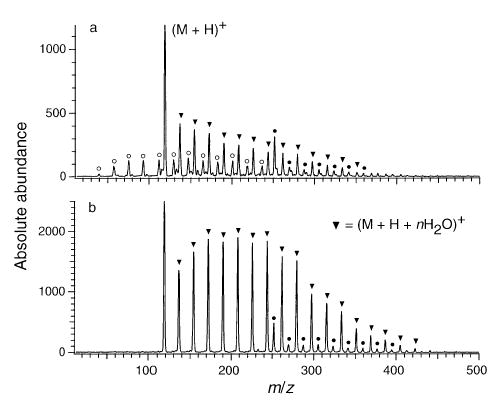
Mass spectra of heptylamine (M + H + nH2O)+ ions generated under (a) APCI and (b) ESI conditions. Temperature of the capillary was 170 °C for both experiments.
Figure 6.
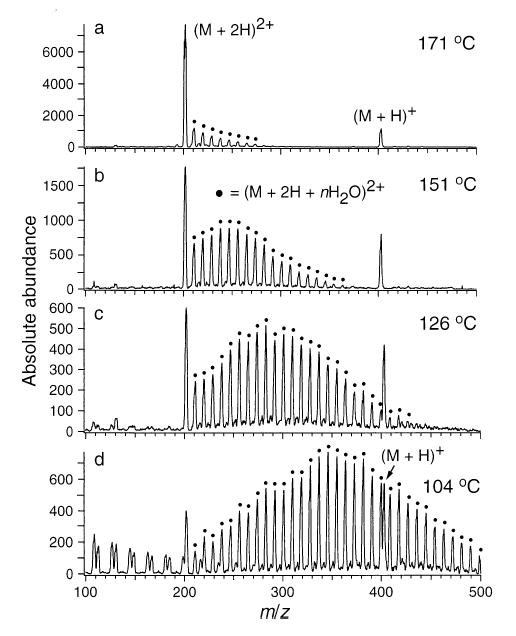
ESI mass spectra of (Lys)3 obtained from an aqueous solution. Singly and doubly charged hydrated ion distributions are shown as a function of capillary temperature (marked on figure).
It should be noted that a direct comparison of these APCI and ESI spectra is difficult because the partial pressure of water in these spectra is not identical. However, even with saturated water vapor [14] introduced around the discharge in the APCI experiment, no bimodal distribution of ions was observed under a wide range of experimental conditions. Interestingly, an unidentified ion at m/z = 251 in Figure 9 hydrates nearly identically when formed by either ionization method. This would suggest that the partial pressure of water in these two experiments does not differ significantly.
A second piece of evidence for evaporation of solvent from an extensively hydrated ion or droplet is the difference in relative abundances between the higher and lower charge states as a function of hydration. For 1,7-diaminoheptane, the ratio of the sum of abundances of all (M + 2H + n H2O)2+ ions to the abundance of all (M + H + nH2O)+ ions at 149 °C (Figure 5a) is 4.1. This ratio depends on several instrumental parameters. However, under identical instrumental conditions, this ratio increases to 6.5, 6.8, and 8.2 at capillary temperatures of 127, 110, and 96 °C, respectively. That is, the ratio of 2+ to 1+ ions is a factor of 2 larger under conditions of extensive hydration. Hydrated doubly protonated ions cannot be formed by condensation of water onto singly charged ions. Thus, some portion of the singly protonated ions formed at higher temperature (Figure 5a) are likely formed by evaporation of solvent and loss of charge from the extensively hydrated doubly protonated ions.
Similar results are observed for (Lys)3 and Lys-bradykinin. For (Lys)3, the ratio of 2+ to 1+ ions changes from 9.2 at 171 °C to 19.3 at 126 °C. For Lys-bradykinin, the ratio of 3+ to 2+ increases from 1.6 to 3.5 as the temperature is reduced from 246 to 200 °C. In each case, the ratio of higher to lower charge states is about a factor of 2 greater at higher extents of hydration.
These results do not appear to be due to instrumental mass discrimination. For 1,7-diaminoheptane, the mass of the hydrated doubly protonated ions at high temperature is lower than that of the singly protonated hydrated ions. At lower temperatures, however, the masses of the hydrated ions at these two charge states overlap and the majority of the ion signal for the 2+ ion is at higher mass. Similarly for (Lys)3, the mass range of the hydrated 2+ and 1+ ions overlap at higher temperatures. For Lys-bradykinin, these distributions do not overlap. To obtain a more quantitative comparison of these abundances, the instrumental mass discrimination would need to be characterized.
These results are consistent with the proposed mechanism for the maximum number of charges that can be retained by an ion formed by electrospray ionization [15]. In this mechanism, the maximum charge state is determined by the relative gas-phase proton transfer reactivity of the ion and solvent. Coulomb repulsion between like charges in an extensively solvated ion should be less than that in an unhydrated ion due to electrostatic shielding provided by the surrounding solvent molecules. Thus, extensively hydrated ions should be able to retain more charges than unsolvated ions. As the solvent evaporates from the ion, excess charge should partition between the ion and the departing solvent molecules based on their relative proton transfer reactivity. Towards the latter stages of this process, the charge partitioning will be determined by the relative gas-phase proton transfer reactivity of the respective species. Solvent clusters have higher gas-phase basicity than do individual solvent molecules [2a, 16]. Therefore, loss of a solvent cluster from a hydrated ion can result in the formation of even lower charge states.
Energetic collisions can drive proton transfer reactions over a barrier. More energy is available at higher capillary temperatures and may drive conversion of 2+ to 1+ ions by proton transfer to solvent molecules via collisions. This may partially explain the conversion of higher to lower charge states at higher capillary temperatures. This has been proposed as a mechanism for the production of lower charge state ions in ESI [8d]. However, under the conditions of this experiment, solvent is still attached to some of the doubly protonated ions at the highest temperatures used. This suggests that collisions are not sufficiently energetic under these conditions to drive proton transfer reactions over large barriers.
Low Pressure Solvent Evaporation Studies
The solvent evaporation process can be studied independently by storing hydrated ions in a trap and measuring spectra as a function of ion storage time. This is illustrated in Figure 10, which shows hydrated GS ions that have been trapped in a FTMS for up to 12 s. Injection of ions for 2.0 s with only a 2 ms reaction delay results in the distribution shown in Figure 10a. Magic numbers of hydration are observed at n = 8, 11, and 14 as observed previously. Also apparent is the stability of the even hydration numbers 2, 4, and 6. With increasing storage time (Figure 10b–e), water molecules evaporate until only unsolvated ions are observed after 12 s.
Figure 10.
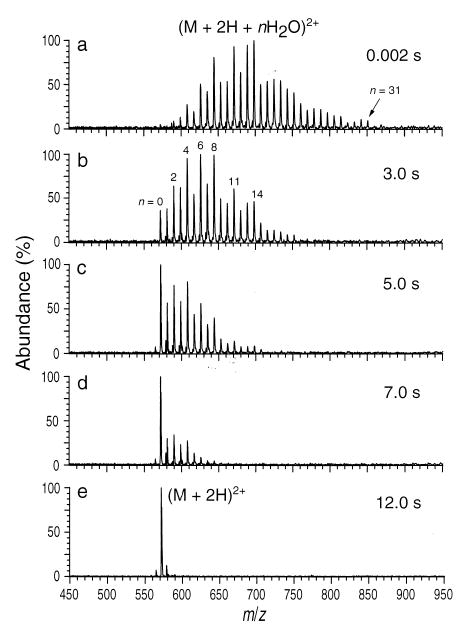
ESI-FTMS spectra of gramicidin S obtained from an aqueous solution. Ion load time is 2.0 s. (M + 2H + nH2O)2+ ion distributions are shown as a function of storage time in the cell at a temperature of 25 °C.
In another experiment, hydrated ions were isolated and allowed to dissociate at room temperature in the FTMS cell. Figure 11 shows the isolation and dissociation of (GS + 2H + 8H2O)2+ as a function of storage time. The sequential loss of neutral water molecules was the only process observed, indicating that the loss of water dimer or trimer does not occur. Isolation and dissociation of n = 11 and 14 also result in the sequential loss of individual water molecules indicating that loss of water trimer does not contribute to the formation of the hydrated magic numbers at n = 8 and 11. This result was confirmed by continuously ejecting a single n − 1 hydrated ion while monitoring the evaporation process of n. No (n − 3) ions were observed.
Figure 11.
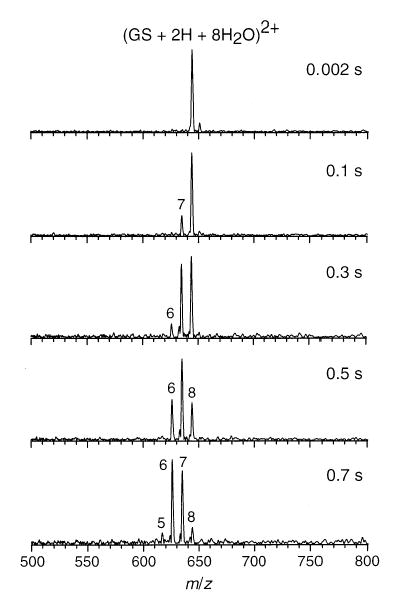
Mass spectra of (GS + 2H + 8H2O)2+ as a function of reaction time inside the ion cell. Cell temperature is 25 °C.
The stability of the observed magic numbers at n = 2, 4, 6, 8, 11, and 14 was probed by comparing their rates of dissociation at room temperature. Figure 12 shows depletion curves for (GS + 2H + nH2O)2+ ions, where n = 5–8. Hydrated magic number ions n = 6 and 8 react at a slower rate than n = 5 and 7, indicating a higher degree of stability. The inset shows a graph of dissociation rate constants as a function of n. The magic number ions have slower rates constants than those of nonmagic number ones, although the ions at n = 13 and 14 lose water at very similar rates. This is consistent with the relatively high abundance of n = 13 in the evaporation spectra (Figure 10a,b). As expected, the reaction rate constants show an increasing trend as the number of water molecules increases, consistent with the additional water molecules being less strongly bound. Under these experimental conditions, ions are activated primarily by absorption of blackbody photons (25 °C). Cooling the chamber to lower temperatures should increase the lifetime of these hydrated ions and make possible measurement of binding energies by blackbody infrared radiative dissociation experiments.
Figure 12.
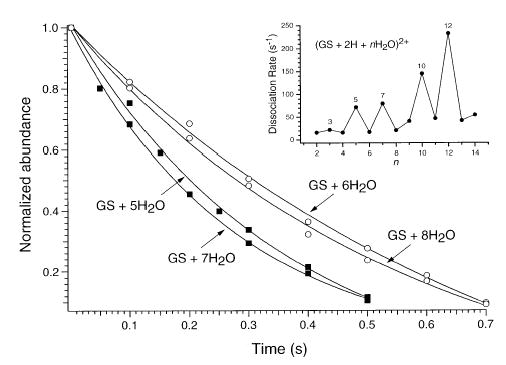
Depletion curves for the dissociation of (GS + 2H + nH2O)2+ ions, where n = 5–8, measured at 25 °C. Inset: graph of dissociation rate constants as a function of n, for n = 2–14.
Electrospray Ionization Mechanism
It should be noted that the evidence for solvent evaporation from an extensively hydrated ion or droplet does not indicate that the ion evaporation model [17] in electrospray ionization does not occur. It does indicate, however, that if ions are formed by an ion evaporation mechanism, the resulting ions that are desorbed from the electrospray droplet are likely to be hydrated, perhaps sufficiently so that they have solution-phase structures (same structures as those prior to desorption from the droplet). If this is the case, then the solvent evaporation process will dictate changes from the structure of the ion in solution to the final structure of the ion in the gas phase. If the desolvation process is sufficiently gentle, then many aspects of solution-phase structure should be maintained in the gas phase. Thus, from an ion structural standpoint, it should make little if any difference whether ions are formed by a charge residue or an ion evaporation mechanism. Solvent evaporation would dictate structural changes that occur in transferring an ion from solution into the gas phase.
Conclusions
Extensively solvated ions can be readily produced by electrospray ionization. For doubly protonated gramicidin S, attachment of solvent at intermediate extents of solvation appears to be predominately due to charge solvation or electrostatic interactions. For hydrated clusters with more than four water molecules per charge, hydrogen bonding appears to play a dominant role. For extensively hydrated ions, molecular modeling results indicate that water forms hydrogen bonding networks along the surface of the peptide.
The distribution of hydrated ions formed by electrospray ionization is consistent with their formation by two mechanisms. Solvent condensation clearly occurs in the expansion of the electrospray interface under these experimental conditions. However, this does not appear to be the only way that these ions are formed. Two pieces of evidence suggest that some of these hydrated ions are the result of solvent evaporation from extensively hydrated ions or electrospray droplets. First, the hydration of heptylamine ions formed by atmospheric pressure chemical ionization differs from the observed hydration of these ions by electrospray ionization. The latter shows a bimodal distribution of solvation which can be rationalized by the hydrated ions being formed by both mechanisms. Second, under conditions of extensive hydration, the ratio of the sum of the abundance of higher to lower charge state ions is greater than at lower extents of hydration. These results are consistent with a solvent evaporation model in which charge is partitioned between the ion and departing solvent molecules. These results also suggest that some fraction of the higher charge state ions that are extensively hydrated could be formed by solvent evaporation from an even more extensively solvated ion or from an electrospray droplet.
Extensively hydrated gas-phase biomolecule ions can be readily produced with a sufficient number of water molecules attached that they should have solution-phase structures. This indicates that the change from the solution-phase structure to the preferred structure in the gas phase can be probed by studying the evaporation of water from extensively hydrated clusters. Such experiments can be readily done in ion trapping instruments and should make possible the elucidation of the role of water in biomolecule ion structure and conformation.
Acknowledgments
The authors acknowledge the financial support provided by the National Science Foundation (grant no. CHE-9726183) and the National Institutes of Health (grant no. IR29GM50336-01A2).
References
- 1.a Kebarle P, Haynes RN, Collins JG. J Am Chem Soc. 1967;89:5753–5757. [Google Scholar]; b Kebarle P, Searles SK, Zolla A, Scarborough J, Arshadi M. J Am Chem Soc. 1967;89:6393–6399. [Google Scholar]; c Good A, Durden DA, Kebarle P. J Chem Phys. 1970;52:222–229. [Google Scholar]; d Meot-Ner (Mautner) M, Field FH. J Am Chem Soc. 1977;99:998–1003. [Google Scholar]; e Lau YK, Ikuta S, Kebarle P. J Am Chem Soc. 1982;104:1462–1469. [Google Scholar]; f Holland PM, Castleman AW., Jr J Chem Phys. 1980;72:5984–5990. [Google Scholar]; g Yang W, Castleman AW., Jr J Am Chem Soc. 1989;111:6845–6846. [Google Scholar]; h Dalleska NF, Honma K, Armentrout PB. J Am Chem Soc. 1993;115:12125–12130. [Google Scholar]; i Khan A. Chem Phys Lett. 1994;217:443–450. [Google Scholar]; j Schindler T, Berg C, Niedner-Schatteburg G, Bondybey VE. Chem Phys Lett. 1996;250:301–308. [Google Scholar]
- 2.a Keese RG, Castleman AW., Jr J Phys Chem Ref Data. 1986;15:1011–1071. [Google Scholar]; b Blades AT, Jayaweera P, Ikonomou MG, Kebarle P. Int J Mass Spectrom Ion Processes. 1990;101:325–336. [Google Scholar]; c Blades AT, Jayaweera P, Ikonomou MG, Kebarle P. Int J Mass Spectrom Ion Processes. 1990;102:251–267. [Google Scholar]; d Jayaweera P, Blades AT, Ikonomou MG, Kebarle P. J Am Chem Soc. 1990;112:2452–2454. [Google Scholar]; e Klassen JS, Blades AT, Kebarle P. J Am Chem Soc. 1994;116:12075–12076. [Google Scholar]; f Watanabe H, Iwata S, Hashimoto K, Misaizu F, Fuke K. J Am Chem Soc. 1995;117:755–763. [Google Scholar]; g Beyer M, Berg C, Gorlitzer HW, Schindler T, Achatz U, Albert G, Niedner-Schatteburg G, Bondybey VE. J Am Chem Soc. 1996;118:7386–7389. [Google Scholar]; h Castleman AW, Jr, Bowen KH., Jr J Phys Chem. 1996;100:12911–12944. and references therein. [Google Scholar]
- 3.a Chowdhury SK, Katta V, Chait BT. Rapid Commun Mass Spectrom. 1990;4:81–87. doi: 10.1002/rcm.1290040305. [DOI] [PubMed] [Google Scholar]; b Smith RD, Light-Wahl KJ. Biol Mass Spectrom. 1993;22:493–501. doi: 10.1002/bms.1200220203. [DOI] [PubMed] [Google Scholar]; c Stewart II, Horlick G. Trends Anal Chem. 1996;15:80–90. [Google Scholar]; d Rodriguez-Cruz SE, Klassen JS, Williams ER. J Am Soc Mass Spectrom. 1997;8:565–568. doi: 10.1016/S1044-0305(99)00068-9. [DOI] [PMC free article] [PubMed] [Google Scholar]; e Nguyen VQ, Chen XG, Yergey AL. J Am Soc Mass Spectrom. 1997;8:1175–1179. [Google Scholar]; f Lee SW, Freivogel P, Schindler T, Beauchamp JL. J Am Chem Soc. 1998;120:11758–11765. [Google Scholar]
- 4.a Klassen JS, Blades AT, Kebarle P. J Phys Chem. 1995;99:15509–15517. [Google Scholar]; b Woenckhaus J, Mao Y, Jarrold MF. J Phys Chem B. 1997;101:847–851. [Google Scholar]; c Woenckhaus J, Hudgins RR, Jarrold MF. J Am Chem Soc. 1997;119:9586–9587. [Google Scholar]
- 5.(a) Rupley, J. A.; Careri, G. Advances in Protein Chemistry; Academic: San Diego, 1991; pp 37–172. [DOI] [PubMed]; b Yang PH, Rupley JA. Biochemistry. 1979;18:2654–2661. doi: 10.1021/bi00579a035. [DOI] [PubMed] [Google Scholar]; c Hilton BD, Bryant RG. J Am Chem Soc. 1977;99:8483–8490. doi: 10.1021/ja00468a017. [DOI] [PubMed] [Google Scholar]; d Imoto T, Johnson LN, North ACT, Phillips DC, Rupley JA. Enzymes. 1972;7:665–868. [Google Scholar]; e Cox DJ, Schumaker VN. J Am Chem Soc. 1961;83:2439–2445. [Google Scholar]; f Doster W, Bachleitner A, Dunau R, Hiebl M, Lüsher E. Biophys J. 1986;50:213–219. doi: 10.1016/S0006-3495(86)83455-5. [DOI] [PMC free article] [PubMed] [Google Scholar]; g Steinbach PJ, Brooks BR. Proc Natl Acad Sci USA. 1993;90:9135–9139. doi: 10.1073/pnas.90.19.9135. [DOI] [PMC free article] [PubMed] [Google Scholar]
- 6.(a) Zhan, D.; Fenn, J. B. Proceedings of the 46th ASMS Conference on Mass Spectrometry & Allied Topics, May 31–June 4, 1998, p. 146. ; b Zhan D, Rosell J, Fenn JB. J Am Soc Mass Spectrom. 1998;9:1241–1247. [Google Scholar]
- 7.a Dole M, Mach LL, Hine RL, Mobley RC, Ferguson LP, Alice MP. J Chem Phys. 1968;49:2240–2249. [Google Scholar]; b Schmelzeisen-Redeker G, Bütfering L, Röllgen FW. Int J Mass Spectrom Ion Processes. 1989;90:139–150. [Google Scholar]; c Kebarle P, Tang L. Anal Chem. 1993;65:972A–986A. [Google Scholar]
- 8.a Covey T, Douglas DJ. J Am Soc Mass Spectrom. 1993;4:616–623. doi: 10.1016/1044-0305(93)85025-S. [DOI] [PubMed] [Google Scholar]; b Shelimov KB, Clemmer DE, Hudgins RR, Jarrold MF. J Am Chem Soc. 1997;119:2240–2248. [Google Scholar]; c Counterman AE, Valentine SJ, Srebalus CA, Henderson SC, Hoaglund CS, Clemmer DE. J Am Soc Mass Spectrom. 1998;9:743–759. doi: 10.1016/S1044-0305(98)00052-X. [DOI] [PubMed] [Google Scholar]; d Loo RRO, Smith RD. J Am Soc Mass Spectrom. 1994;5:207–220. doi: 10.1016/1044-0305(94)85011-9. [DOI] [PubMed] [Google Scholar]; e Gross DS, Schnier PD, Rodriguez-Cruz SE, Fagerquist CK, Williams ER. Proc Natl Acad Sci USA. 1996;93:3143–3148. doi: 10.1073/pnas.93.7.3143. [DOI] [PMC free article] [PubMed] [Google Scholar]; f Gross DS, Zhao YX, Williams ER. J Am Soc Mass Spectrom. 1997;8:519–524. doi: 10.1016/S1044-0305(97)00010-X. [DOI] [PMC free article] [PubMed] [Google Scholar]; g Schnier PD, Klassen JS, Strittmatter EF, Williams ER. J Am Chem Soc. 1998;120:9605–9613. doi: 10.1021/ja973534h. [DOI] [PMC free article] [PubMed] [Google Scholar]; h Wood TD, Chorush RA, Wampler FM, Little DP, O’Connor PB, McLafferty FW. Proc Natl Acad Sci USA. 1995;92:2451–2454. doi: 10.1073/pnas.92.7.2451. [DOI] [PMC free article] [PubMed] [Google Scholar]; i Wyttenbach T, Von Helden G, Bowers MT. J Am Chem Soc. 1996;118:8355–8364. [Google Scholar]; j Cassady CJ, Carr SR. J Mass Spectrom. 1996;31:247–254. doi: 10.1002/(SICI)1096-9888(199603)31:3<247::AID-JMS285>3.0.CO;2-L. [DOI] [PubMed] [Google Scholar]
- 9.Kawai M, Ohya M, Fukuta N, Butsugan Y, Saito K. Bull Chem Soc Jpn. 1991;64:335–341. [Google Scholar]
- 10.Gross DS, Williams ER. J Am Chem Soc. 1995;117:883–890. [Google Scholar]
- 11.a Meot-Ner (Mautner) M, Deakyne CA. J Am Chem Soc. 1985;107:469–474. [Google Scholar]; b Payzant JD, Cunningham AJ, Kebarle P. Can J Chem. 1973;51:3242–3249. [Google Scholar]
- 12.Klassen JS, Blades AT, Kebarle P. J Phys Chem. 1995;99:15509–15517. [Google Scholar]
- 13.Spence TG, Burns TD, Guckenberger VGB, Posey LA. J Phys Chem A. 1997;101:1081–1092. [Google Scholar]
- 14.A region of saturated water vapor around the APCI interface was generated by using a reservoir of boiling water below the high voltage needle.
- 15.a Schnier PD, Gross DS, Williams ER. J Am Chem Soc. 1995;117:6747–6757. [Google Scholar]; b Schnier PD, Gross DS, Williams ER. J Am Soc Mass Spectrom. 1995;6:1086–1097. doi: 10.1016/1044-0305(95)00532-3. [DOI] [PubMed] [Google Scholar]; c Schnier PD, Price WD, Williams ER. J Am Soc Mass Spectrom. 1996;7:972–976. doi: 10.1016/1044-0305(96)00071-2. [DOI] [PMC free article] [PubMed] [Google Scholar]; d Chillier X, Fr D, Monnier A, Bill H, Gülaçar FO, Buchs A, McLuckey SA, Van Berkel GJ. Rapid Commun Mass Spectrom. 1996;10:299–304. [Google Scholar]
- 16.Lias SG, Liebman JF, Levin RD. J Phys Chem Ref Data. 1984;13:695–808. [Google Scholar]
- 17.a Iribarne JV, Thomson BA. J Chem Phys. 1976;64:2287–2294. [Google Scholar]; b Fenn JB. J Am Soc Mass Spectrom. 1993;4:524–535. doi: 10.1016/1044-0305(93)85014-O. [DOI] [PubMed] [Google Scholar]


