Abstract
Guanylyl cyclase-activating proteins are EF-hand Ca2+-binding proteins that belong to the calmodulin superfamily. They are involved in the regulation of photoreceptor membrane-associated guanylyl cyclases that produce cGMP, a second messenger of vertebrate vision. Here, we investigated changes in GCAP1 structure using mutagenesis, chemical modifications, and spectroscopic methods. Two Cys residues of GCAP1 situated in spatially distinct regions of the N-terminal domain (positions 18 and 29) and two Cys residues located within the C-terminal lobe (positions 106 and 125) were employed to detect conformational changes upon Ca2+ binding. GCAP1 mutants with only a single Cys residue at each of these positions, modified with N,N′-dimethyl-N-(iodoacetyl)-N′-(7-nitrobenz-2-oxa-1,3-diazol-4-yl)ethylenediamine, an environmentally sensitive fluorophore, and with (1-oxy-2,2,5,5-tetramethylpyrroline-3-methyl)methanethiosulfonate, a spin label reagent, were studied using fluorescence and EPR spectroscopy, respectively. Only minor structural changes around Cys18, Cys29, Cys106, and Cys125 were observed as a function of Ca2+ concentration. No Ca2+-dependent oligomerization of GCAP1 was observed at physiologically relevant Ca2+ concentrations, in contrast to the observation reported by others for GCAP2. Based on these results and previous studies, we propose a photoreceptor activation model that assumes changes within the flexible central helix upon Ca2+ dissociation, causing relative reorientation of two structural domains containing a pair of EF-hand motifs and thus switching its partner, guanylyl cyclase, from an inactive (or low activity) to an active conformation.
Changes in intracellular [Ca2+] play a central role in the regulation of various physiological processes, either by the direct action of Ca2+ on effector enzymes, cation channels, and other proteins or, frequently, through processes mediated by Ca2+-binding proteins. These proteins are grouped into specific subfamilies based on their sequence similarity, mode of Ca2+ coordination, physiological function, and tissue and cellular distribution. Several hundred distinct Ca2+-binding proteins have been identified, an observation consistent with unique and diverse roles of Ca2+ in various cell types.
In recent years an interesting group of neuronal calcium-binding proteins (NCBP)1 (1, 2) (also known as neuronal calcium sensors (3)) was discovered and characterized to varying degrees. Better known members of this family include recoverin (4–10), hippocalcin (11–13), neurocalcin (14–17), frequenin (18–22), visinin (23, 24), guanylyl cyclase-activating proteins (GCAPs) 1–3 (2, 25), and guanylyl cyclase-inhibitory protein (26). NCBPs are 19–25-kDa proteins with four EF-hand motifs and are slightly larger than CaM (~17 kDa). NCBPs and CaM have a similar two-dimensional structure built around the EF-hand Ca2+-binding motifs, of which only two or three of four structural EF-hand elements are functional in various NCBPs. The extensions of the N-terminal and C-terminal regions provide additional structural elements distinct from CaM, and frequently these proteins are myristoylated at the N terminus. The function of these proteins has been intensely scrutinized by several laboratories, with the most detailed insights being gained from studies on the regulation of photoreceptor guanylyl cyclases (GCs) by GCAPs. In the dark (at high [Ca2+]), GC activity in the complex with GCAPs is low. Upon illumination when [Ca2+] declines, GCAPs in the Ca2+-free form stimulate GC activity up to 10-fold. This low [Ca2+] stimulation of GCs is one of the key events in the restoration of the dark state of photoreceptor cells (2, 27, 28).
The structure of recoverin was the first to be determined in Ca2+-bound (9) and Ca2+-free forms (10, 29). In contrast to the two lobes of CaM and a central α-helix, recoverin contains a short U-shaped inter-domain linker that positions the two domains in close contact with one another. This domain organization in recoverin produces a bi-lobed globular-shaped protein with pseudo C2 symmetry that is significantly different from CaM. Consequently, the root mean square deviation (RMSD) between the polypeptide chains of recoverin and CaM is ~10 Å. Although the binding of Ca2+ to recoverin produces a large rotation of the two lobes (RMSD = 9.6 Å), the C-terminal domain remains mostly unchanged. By contrast, binding of Ca2+ to the EF2- and EF3-hand motifs causes a prominent rearrangement of the N terminus and the extrusion of the N-terminal myristoyl group, termed the Ca2+-myristoyl switch, enabling recoverin to bind to membranes at high [Ca2+]. In contrast to recoverin, which binds only two Ca2+ ions, frequenin binds three Ca2+ ions at the EF2-, EF3-, and EF4-hand motifs (20, 21). The structural arrangements of this protein are similar to those of neurocalcin and recoverin (RMSD = 1.3–1.7 Å). Because of some changes in the orientation of one of the helices, frequenin contains a large hydrophobic crevice formed by 46 amino acids in the C-terminal lobe of unknown function (21). This protein has its myristoyl group exposed in both the Ca2+-bound and -free forms (20). Neurocalcin is a closely related homolog of frequenin with three functional EF-hand motifs (17) but is a more distantly related cousin to recoverin (RMSD = ~3.2 Å) and undergoes a conformational change similar to the “Ca2+-myristoyl switch” (17).
The structure of GCAP2 reveals that the four EF-hand motifs are arranged similarly to recoverin (RMSD 2.2 Å). GCAP1 and GCAP3, however, have not been amenable to structural studies, but based on computer predictions and biochemical studies, the EF-hand motifs can be assembled in three-dimensional configurations similar to GCAP2 but different from CaM and with the unique inhibitory role for the myristoyl group on GC at high [Ca2+] (2). Similarly to recoverin, the structure of GCAP1 is significantly altered in response to Ca2+ binding as determined using fluorescence methods (30), change in mobility during SDS-PAGE (25, 31), and proteolytic susceptibility (32). Binding of Ca2+ converts GCAP1 from an activator to an inhibitor of photoreceptor GC1 (32), with concomitant major conformational changes during this transition. GCAP1 is associated with membranes or with the particulate photoreceptor GCs at low and high [Ca2+] (31). The region around the EF3-hand motif, specifically Tyr99, becomes significantly more exposed to solvent in the Ca2+-free form of GCAP1. Limited proteolysis studies also indicate that the N terminus is exposed in Ca2+-bound and Ca2+-free forms (32). Interestingly, a point mutation in Tyr99 (Y99C) leads to the constitutive stimulation of GC even at high [Ca2+]. This phenotype is thought to be associated with elevated levels of cGMP in cones and autosomal dominant cone dystrophy in one British family (33–35).
GCAP1 has four endogenous Cys residues at positions 18, 29, 106, and 125 suitable for specific chemical modifications. Here, we used site-directed mutagenesis of these residues in combination with chemical modifications (Scheme 1) to examine the effect of Ca2+ binding on the stimulation of photoreceptor GC by GCAP1. We also used fluorescence and EPR spectroscopies to examine the nature of the conformational changes in GCAP1 and its mutants. We provide evidence that Ca2+ binding induces minor local changes around two C-terminal and N-terminal lobes, each containing two EF-hand motifs. In agreement with previous studies, we propose a photoreceptor GC activation model that assumes changes within the flexible central helix of GCAP1, causing relative reorientation of two structural domains and switching GCAP1 from the active to the inactive state.
Scheme 1. Modifications of sulfhydryls used in this study.
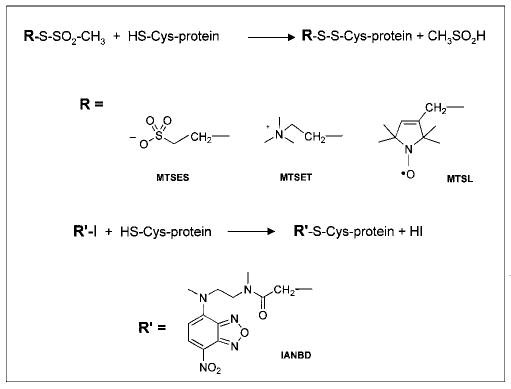
Upper lines, reaction schematics. R and R′ depict various side chains linked to Cys. Below, chemical formulas of the various reagents used.
EXPERIMENTAL PROCEDURES
GCAP1-His6 Expression Vector and Site-directed Mutagenesis
The bovine GCAP1 coding sequence was amplified by polymerase chainreaction with primers, which inserted a His6 tag before the stop codon. The resulting fragment was cloned into pPCR-Script bGCAP1-His6 Amp SK(+)(Stratagene). The transfer vector pVLGCAP1His was constructed by subcloning a NotI-BamHI fragment into corresponding sites of the pVL1392 insect cell vector (BD Pharmingen). The GCAP1 mutants were generated with the QuikChangeTM site-directed mutagenesis kit (Stratagene). The single mutants were generated with pVLGCAP1His as the template. The primers used are listed in Table I: C18S-s/C18S-a for GCAP1(C18S), C29G-s/C29G-a for GCAP1(C29G), C29N/D-s and C29N/D-a for GCAP1(C29D) and GCAP1(C29N), C29Y-s/C29Y-a for GCAP1(C29Y), C1096-s/C106S-a for GCAP1(C106S), and C125S-s/C125S-a for GCAP1(C125S). Double mutants were generated by using DNA of GCAP1(C18S) or GCAP1(C106S) as templates, and triple mutants were generated by using DNAs of double mutants as template. The Cys-less GCAP12 mutant GCAP1(C18S,C29N,C106S, C125S) (GCAP1(c−created using C29-GCAP1(c−) DNA as the template. The Ca2+-insensitive bGCAP1 (E75Q,E111Q,E155Q)-His6 was created with a similar approach, the primers used were E75Q-s/E75Q-a, E111Q-s/E111Q-a, and E155Q-s/E155Q-a. The clones and DNA samples were isolated by standard procedures, and the entire coding frames of GCAP1 and its mutants were verified by DNA sequencing.
Table I.
The list of GCAP1 mutagenesis primers
| Name | Sense | Antisense |
|---|---|---|
| C18S | 5′-CAGCACCGAGTCCCACCAGTGGTAC | 5′-GTACCACTGGTGGGACTCGGTGCTG |
| C29S | 5′-CATGACAGAGTCCCCCTCCGGCC | 5′-GGCCGGAGGGGGACTCTGTCATG |
| C29G | 5′-CATGACAGAGGGCCCCTCCGGCC | 5′-GGCCGGAGGGGCCCTCTGTCATG |
| C29N & C29D | 5′-CATGACAGAG(A/G)ACCCCTCCGG CC | 5′-GGCCGGAGGGGT(T/C)CTCTGTCATG |
| C29Y | 5′-CATGACAGAGTACCCCTCCGGCC | 5′-GGCCGGAGGGGTACTCTGTCATG |
| C106S | 5′-CGGCAACGGATCCATCGACCGCG AC | 5′-GTCGCGGTCGATGGATCCGTTGCCG |
| C125S | 5′-GCCATTAACCCCTCCAGCGACTCGACC | 5′-GGTCGAGTCGCTGGAGGGGTTAATGGC |
| E75Q | 5′-CATTGATTTCATGCAGTACGTGGC GG | 5′-CCGCCACGTACTGCATGAAATCAATG |
| E111Q | 5′-CGACCGCGACCAGCTGCTCACCA TC | 5′-GATGGTGAGCAGCTGGTCGCGGTCG |
| E155Q | 5′-CTCCCTAGAGCAGTTCATGGAGGG | 5′-CCCTCCATGAACTGCTCTAGGGAG |
Expression and Purification of Bovine GCAP1-His6 and Its Mutants
The baculovirus transfer vectors carrying GCAP1 and its mutants were purified by Qiagen plasmid kits. High Five insect cells from cabbage looper were cotransfected with 0.25 μg of BaculoGold (BD Pharmingen) DNA and 5 μg of transfer vector in 25-cm2 tissue culture flasks. After 4 days, the cells were harvested, pelleted, homogenized (in water containing protease inhibitor mixture -Complete (Roche Molecular Biochemicals)), and centrifuged (10 min at 4000 × g at 4 °C). The supernatant containing or its mutants was purified by GCAP1-His6 Ni2+-nitrilotriacetic acid metal affinity chromatography in nondenaturing conditions according to the manufacturer’s protocol (Qiagen). The proteins were purified to apparent homogeneity as determined by SDS-PAGE and Coomassie staining. In some experiments, GCAP1 and its mutants were further purified by gel filtration as described below.
GC Activity Assay
Fresh bovine eyes were obtained from a local slaughterhouse (Schenk Packing Company, Stanwood, WA). Washed ROS membranes were prepared as described previously (36), reconstituted with recombinant GCAPs, and assayed as described by Otto-Bruc et al. (37). [Ca2+] was calculated using the computer program Chelator 1.00 (38), and all assays were repeated at least twice. Although some data are shown without standard deviations, they are the averages of two determinations. Similar results were obtained from at least three different sets of experiments performed in duplicate. As a consequence of the high sensitivity of the GC system, the absolute values of one series occasionally varied from another by 10–20%, but with preservation of the ratio between the activity of two different preparations (for example, mutants of GCAP1).
Modification of GCAP1 Sulfhydryl Groups
Typically, 0.5 ml of protein (0.2 mg/ml) was dialyzed against 10 mm Hepes, pH 7.5, and then treated with a modifying reagent, MTSEA, MTSET, or MTSES (Anatrace) (stock solution was 50 mm in H2O; the final concentration in the sample was 100 μm). The reaction was allowed to proceed for 30 min at room temperature. Labeled protein was separated from nonreacted modifying reagents by dialysis or by Ni2+-nitrilotriacetic acid chromatography.
Ellman’s Assay for Determination of Sulfhydryls
Ellman’s reagent, 5,5′-dithio(2-nitrobenzoic acid) (DTNB; Sigma), reacts with sulfhydryl groups under slightly alkaline conditions to release the chromogenic compound 5-thio-2-nitrobenzoate, which absorbs at 412 nm with an absorption coefficient of 13,600 m−1 cm−1. The reaction of DTNB with native and modified forms of GCAP1 and its mutants was carried out either in 900 μl of guanidine hydrochloride (final concentration, 4 m), pH 8.0, or in 900 μl of 10 mm BTP, pH 8.0, containing 100 mm NaCl, 0.4 mm EDTA, and 156.25 μm to 390.6 μm CaCl2. The reaction was initiated by the addition of 50 μl of DTNB solution (final concentration, 1.8 mm). After spectrum stabilization, the reaction was initiated by the addition of 50 μl of GCAP1. The increase in absorbance was directly proportional to the concentration of free sulfhydryl groups in solution. Protein concentration was determined using the Bradford method (39).
Fluorescent Labeling and Fluorescent Spectroscopy
Purified protein (0.6 mg/ml, 1 mg) was mixed with 2 μl (100 mm) of IANBD (Molecular Probe, Eugene, OR). After 2 h of incubation at room temperature, the sample was ultracentrifuged (10 min at 100,000 × g at 4 °C) and loaded on a Ni2+-nitrilotriacetic acid column equilibrated with 50 mm Tris/HCl, pH 8.0, and 300 mm NaCl. Excess dye was removed by washing the column with the same buffer. Labeled protein was eluted from the column by 250 mm imidazole in 50 mm Tris/HCl, pH 8.0, and 300 mm NaCl, and protein was dialyzed against 50 mm Hepes, pH 7.8, and 60 mm KCl, 20 mm NaCl, and 10 mm MgCl2. In similar experiments, GCAP1 mutants modified by IANBD were repurified by Ni2+-nitrilotriacetic acid chromatography as described above. Fluorescent measurement of modified mutants was carried out on a PerkinElmer LS 50 B spectrofluorimeter using a 1 × 1-cm quartz cuvette. Emission spectra were recorded from 400 to 650 nm with excitation wavelength at 480 nm and 7.5-nm slit width. Spectra were determined in 50 mm Hepes, pH 7.8, and 60 mm KCl, 20 mm NaCl, 10 mmMgCl2, 0.4 mm EGTA, and156.25 or 390.6 μM CaCl2. [Ca23]free was calculated as noted previously. For IANBD, an extinction coefficient of 21,000 M−1 cm−1 at 481 nm was used to determine the concentration and stoichiometry of modification.
Site-directed Spin Labeling and EPR Spectroscopy
Purified GCAP1 mutants containing single Cys residues (typically ~100 μm) were incubated with a 3-fold molar excess of the sulfhydryl-specific nitroxide spin label (1-oxy-2,2,5,5-tetramethylpyrroline-3-methyl) methanethiosulfonate (Scheme 1; gift from Prof. K. Hideg) overnight at 4 °C in 50 mm Hepes, pH 7.8, 60 mm KCl, 20 mm NaCl, 10 mm MgCl2, and 0.4 mm EGTA buffer. Unreacted spin label was removed by repeated washing with the same buffer in Microcon centrifugal filters (Millipore Corporation, Bedford, MA). EPR spectroscopy was carried out on a Varian E109 X-band spectrometer fitted with a loop-gap resonator (40, 41). Protein samples of 6 mu;l were contained in Pyrex capillaries. Spectra were recorded using a 2 mW incident microwave power and 100 kHz field modulation. Collision rates of spin labels with oxygen in air were estimated using the power saturation technique as described previously (42).
Gel Filtration
GCAP1 or its mutants (~0.3 mg/ml, 250 μl) was loaded on Superdex 200 (Amersham Pharmacia Biotech), equilibrated with 10 mm BTP, pH 7.5, and 150 mm NaCl, 50 μm CaCl2 at a flow rate of 0.4 ml/min. In additional experiments, the CaCl2 concentration was 1 mm or substituted by 1 mm EDTA. Proteins were detected at 280 nm, 0.4-ml fractions were collected by SDS-PAGE, and an aliquot from each fraction was examined for the GC stimulatory (inhibitory) activity.
RESULTS
To obtain additional insight into the conformational changes of GCAP1 upon Ca2+ binding, we employed highly specific chemical modifications of Cys residues in combination with mutagenesis, fluorescence, and EPR spectroscopy. Bovine GCAP1 has four Cys residues. The first two, Cys18 and Cys29, are located at the N-terminal region. The last two are Cys106, which is a part of EF3-hand motif, and Cys125, which is located in the C-terminal lobe (Fig. 1, A and B). In the three-dimensional model of GCAP1, based on the x-ray structure of Ca2+-bound form of recoverin and the NMR structure of GCAP2 (Fig.1B), these four Cys are located in different regions of the protein and thus are ideally suited for reporting local changes upon Ca2+ binding. Two residues, Cys29 and Cys106 are present in the acidic part of GCAP1 containing EF-hand loops, whereas Cys18 and Cys125 are projecting toward the opposite ends of GCAP1 (Fig. 1B). GCAP1 does not contain disulfide groups. Only Cys29 is highly conserved among NCBPs, with the exception of GCAP3 (Fig. 1C). This suggests a special functional or structural role of Cys29 in GCAP1 and in corresponding positions of other NCBPs. Our experience with bacterially expressed GCAP1 was that the protein is marginally active or not active at all; therefore more time-consuming insect cell expression was required.
Fig. 1. The positions of Cys residues in the primary and three-dimensional structures of GCAP1.
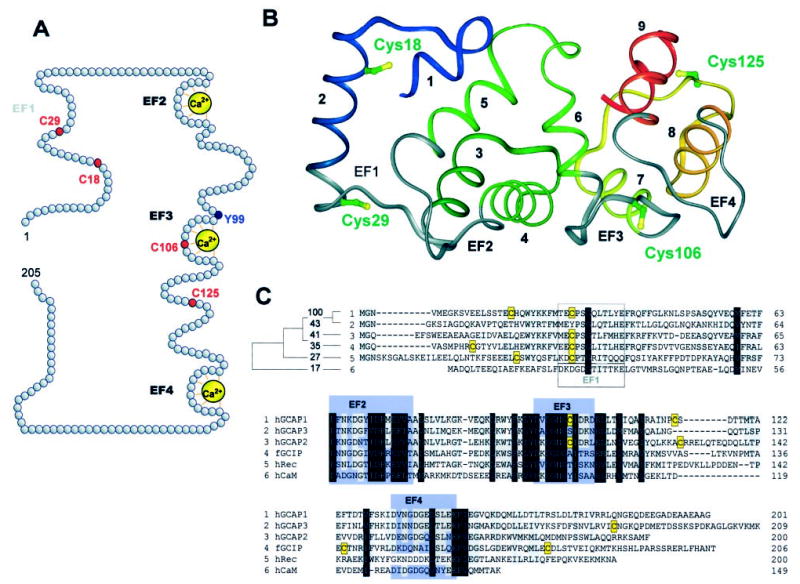
A, the location of Cys residues in the primary sequence of GCAP1 relative to Ca2+ loops. Ca2+ ions are marked in yellow, and the Tyr99 residue that has been shown to be associated with the autosomal dominant cone dystrophy when mutated to Cys (34) is shown in blue. The EF1-hand motif is nonfunctional in Ca2+ binding because of a lack of key residues important for the Ca2+ coordination. B, microenvironments of four Cys residues in native GCAP1. The ribbon representation of the protein is colored as follows: EF1- through EF4-hand motifs are in gray, and wild-type Cys residues are in green/yellow. The helices are numbered from the N to the C terminus and are rainbow colored. The model was generated based on the basis of the crystal structure of unmyristoylated recoverin (Protein Data Bank entry 1REC; Ref. 9) as described previously (30). Superposition of the structures from this group of Ca2+-binding proteins showed that the main chain atoms of unmyristoylated, Ca2+-bound GCAP2, recoverin, and neurocalcin fold into a similar structure. The root mean square deviation of the main chain atoms (in the EF-hand motifs) is 2.2 Å in comparing GCAP2 to recoverin and 2.0 Å in comparing GCAP2 to neurocalcin. C, sequence alignment of hGCAP1, hGCAP3, hGCAP2, hGCAP1, fGCIP, hRec, and hCaM. The Cys residues in GCAP1 and in other Ca2+-binding proteins are shown on a yellow background. Functional EF-hand motifs in GCAP1 and other proteins are shown in blue. EF1-hand motif is only functional in CaM. The accession numbers for Ca2+-binding proteins are given in parentheses: hGCAP1 (NP_000400), hGCAP3 (AAD19944), hGCAP2 (AF173229), fGCIP (AAC15878), hRec (NP_002894), hCaM (AC006536), and hFREQ (AF186409).
The Structural Integrity of GCAP1 and Its Mutants
Several complementary techniques were used to assess the properties and folding of GCAP1 and its mutants. First, recombinant bovine GCAP1 and all mutants with His6 tag were purified to apparent homogeneity, employing metal affinity chromatography (see “Experimental Procedures”). All purification procedures and preparation of ROS membranes were previously reported (1, 30–33, 37, 43, 44, 46–51). Addition of the His6 tag to the C-terminal region did not affect the GC-stimulating property of GCAP1 as compared with native GCAP1 (32). Second, the extent of myristoylation of recombinant GCAP1 was measured as described previously (33). Briefly, myristoylated GCAP1 and its mutants (identified by radioactive labeling employing [3H]myristic acid) have slightly faster mobility than unmyristoylated GCAP1 during SDS-PAGE (37). Quantitative evaluation by scintillation counting and protein determination revealed that GCAP1 and two other mutants were 70–91% acylated (33). All mutants show a similar degree of acylation as judged by SDS-PAGE (Fig. 2A). Third, intrinsic fluorescence was used to determine Ca2+-induced changes in CCAP1 and its mutants as described previously (30). An example of fluorescence changes are shown for GCAP1 and C18-GCAP1(c−) in Fig. 2B. All other mutants showed similar changes, suggesting that the structural integrity was preserved when the exposed Cys18, Cys106, and Cys125 and the buried Cys29 were replaced by Ser. Fourth, all GCAPs were extensively tested for the GC stimulation at low [Ca2+] (30 nm) and GC inhibition at high [Ca2+] (1 μm). All active mutants were tested for GC stimulation as a function of [Ca2+] (for example, see Fig. 3A). These are sensitive assays that most likely would discriminate between different forms of GCAP1 as presented below. Fifth, all mutants competed with the constitutively active triple mutant GCAP1(E75Q,E111Q,E155Q) (32) at high [Ca2+] (Fig. 2C), suggesting that the sites of GCAP1 mutants binding to GC are preserved and unchanged. Sixth, conformational changes in GCAP1 were measured as a function of [Ca2+] employing limited proteolysis (32). Each mutant was tested under these conditions, and common sets of proteolytic products were generated at low [Ca2+] (30 nm) and at high [Ca2+] (Fig. 2D). Seventh, thermal stability of the mutants was unaltered (Fig. 2 E), suggesting that their susceptibilities to heat are not modified as a consequence of mutations. Taken together, these extensive characterizations of GCAP1 and mutants indicate close similarity in overall structural properties for the wild-type GCAP1 and its mutants.
Fig. 2. Characterization of GCAP1 and its mutants.
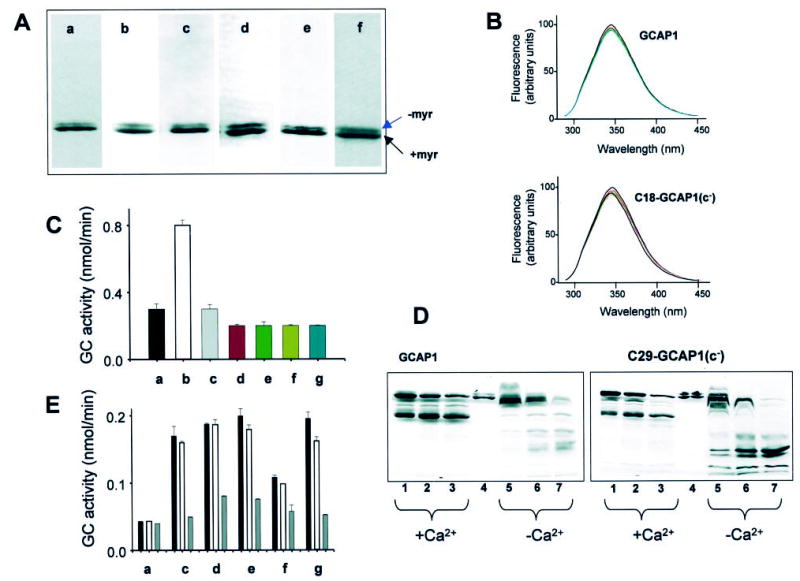
A, SDS-PAGE of GCAP1 (a) and most extensively used mutants in this study, C18-GCAP1(c−) (b), C29-GCAP1(c−) (c), C106-GCAP1(c−) (d), C125-GCAP1(c−) (e), and C29S-GCAP1 (f). Similar electrophoretic patterns were observed for other mutants. B, fluorescence emission spectra of GCAP1 and C18-GCAP1(c−). Fluorescence spectra (30) were measured as a function of [Ca2+], from 10−10 m (solid line) and at [Ca2+] = 10−6 m (red dashed line; [Ca2+] chosen as in Fig. 3). The emission spectra of GCAP1 and the mutant were recorded using λex =280 nm. There is no significant change in spectral shape for GCAP1 and C18-GCAP1(c−), both at 2 μm and atany [Ca2+]. Similarly, all other mutants showed only minor changes in their intrinsic fluorescence. The fluorescence titration was reproducible in two independent experiments for each mutant. C, competition assay of GCAP1 and mutants GCAP1(E75Q,E111Q,E155Q)(32) at high [Ca2+]. The GC activity was measured using washed ROS (a) in the presence of the constitutively active mutants (1 μg) at 2 μm [Ca2+] (b), and the presence of GCAP1 (c) (2 μg) and most extensively used mutants in this study, C18-GCAP1(c−) (d) (2 μg for this and other mutants), C29-GCAP1(c−) (e), C106-GCAP1(c−) (f), and C125-GCAP1(c−) (g). D, limited proteolysis of GCAP1 and C29-GCAP(c−) by trypsin. The digestion was carried out at 30 °C at a ratio of GCAP1s/trypsin 300:1, and the digest was analyzed by SDS-PAGE at 5 min (lanes 1 and 5), 10 min (lanes 2 and 6), and 16 min (lanes 3 and 7). +Ca2+represents 2 μm [Ca2+], and −Ca2+ indicates 30 nm [Ca2+]. Lane 4 represents undigested GCAP. All other mutants displayed similar digestion patterns, although the varied levels of the proteolytic fragments resulted from different amount of GCAP1 mutants in the assay. E, stability of GCAP1 and its mutants. The GC activity was measured using washed ROS as a source of GC (a) in the presence of 0.5 μg of GCAP1 (c) at 30 nm [Ca2+]. The black bar represents GCAP not exposed to heat treatment (open bar and gray bar), GCAP1 preincubated for 15 min at 50 °C or 100 °C, respectively. Other mutants C18-GCAP1(c−) (d), C29-GCAP1(c−) (e), C106-GCAP1(c−) (f), and C125-GCAP1(c−) (g) were treated in the similar conditions. The varied levels of the GC stimulating activity resulted from different amounts of GCAP1 mutants in the assays.
Fig. 3. Ca2+-dependent GC stimulatory activities of single and triple Cys mutants of GCAP1.
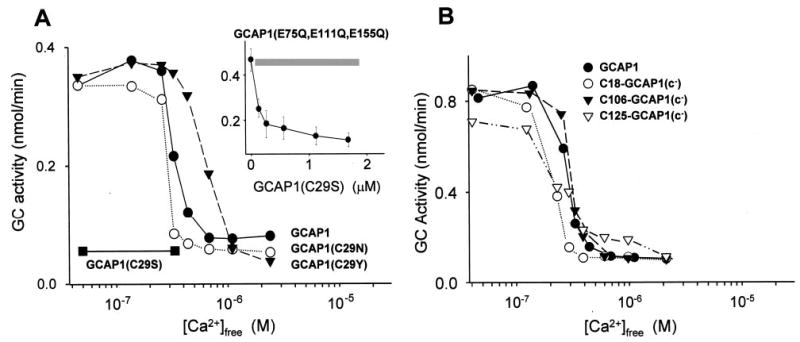
A, Ca2+-dependent ROS GC stimulatory activities of GCAP1 (•), GCAP1(C29N) (○), and GCAP1(C29Y) (▾). GCAP1(C29S) (▪) was inactive. Inset, competition of GCAP1(C29S) with Ca2+-insensitive GCAP1 mutant GCAP1(E75Q,E111Q,E155Q) at 2 μm [Ca2+]freeThe gray bar represents the range of GCAP1(E75Q, E111Q,E155Q) reference activity alone. The measurements were done in triplicate in these independent experiments, and the difference between them in IC50 did not vary more than 50 nm [Ca23] B, Ca2+-dependent GC stimulatory effects of triple mutants containing one Cys at positions 18,106, and 125, respectively. GCAP1 (•) is shown for comparison. The measurements were done in three independent experiments, and the difference between them in IC50 did not vary more than 35 nm [Ca2+].
Single Cys Mutants of GCAP1
Because GCAP1 has endogenous Cys residues at positions 18, 29, 106, and 125, three of four of these residues were eliminated by mutagenesis to study chemical reactivity of the individual Cys residues. First, Cys residues were individually mutated to Ser residues, which are nonreactive with Cys reagents. Single mutants of GCAP1 (C18S, C106S, and C125S), in which the Cys residue is replaced by Ser, are almost fully active (Table II), are expressed at high or moderate levels, and have Ca2+-dependent properties in stimulation and inhibition of photoreceptor GCs indistinguishable from native GCAP1 (data not shown). GCAP1(C29S) is inactive at low [Ca2+], suggesting that Ser at this position could be detrimental for proper folding of GCAP1 into an active conformation. To test whether this mutant binds to GCs, we stimulated GC with native GCAP1 at low [Ca2+] (Fig. 3A) or with the triple mutant GCAP1(E75Q,E111Q,E155Q) at high [Ca2+] (Fig. 3A, inset). Glu75, Glu111, and Glu155 are part of functional EF-hand motifs donating two oxygen atoms for the Ca2+ coordination from the last position of the binding loop and mutations to Gln disable the Ca2+ chelation. In both cases the mutant GCAP1(C29S) competitively inhibited GC stimulation by active forms of GCAP1. These results suggest that GCAP1(C29S) binds to GCs but is unable to undergo the conformational changes that will transform the mutant from an inhibitory to an activated form.
Table II.
Stimulation and inhibition of photoreceptors GCs by GCAP1 and its Cys mutants
| GCAP1 and mutants | Maximal activitya | Inhibition in high [Ca2+]freeb | Expression levelc |
|---|---|---|---|
| pmol/min | |||
| Single Cys mutants | |||
| GCAP1-control | 920 ± 120 | + | H |
| GCAP1(C18S) | 955 ± 90 | + | H |
| GCAP1(C29S) | 0 | + | L |
| GCAP1(C29N) | 810 ± 150 | + | L |
| GCAP1(C29G) | 0 | + | M |
| GCAP1(C29Y) | 815 ± 140 | + | M |
| GCAP1(C29D) | 0 | + | L |
| GCAP1(C106S) | 995 ± 90 | + | H |
| GCAP1(C125S) | 985 ± 70 | + | H |
| Double Cys mutants | |||
| GCAP1(C18S,C106S) | 910 ± 80 | + | H |
| GCAP1(C18S,C125S) | 855 ± 40 | + | M |
| Triple Cys mutants | |||
| C125-GCAP1(c− | 310 ± 120 | − | L |
| C106-GCAP1(c−) | 520 ± 130 | + | H |
| C29-GCAP1(c−) | 950 ± 210 | + | H |
| C18-GCAP1(c−) | 705 ± 125 | + | M |
| Cys-less GCAP1 mutant | |||
| GCAP1(c−) | 310 ± 200 | + | L |
The maximal activity was measured at saturating 4 μM GCAP1 (and its mutants) at 40 nm [Ca2+]free experimental conditions of the assay (“Experimental Procedures”). The variations in the maximal stimulating activities reflect differences in the intrinsic properties of GCAP1s rather than in modified affinities for GCs.
A qualitative comparison of the expression level GCAP1 mutants. H, high (>200 μg of purified GCAP1 or its mutants from 5 ×150-mm plate culture; M, moderate (50–200 μg of purified GCAP1 or its mutants from 5 ×150-mm plate culture; L, low (<50 μg of purified GCAP1 or its mutants from 5 ×150-mm plate culture). The expression of each mutant was reproduced at least four times.
A qualitative comparison of the activity of GCAP1 mutants measured in 1μ m [Ca2+]free.+, inhibition; −, lack of inhibition.
To explore whether the Cys29 to Ser mutation specifically prevented this transformation, additional mutants were produced (Table II). Cys29 was replaced by (i) a smaller flexible Gly, (ii) similar size charged and uncharged Asp or Asn residues, respectively, that support hydrogen bonding similar to the Cys residue, and (iii) a Tyr residue found in GCAP3 in the same position (Fig. 1C). Similar to GCAP1(C29S), GCAP1(C29G) and GCAP1(C29D) were also inactive, whereas expression of GCAP1(C29N) and GCAP1(C29Y) yielded a mutant protein, albeit at low yields, that activated photoreceptor GC at low [Ca2+] and inhibited at high [Ca2+] (Fig. 3A) resembling native GCAP1. In summary, these results suggest that Cys29 is located in a region of GCAP1 that is essential for the GC stimulation at low [Ca2+], although this residue is dispensable for GCAP1 activity and can be substituted by Asn and Tyr. The Ca2+ titration curve for GCAP1(C29N) is similar to GCAP1; therefore this substitution was used in the multiple Cys mutants described below.
Double and Triple Cys Mutants of GCAP1
A combination of double mutants GCAP1(C18S,C106S) and GCAP1(C18S, C125S) produced active proteins (Table II). GCAP1 triple mutants C18-GCAP1(c−), C106-GCAP1(c−), and C125-GCAP1(c−) (with the C29N substitution in all and only one free Cys at positions 18, 106, and 125, respectively) were also active and displayed activating properties of photoreceptor GC at low [Ca2+] and inhibitory at high [Ca2+] like native GCAP1 (Fig.3B). Cys-less GCAP1 (GCAP1(c−)) was expressed at much lower levels but still displayed a similar Ca2+ dependence (data not shown). Introduction of a positive (GCAP1 mutant modified with MTSET) or a negative charge (modified with MTSES) in all of these positions individually generated the GCAP1 products with significantly decreased (2–4-fold) GC stimulating activity (Table III), which could be restored by the addition of dithiothreitol. These results suggest that modifications with MTSET or MTSES in GCAP1 leads to alteration in the properties of GCAP1, for example in the interaction with photoreceptor GCs.
Table III.
Determination of free sulfhydryl groups in GCAP1 and its mutants
| GCAP1 and mutants | TNBa | GC activityb | GC activity +DTTb |
|---|---|---|---|
| nmol/nmol of protein | nmol/min | nmol/min | |
| GCAP1 | 4 | 0.19 ± 0.04 | 0.19 ± 0.03 |
| GCAP1-MTSES | 0.6 | 0.09 ± 0.02 | 0.21 ± 0.01 |
| GCAP1-MTSET | 0.7 | 0.09 ± 0.01 | 0.22 ± 0.01 |
| C18-GCAP1(c−) | 3.4 | 0.31 ± 0.03 | 0.31 ± 0.04 |
| C18-GCAP1(c−)-MTSES | 0 | 0.11 ± 0.01 | 0.24 ± 0.03 |
| C18-GCAP1(c−)-MTSET | 0 | 0.12 ± 0.01 | 0.28 ± 0.02 |
| C29-GCAP1(c−) | 2.4 | 0.18 ± 0.04 | 0.19 ± 0.01 |
| C29-GCAP1(c−)-MTSES | 0.1 | 0.09 ± 0.01 | 0.16 ± 0.02 |
| C29-GCAP1(c−)-MTSET | 0.22 | 0.11 ± 0.03 | 0.21 ± 0.05 |
| C106-GCAP1(c−) | 2.2 | 0.36 ± 0.02 | 0.36 ± 0.02 |
| C106-GCAP1(c−)-MTSES | 0 | 0.08 ± 0.04 | 0.32 ± 0.02 |
| C106-GCAP1(c−)-MTSET | 0.02 | 0.13 ± 0.01 | 0.30 ± 0.04 |
| C125-GCAP1(c−) | 2.6 | 0.29 ± 0.06 | 0.29 ± 0.01 |
| C125-GCAP1(c−)-MTSES | 0 | 0.06 ± 0.02 | 0.23 ± 0.02 |
| C125-GCAP1(c−)-MTSET | 0 | 0.11 ± 0.03 | 0.38 ± 0.02 |
DTNB (Ellman’s reagent) reacts with sulfhydryl groups of GCAP1 and produces 5-thio-2-nitrobenzoate (TNB), which provides product with an extinction coefficient at 412 nm of 13,600 M−1 cm−1. The concentration of proteins was determined using Bradford method.
GC assay was performed as described under “Experimental Procedures” in the presence or absence of 3 mm DTT. The activity is expressed in nmol of cGMP production per min.
Modification of Cys29
C29-GCAP1(c−) stimulated photoreceptor GCs at low [Ca2+] and inhibited the cyclase at high [Ca2+] (Fig. 4A). When compared with other triple mutants, modification of Cys29 appears to be the least quantitative with the rapidly reacting MTSET reagent (Scheme 1), as observed for C29-GCAP1(c−) (Table III). Higher concentrations of the reagent were required in comparison with other mutants, and inactivation of GCAP1 mutant was fully reversible with dithiothreitol (Fig. 4B). Hydrophobic modifications, such as DTNB or vinylpyridine of this GCAP1 mutant did not cause inactivation. Importantly, the initial rates of DTNB modification of single Cys-containing GCAP1 mutants showed no differences at low and high [Ca2+] (data not shown), suggesting minor conformational changes around these Cys residues as a consequence of Ca2+ coordination.
Fig. 4. Ca2+-dependent GC stimulatory activity of C29-GCAP1(c−) and inactivation of the mutant by MTSET.
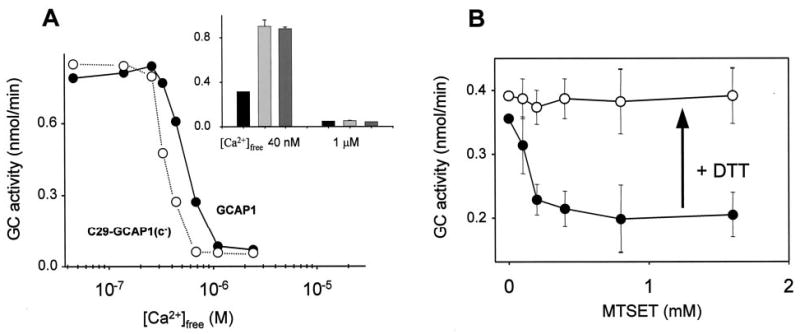
A, Ca2+-dependent ROS GC activity stimulated by GCAP1 (•) and by C29-GCAP1(c−) (○). Inset, the activity of GC without GCAP1 (black bar), in the presence of GCAP1 (light gray) and C29-GCAP1(c−) (dark gray) at 40 nm and 1 μm [Ca2+]free. The measurements were done in three independent experiments, and the difference between then in IC50 did not vary more than 80 nm [Ca 2+]. B, the activity of C29-GCAP1(c−) modified by the increasing concentration of MTSET reagent (•) and the recovery of the activity by 5 mm dithiothreitol (○). Protein modification was carried out as described under “Experimental Procedures.” The activity of ROS GC stimulated by modified GCAP1 was measured as described under “Experimental Procedures” at 40 nm [Ca2+]free.
Fluorescence Spectroscopy
The environmentally sensitive, sulfhydryl-reactive, fluorescent N,N′-dimethyl-N-(iodoacetyl)-N′-(7-nitrobenz-2-oxa-1,3-diazol-4-yl)ethylene-diamine (IANBD) (52–73) was used to monitor conformational changes in GCAP1 mutants that occur upon addition of Ca2+ (Scheme 1). For example, C18-GCAP1(c−) was modified by INABD quantitatively as determined by UV spectroscopy (Fig. 5A, inset). When excited by 480-nm light, C18-GCAP1(c−)-IANBD emitted at λem = 530 nm. Changes in fluorescence were <10% for [Ca2+] ranging from10−8 to 10−6 m with EC50 = 230 nm (Fig. 5A, left and right panels), reversible upon addition of EGTA (data not shown), and did not cause a shift in λmax of the emission (right panel, inset) The quenching of the fluorescence by KI (0–250 mm) was indistinguishable for the C18-GCAP1(c−)-IANBD in the presence and the absence of Ca2+ (data not shown). Together, these data suggest that only minor conformational changes occur around this region, including the N-terminal myristoyl group and nonfunctional, disabled by natural mutations, the EF-1 hand motif.
Fig. 5. Fluorescence properties of GCAP1 mutants modified by IANBD.
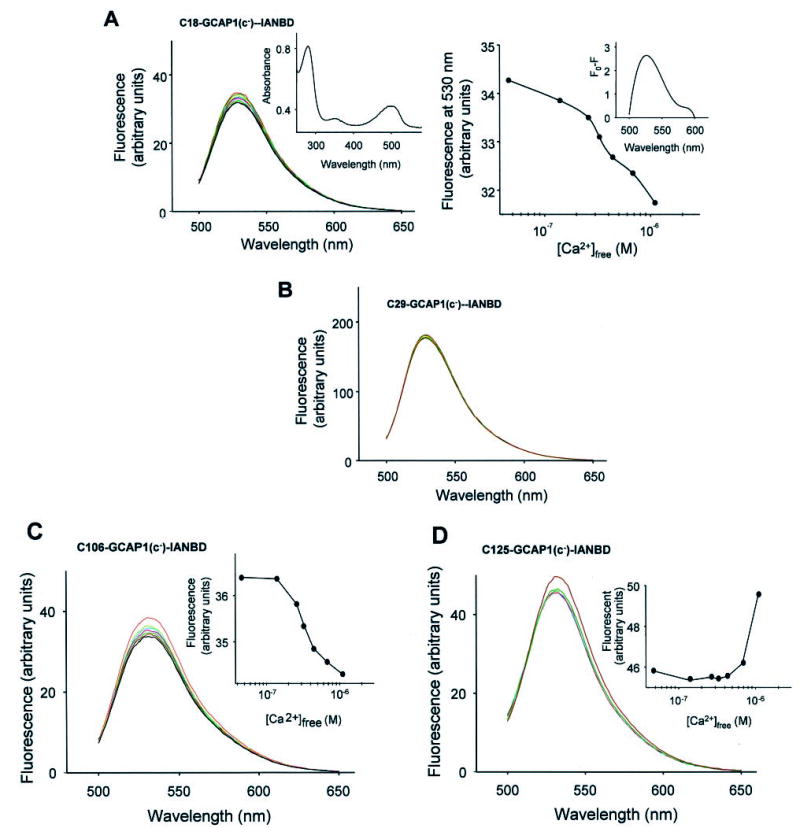
A, fluorescence emission spectra of C18-GCAP1(c−) modified by IANBD as a function of increasing [Ca2+]free (black at lowest concentrations and red at highest concentrations; λex = 480 nm). Inset, UV spectrum of modified C18-GCAP1(c−) mutant. Right panel, changes in fluorescence intensity as a function of [Ca2+]free. Inset, difference in the fluorescence intensity for C18-GCAP1(c−) at 40 nm and 2 μm [Ca2+]. B, lack of changes in the fluorescence emission intensity of C29-GCAP1(c−)-INABD at λem = 530 nm as a function of [Ca2+]free. C, fluorescence emission spectra of C106-GCAP1(c−) modified by IANBD as a function of increasing [Ca2+]free (black at lowest concentrations and red at highest concentrations; λex = 480 nm). Inset, changes in fluorescence intensity as a function of [Ca2+]free. D, fluorescence emission spectra of C125-GCAP1(c−) modified by IANBD as a function of increasing [Ca2+]free (black at lowest concentrations and red at highest concentrations; λex = 480 nm). Inset, changes in fluorescence intensity as a function of [Ca2+]free. The fluorescence measurements were done in duplicate, and the second set of data did not vary significantly from the set presented in this figure.
The C29-GCAP1(c−)-IANBD mutant was subjected to a similar analysis as the mutant described above. Minor changes in the fluorescence for this mutant (<4%) were observed. However, the relative fluorescence intensity was enhanced ~4-fold at λem = 530 nm as compared with C18-GCAP1(c−)-IANBD (Fig. 5B) in all tested [Ca2+], suggesting immobilization or relocation of the IANBD group into a more hydrophobic environment or both.3 C106-GCAP1(c−)-IANBD decreased the intensity of fluorescence only by ~5% for [Ca2+] ranging from 10−8 to 10−6 m with EC50 = 280 nm (Fig. 5C). Addition of Ca2+ to C125-GCAP1(c−)-IANBD increased the intensity of fluorescence by ~12%, but only at the highest 10−6 m [Ca2+] (Fig. 5D). Together, these data suggest that regions of GCAP1 around Cys29 and Cys106 undergo minor conformational changes that increase solvent exposure of these modified Cys residues. The region around Cys125 also undergoes minor structural alterations causing sequestration of the Cys-IANBD group into a more hydrophobic environment or slight immobilization of the fluorophore but only in fully Ca2+-loaded GCAP1.
EPR Spectroscopy
To investigate Ca2+-dependent changes in GCAP1, these same Cys mutants were modified with the spin label reagent MTSL to generate a spin labeled side chain (Scheme 1). At low [Ca2+] ([Ca2+]free = ~46 nm), the EPR spectral line shapes reflect a local structure entirely compatible with the structural model of GCAP1. According to the correlation of EPR spectral line shapes and protein structure described previously (74), the line shapes of both Cys125-GCAP1(c−)-MTSL and Cys106-GCAP1(c−)-MTSL reflect a highly mobile side chain in agreement with their putative solvent-exposed locations within the EF-hand loops. The line shape of the Cys29-GCAP1(c−)-MTSL spectrum indicates a highly immobilized side chain in a constrained environment, as expected for a site packed between two helices. Finally, the line shape of Cys18-GCAP1(c−)-MTSL suggests a distribution of side chain dynamic modes, perhaps corresponding to multiple structural states of the N-terminal region in slow exchange on the EPR time scale.
Only minor changes were observed between the EPR spectra recorded at 46 nm and ~86 mm [Ca2+]free when the nitroxide was located at Cys18, Cys106, or Cys125 (Fig. 6). On the other hand, EPR spectra of GCAP1 with the spin label at Cys29 showed a striking spectral broadening and a concomitant intensity decrease in this same range of [Ca2+]free. This observation prompted us to investigate the full Ca2+ titration curve for this GCAP1 mutant. Over the physiological range of [Ca2+]free (the activity profile is shown as a gray line in Fig. 7), only ~8% change in spectral intensity was observed. Similar to observations made using fluorescence spectroscopy, further increases in [Ca2+]free led to a dramatic decrease in the spectral intensity in a titration-like fashion centered around [Ca2+]free = ~1 mm (Fig. 7).
Fig. 6. The EPR spectra of the triple GCAP1 mutants modified on a single Cys residue with MTSL in the absence and the presence of CaCl2.
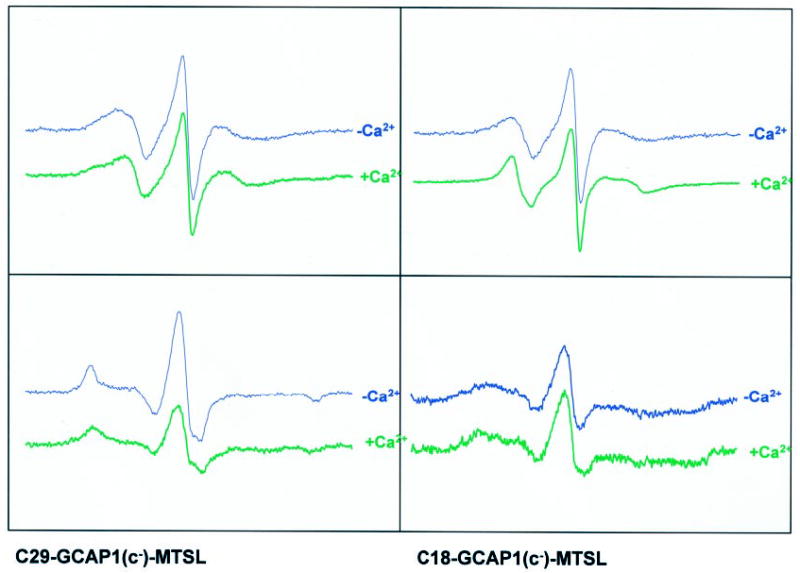
The proteins were modified, and the spectra were recorded as described under “Experimental Procedures.” The samples contained 30% sucrose in the absence (46 nm) or presence of ~86 mm [Ca2+]free.
Fig. 7. Plot of the relative center line height of C29-GCAP1(c−)-MTSL EPR spectra as a function of [Ca2+]free.
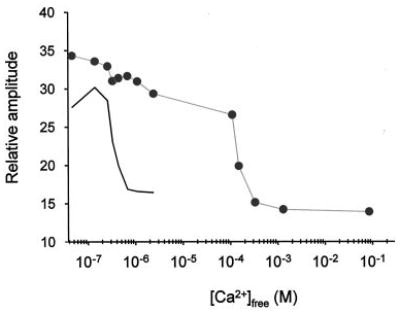
The decrease in the relative amplitude of the center line of each spectrum is a result of the changes seen upon addition of CaCl2 that leads to broadening of the spectra. A typical Ca2+ titration of GCAP1-dependent stimulation of GC activity is shown in black.
In addition to the Ca2+-dependent change in EPR spectral line shape, the change in accessibility of the nitroxide at position 29 to collision with oxygen was also examined using the ″P½ parameter (42). The value of ″P½ is a direct measure of solvent accessibility of the nitroxide and was found to decrease by a factor of three upon an increase in [Ca2+]free from 46 nM to 86 mm. Thus, the nitroxide is more deeply buried in the protein structure in the high [Ca2+] state.
Collectively, the above data show that there is very little change in the secondary or tertiary structure in the vicinity of spin labels upon physiological activation of GCAP1 by Ca2+ but that a second Ca2+-dependent event leads to a change in the environment around site 29 at high nonphysiological [Ca2+] (>1 mm). The molecular origin of this second process is unknown but could possibly arise from oligomerization, perhaps aided by the relatively hydrophobic nitroxide group. However, because labels at Cys18, Cys106, and Cys125 do not show similar changes, the oligomer is likely to be a nonspecific aggregate and may correspond to a dimer.
Gel Filtration
To investigate Ca2+-dependent oligomerization of GCAP1, we used gel filtration methods at high and low [Ca2+]. In most cases, GCAP1 and its mutants eluted (as shown in Fig. 8A, trace a) as a mixture of ~80 –90% monomeric protein and the remaining as a dimer, with the dimer being inactive (Fig. 8B). Addition of 50 μm Ca2+ did not affect this ratio, although at high [Ca2+] additional amounts of dimer (10 –15%) were occasionally observed (data not shown). In less frequent preparations, the dimeric inactive form of GCAP1 was observed at levels up to ~40% of the monomer (trace b). Isolated peaks 2 and 1 (trace b) were individually rechromatographed at low and high [Ca2+]. There was no interconversion of one form into another (trace c and d, respectively). Once more, there was no Ca2+ dependence on the formation of monomers/dimers under tested conditions.4 It is noteworthy that native GCAP1 is also monomeric (25). These results suggest that under physiological conditions GCAP1 does not undergo Ca2+-dependent oligomerization.
Fig. 8. Gel filtration profile of GCAP1 mutants.
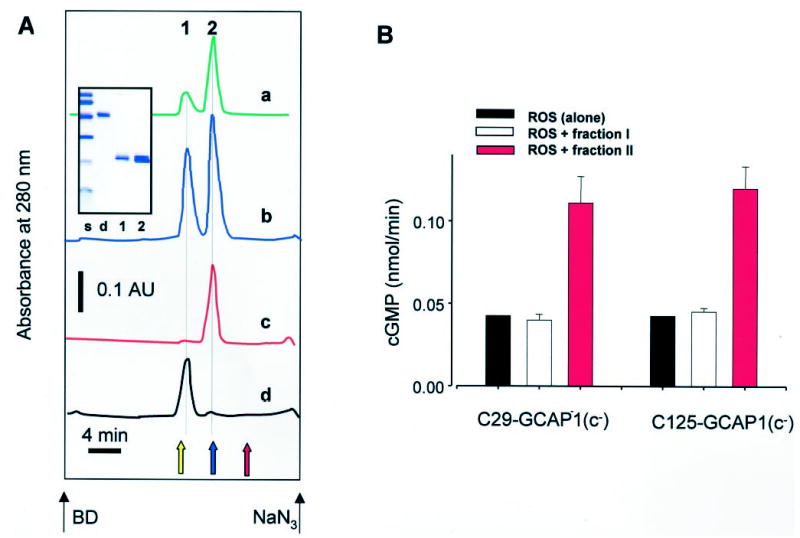
A, C106-GCAP1(c−) (~0.3 mg/ml) was loaded on Superdex 200 (Amersham Pharmacia Biotech). The protein elution profile was monitored by absorption at 280 nm (trace a). C29-GCAP1(c−) was filtrated on Superdex 200 (Amersham Pharmacia Biotech) equilibrated with 10 mm BTP, pH 7.5, 150 mm NaCl, and 1 mm EGTA (trace b). Peaks 1 and 2 were separately collected and filtrated on the same column in the presence of 50 μm CaCl2 (traces c and d) without EGTA. The elution position of a GCAP fusion protein dimer is shown as a yellow arrow, carbonic anhydrase (29 kDa) is shown as a blue arrow, and cytochrome c (12.4 kDa) is shown as a red arrow. Black arrows show the elution of blue dextran (BD; molecular weight > 2,000,000) and NaN3. Inset, SDS-PAGE of molecular mass standards (s) (from the top, 92, 67, 43, 30, 21, and 14 kDa), peak 1 (lane 1), peak 2 (lane 2), and a covalent dimer of GCAP1 (lane d) (A. Alekseev and K. Palczewski, unpublished observations). B, the GC activity in ROS measured in the presence of peaks 1 and 2.
DISCUSSION
Relationship between GCAP1, CaM, and Other NCBP
In vertebrate cells, Ca2+ is frequently coordinated by proteins containing the EF-hand motifs (75). Among the EF-hand-containing proteins, NCBPs have become targets for intense scrutiny because of the proven involvement and potential role of these proteins in key processes within neurons (1–3). The topology of NCBPs is similar to that of CaM, consisting of a tandem of two EF-hand motifs connected by the central helix and a pseudo 2-fold symmetry (1, 76). The diversity of NCBPs is generated by the presence of unique amino acid sequences that produce distinct EF-hand pair positions and varying angles between α-helices surrounding the EF-hand motif (76). It has been proposed that these EF-hands display a constellation of unique conformational states (77), which may be critical for precise tuning of target enzymatic activities in response to changes in [Ca2+]. GCAPs offer a special possibility to investigate the conformational changes of these proteins, an opportunity that is enhanced by the detailed characterization of the target enzyme, GC1. Therefore, a wealth of information has accumulated over the years (1, 2, 27, 78, 79).
Cys29 Mutation to Asn and Tyr, but Not Ser, Gly, or Asp, Produced Active GCAP1
Of all Cys residues in GCAP1, Cys29 appears to be the most sensitive to substitutions. The replacement of Cys29 by Ser, Gly, and Asp produced inactive proteins. Conversely, mutating Cys29 to Tyr (present in GCAP3 at this position) and Asn yielded active proteins. One possibility is that this site (region) is critically important for the conversion of the inactive Ca2+ bound form to the active Ca2+ form of GCAP1 or that this region is critical for the interaction with GC. In agreement with both possibilities GCAP1(C29S) is a potent competitor of a constitutively active GCAP1 triple mutant but is unable to stimulate GC at low [Ca2+] (Fig. 2). However, this region does not undergo conformation changes upon Ca2+ binding as shown by spectroscopic methods, suggesting that the correct conformation of the N-terminal region is essential for the GC stimulation.
Intriguingly, helix 2 and helix 3 form a hydrophobic cavity where Cys29 is located. Most likely the fluorescence probe is positioned along this cavity, where a hydrogen bond may be formed between Lys46 and a nitro group of the IANBD moiety (Fig. 9, right panel). The spin label group may also intercalate into this cavity. Consistent with this model, Cys at this position can be modified by hydrophobic groups with retention of the GC stimulatory activity. GCAP1 modified by the fluorophore IANBD, whose emission properties are sensitive to the molecular environment and its accessibility to water (80), showed increased fluorescence as compared with other mutants. In a native state, a hydrogen bonding between Glu28 and Gln41 of GCAP1 could be formed with GC (Fig. 9). In the Ca2+ -bound form, Gly and Ser residues of the corresponding mutants are buried because Glu28, Glu38, and Gln41 come closer together and change the shape of the surface (Fig. 10). As shown in this study, this region does not undergo major structural changes as a function of Ca2+. Therefore, we anticipate that the same interactions are still present in a Ca2+ -free state. In GCAP1(C29N), Asn forms a hydrogen bond with Glu38, the same as Ser, but this pair does not enter the interior of the protein. Surfaces for Asn and Asp look similar; however, charged groups in this region prevent the activation of GC (Table III). Tyr29 of the GCAP1(C29Y) mutant is exposed and not covered by the Glu28-Gln41 pair. These modeling studies point to the possibility that the Cys29 region is involved in the interaction with GC that leads to increased cGMP production but perhaps is less important for the inhibition of GC activity at high [Ca2+]. This hypothesis is consistent with the observation that the N-terminal region of GCAP1, including its myristoyl group, displays a different specificity in interacting with GC, depending on the Ca2+ coordination (37). In an independent study employing GCAP1/GCIP chimeric molecules, we further demonstrated the importance of the N-terminal region of GCAP1 for GC stimulation (81). Residues 1–43 of GCAP1 (including Cys29), replacing the corresponding residues in the inhibitory protein GCIP, converted a GC inhibitor into a GC activator.
Fig. 9. The model of GCAP1 around Cys29.
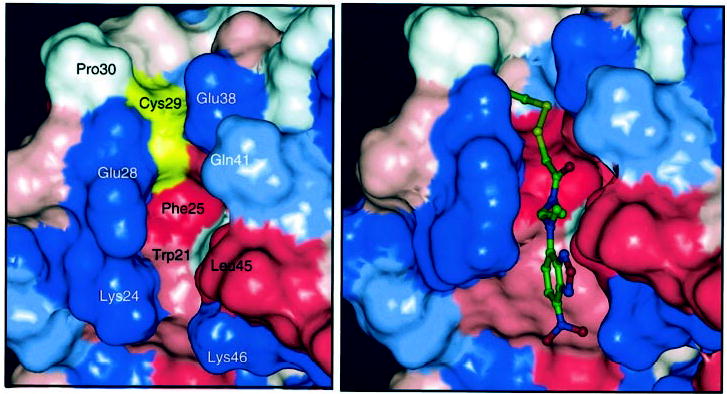
The surface is color-coded. Blue, hydrophilic residues; red, hydrophobic residues; white, neutral residues. Cys29 is shown in yellow. The model was generated by Insight II program and minimized in cff91 force field (86, 87) together with the 5 Å thick water layer. Homology modeling was based on GCAP2 structure (45). Hydrogen atoms were added at pH 7.0, and the atomic charge assignment scheme of Gasteiger-Marsili (45) (left panel) was employed. Right panel, model of IANBD attached to Cys29.
Fig. 10. The model of GCAP1 around position 29.
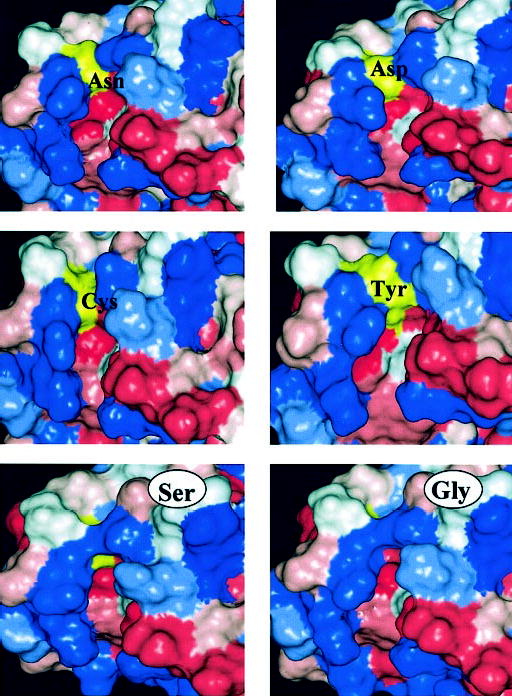
The surface is color-coded. Blue, hydrophilic residues; red, hydrophobic residues; white, neutral residues. The residue in position 29 is shown in yellow. Computational details are the same as those described in the Fig. 9 legend. In position 29 the following residues are shown: Cys, Ser, Gly, Tyr, Asp, and Asn.
Changes in the GCAP1 Structure upon Addition of Ca2+
The results of this study are internally consistent with previous investigations on the fluorescence spectra of native GCAP1 and its Trp mutants, where Trp residues were specifically engineered into regions of GCAP1 to monitor Ca2+ binding to EF-hand motifs (30). These studies suggested that during the transition from inactive (Ca2+-bound) to active conformation (Ca2+-free form), there is rotation around central helix 6 (Fig. 1B) that causes an exposure of the hydrophobic residues of this helix. Tyr99 is wedged between helix 6 and the EF3-hand motif (Fig. 1B), and its mutation to Cys causes constitutive activation of the GCAP1 mutant. The binding of Ca2+ at physiological conditions is insufficient to stabilize the mutant GCAP1 in an inactive conformation. Thus, mutant GCAP1(Y99C) is constitutively active, presumably causing elevated levels of cGMP, in vitro and in vivo. These relatively subtle changes of cGMP levels are thought to be causative of autosomal dominant cone dystrophy (33–35).
As shown in this study, other regions of the protein undergo rather minor conformational changes. These data are also consistent with limited proteolysis studies showing that in the Ca2+-bound form of GCAP1, the interior of the protein is protected from proteolytic degradation, whereas in the middle section of the protein is quickly cleaved the Ca2+-free form (32). Introduction of a hydrophobic group in the binding site of the pocket formed between helices 2 and 5 may make the modified protein prone to dimerization.
GCAP1 versus GCAP2
Of the three GCAPs, GCAP1 and GCAP2 have been the most intensely studied (2, 78). Surprisingly, although GCAP1 and GCAP2 stimulate photoreceptor GCs, many properties were reported to be different for both proteins. Like other Ca2+-binding proteins, GCAP1 and GCAP2 are closely related evolutionarily, and their genes were generated by ancient gene duplication/inversion events, similar to S-100 Ca2+-binding proteins (82); however, these two GCAPs share only ~45% homology on the sequence level. GCAP2 is more soluble than GCAP1, and GCAP2 has been proposed to increase its solubility upon binding of Ca2+ ions (83). To our knowledge, it is the only known EF-hand-containing protein to show such a property; typically, the opposite is more frequently observed. For example, using small angle x-ray scattering and circular dichroism, it was shown that the related protein recoverin aggregates in the Ca2+-bound forms (84) but is monomeric and soluble in the Ca2+-free form. Despite this solubility property, GCAP2 inhibits GCs at high [Ca2+] (83). Recoverin is monomeric and soluble in Ca2+-free form. GCAP1, in contrast, is mostly associated with the membranes and/or GC1 under all [Ca2+] (31). There are other differences between both of these proteins, most notably the sites of the GC interaction and the GC specificity (2, 44, 48, 78). Thus, despite some similarities between these two proteins and other members of NCBP, there are important fundamental differences. This observation is surprising because the structures of all these proteins are predicted to be similar (see the Introduction).
Model of the Activation
It was recently proposed, based on gel filtration studies, that the Ca2+-loaded GCAP2 monomer undergoes reversible dimerization upon dissociation of Ca2+ (85). This observation was correlated with the ability of GCAP2 to activate photoreceptor GC and its ability to dimerize at low free [Ca2+]. Those conclusions are different from the results presented in this study with GCAP1. These differences could arise from either differences in properties between the two GCAPs, experimental conditions, or folding of proteins as a consequence of bacterially expressed proteins versus GCAP1 expressed in insect cells. As shown in gel filtration experiments (Fig. 8), GCAP1 does not undergo reversible Ca2+-dependent changes in its aggregation status, and the small fraction of GCAP1 forming dimers is unable to stimulate photoreceptor GCs. In addition, it was reported that native GCAP1, purified from the bovine retina, behaves as a monomer (25). These studies are consistent with fluorescent spectroscopy in this and a previous report (30) and with EPR spectroscopy that did not detect any major conformational changes or oligomerization.
The model for the GCAP1 activation that is emerging is consistent with the one presented in Fig. 11. GCAP1 forms a stable multi-site attachment complex with GC. During activation (lowering [Ca2+]), GCAP1 undergoes rotation around central helix 6 (Fig. 1) that ultimately leads to changes in the catalytic site of GC (47).
Fig. 11. Model of the GC regulation by GCAP1.
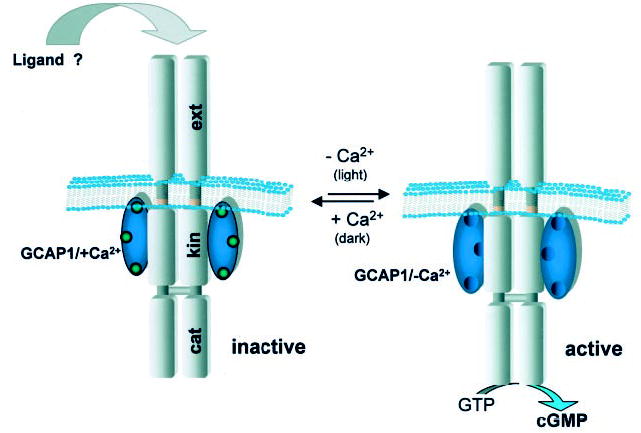
In the presence of μm [Ca2+]free GCAP1 inhibits GC activity (left). It is still unclear, whether an extra-cellular (intradiscal) ligand regulates GC activity. Upon illumination, GCAP1 causes change in the GC, increasing the enzymatic activity of cGMP production (right). In this model, binding of Ca2+ to GCAP1 does not cause dimerization, whereas GC is a dimer.
In summary, we utilized the sulfhydryl chemistry of GCAP1 and its mutants to understand the conformational changes in the protein induced by Ca2+ binding. Four endogenous Cys residues at positions 18, 29, 106, and 125 provide an excellent spatial distribution of these reporter residues to map Ca2+-induced conformational changes. Side-directed substitution of these amino acids did not perturb the overall properties of GCAP1 as tested by various complementary methods. We demonstrate that local changes around two C-terminal and N-terminal lobes, each containing two EF-hand motifs, are rather minor, suggesting that larger Ca2+-dependent changes occur only within the flexible central helix of GCAP1. We offer a model of a photoreceptor GC activation that assumes changes within the flexible central helix of GCAP1 cause relative reorientation of two structural domains, switching GCAP1 from the active to the inactive state.
Acknowledgments
We thank Dr. A. Alekseev for the preparation of the GCAP dimer and Dr. Geeng-Fu Jang and Josua McBee for the comments on the manuscript. We also thank the ICM computer center at the University of Warsaw for computational tasks.
Footnotes
This work was supported by National Institutes of Health Grants EY08123 (to W. B.) and EY08061 (to K. P.), a grant from Research to Prevent Blindness, Inc. to the Department of Ophthalmology at the University of Washington and the University of Utah, a Center Grant from Foundation Fighting Blindness, Inc., to the University of Utah, the Ruth and Milton Steinbach Fund, the E. K. Bishop Foundation, and an award from the Alcon Research Institute.
The abbreviations used are: NCBP, neuronal calcium-binding protein; BTP, (1,3-bis[tris(hydroxymethyl)-methylamino]propane); CaM, calmodulin; DTNB, 5,5′-dithio(2-nitrobenzoic acid); EPR, electron paramagnetic resonance; GC, guanylyl cyclase; GCAP, GC-activating protein; IANBD, N,N′-dimethyl-N-(iodoacetyl)-N′-(7-nitrobenz-2-oxa-1,3-diazol-4-yl)ethylenediamine; MTSEA, 2-aminoethyl methanethiosulfonate hydrobromide; MTSES, sodium (2-sulfonatoethyl) methanethiosulfonate; MTSET, [2-(trimethylammonium)ethyl]methanethiosulfonate; MTSL, (1-oxy-2,2,5,5-tetramethylpyrroline-3-methyl)methane-thiosulfonate; PAGE, polyacrylamide gel electrophoresis; RMSD, root mean square deviation; ROS, rod outer segments.
GCAP1 has four Cys residues in positions 18, 29, 106 and 125.GCAP1 with mutation of Cys18 to Ser, Cys29 to Asn, Cys106 to Ser, and Cys125 to Ser is denoted as GCAP1(c−). For simplicity, the triple mutants with the Cys that is preserved as in wild-type GCAP1 are denoted as C18-GCAP1(c−), C29-GCAP1(c−), C106-GCAP1(c−), or C125-GCAP1(c−). Published, JBC Papers in Press, August 27, 2001
Further increase in [Ca2+] to 5 mm led to additional increase of the fluorescence of C29-GCAP1(c−) by 76% (data not shown). This increase in fluorescence could result from oligomerization of the GCAP1 mutant in these nonphysiological conditions.
Similar observations were also made for GCAP2 (I. Sokal and K. Palczewski, unpublished observations).
References
- 1.Polans A, Baehr W, Palczewski K. Trends Neurosci. 1996;19:547–554. doi: 10.1016/s0166-2236(96)10059-x. [DOI] [PubMed] [Google Scholar]
- 2.Palczewski K, Polans AS, Baehr W, Ames JB. Bioessays. 2000;22:337–350. doi: 10.1002/(SICI)1521-1878(200004)22:4<337::AID-BIES4>3.0.CO;2-Z. [DOI] [PubMed] [Google Scholar]
- 3.Burgoyne RD, Weiss JL. Biochem J. 2001;353:1–12. [PMC free article] [PubMed] [Google Scholar]
- 4.Dizhoor AM, Ray S, Kumar S, Niemi G, Spencer M, Brolley D, Walsh KA, Philipov PP, Hurley JB, Stryer L. Science. 1991;251:915–918. doi: 10.1126/science.1672047. [DOI] [PubMed] [Google Scholar]
- 5.Polans AS, Witkowska D, Haley TL, Amundson D, Baizer L, Adamus G. Proc Natl Acad Sci U S A. 1995;92:9176 –9180. doi: 10.1073/pnas.92.20.9176. [DOI] [PMC free article] [PubMed] [Google Scholar]
- 6.Kawamura S, Hisatomi O, Kayada S, Tokunaga F, Kuo CH. J Biol Chem. 1993;268:14579 –14582. [PubMed] [Google Scholar]
- 7.Kawamura S, Kuwata O, Yamada M, Matsuda S, Hisatomi O, Tokunaga F. J Biol Chem. 1996;271:21359 –21364. doi: 10.1074/jbc.271.35.21359. [DOI] [PubMed] [Google Scholar]
- 8.Gray-Keller MP, Polans AS, Palczewski K, Detwiler PB. Neuron. 1993;10:523–531. doi: 10.1016/0896-6273(93)90339-s. [DOI] [PubMed] [Google Scholar]
- 9.Flaherty KM, Zozulya S, Stryer L, McKay DB. Cell. 1993;75:709 –716. doi: 10.1016/0092-8674(93)90491-8. [DOI] [PubMed] [Google Scholar]
- 10.Ames JB, Ishima R, Tanaka T, Gordon JI, Stryer L, Ikura M. Nature. 1997;389:198 –202. doi: 10.1038/38310. [DOI] [PubMed] [Google Scholar]
- 11.Kobayashi M, Takamatsu K, Saitoh S, Miura M, Noguchi T. Biochem Biophys Res Commun. 1993;196:1017–1022. doi: 10.1006/bbrc.1993.2351. [DOI] [PubMed] [Google Scholar]
- 12.Kobayashi M, Takamatsu K, Saitoh S, Miura M, Noguchi T. Biochem Biophys Res Commun. 1992;189:511–517. doi: 10.1016/0006-291x(92)91587-g. [DOI] [PubMed] [Google Scholar]
- 13.Takamatsu K, Noguchi T. Neurosci Res. 1993;17:291–295. doi: 10.1016/0168-0102(93)90112-4. [DOI] [PubMed] [Google Scholar]
- 14.Okazaki K, Watanabe M, Ando Y, Hagiwara M, Terasawa M, Hidaka H. Biochem Biophys Res Commun. 1992;185:147–153. doi: 10.1016/s0006-291x(05)80968-4. [DOI] [PubMed] [Google Scholar]
- 15.Terasawa M, Nakano A, Kobayashi R, Hidaka H. J Biol Chem. 1992;267:19596 –19599. [PubMed] [Google Scholar]
- 16.Hidaka H, Okazaki K. Neurosci Res. 1993;16:73–77. doi: 10.1016/0168-0102(93)90074-z. [DOI] [PubMed] [Google Scholar]
- 17.Vijay-Kumar S, Kumar VD. Nat Struct Biol. 1999;6:80 –88. doi: 10.1038/4956. [DOI] [PubMed] [Google Scholar]
- 18.Pongs O, Lindemeier J, Zhu XR, Theil T, Engelkamp D, Krah-Jentgens I, Lambrecht HG, Koch KW, Schwemer J, Rivosecchi R, et al. Neuron. 1993;11:15–28. doi: 10.1016/0896-6273(93)90267-u. [DOI] [PubMed] [Google Scholar]
- 19.McFerran BW, Graham ME, Burgoyne RD. J Biol Chem. 1998;273:22768 –22772. doi: 10.1074/jbc.273.35.22768. [DOI] [PubMed] [Google Scholar]
- 20.Ames JB, Hendricks KB, Strahl T, Huttner IG, Hamasaki N, Thorner J. Biochemistry. 2000;39:12149 –12161. doi: 10.1021/bi0012890. [DOI] [PubMed] [Google Scholar]
- 21.Bourne Y, Dannenberg J, Pollmann V, Marchot P, Pongs O. J Biol Chem. 2001;276:11949 –11955. doi: 10.1074/jbc.M009373200. [DOI] [PubMed] [Google Scholar]
- 22.Hendricks KB, Wang BQ, Schnieders EA, Thorner J. Nat Cell Biol. 1999;1:234 –241. doi: 10.1038/12058. [DOI] [PubMed] [Google Scholar]
- 23.Takami K, Kiyama H, Hatakenaya S, Tohyama M, Miki N. Neuroscience. 1985;15:667–675. doi: 10.1016/0306-4522(85)90068-5. [DOI] [PubMed] [Google Scholar]
- 24.Hatakenaka S, Kiyama H, Tohyama M, Miki N. Brain Res. 1985;331:209 –215. doi: 10.1016/0006-8993(85)91546-x. [DOI] [PubMed] [Google Scholar]
- 25.Gorczyca WA, Gray-Keller MP, Detwiler PB, Palczewski K. Proc Natl Acad Sci U S A. 1994;91:4014 –4018. doi: 10.1073/pnas.91.9.4014. [DOI] [PMC free article] [PubMed] [Google Scholar]
- 26.Li N, Fariss RN, Zhang K, Otto Bruc A, Haeseleer F, Bronson D, Qin N. Eur J Biochem. 1998;252:591–599. doi: 10.1046/j.1432-1327.1998.2520591.x. [DOI] [PubMed] [Google Scholar]
- 27.Pugh EN, Jr, Duda T, Sitaramayya A, Sharma RK. Biosci Rep. 1997;17:429 –473. doi: 10.1023/a:1027365520442. [DOI] [PubMed] [Google Scholar]
- 28.Fain GL, Matthews HR, Cornwall MC, Koutalos Y. Physiol Rev. 2001;81:117–151. doi: 10.1152/physrev.2001.81.1.117. [DOI] [PubMed] [Google Scholar]
- 29.Tanaka T, Ames JB, Harvey TS, Stryer L, Ikura M. Nature. 1995;376:444 –447. doi: 10.1038/376444a0. [DOI] [PubMed] [Google Scholar]
- 30.Sokal I, Otto-Bruc AE, Surgucheva I, Verlinde CL, Wang CK, Baehr W, Palczewski K. J Biol Chem. 1999;274:19829 –19837. doi: 10.1074/jbc.274.28.19829. [DOI] [PubMed] [Google Scholar]
- 31.Gorczyca WA, Polans AS, Surgucheva IG, Subbaraya I, Baehr W, Palczewski K. J Biol Chem. 1995;270:22029 –22036. doi: 10.1074/jbc.270.37.22029. [DOI] [PubMed] [Google Scholar]
- 32.Rudnicka-Nawrot M, Surgucheva I, Hulmes JD, Haeseleer F, Sokal I, Crabb JW, Baehr W, Palczewski K. Biochemistry. 1998;37:248 –257. doi: 10.1021/bi972306x. [DOI] [PubMed] [Google Scholar]
- 33.Sokal I, Li N, Surgucheva I, Warren MJ, Payne AM, Bhattacharya SS, Baehr W, Palczewski K. Mol Cell. 1998;2:129 –133. doi: 10.1016/s1097-2765(00)80121-5. [DOI] [PubMed] [Google Scholar]
- 34.Payne AM, Downes SM, Bessant DA, Taylor R, Holder GE, Warren MJ, Bird AC, Bhattacharya SS. Hum Mol Genet. 1998;7:273–277. doi: 10.1093/hmg/7.2.273. [DOI] [PubMed] [Google Scholar]
- 35.Dizhoor AM, Boikov SG, Olshevskaya EV. J Biol Chem. 1998;273:17311–17314. doi: 10.1074/jbc.273.28.17311. [DOI] [PubMed] [Google Scholar]
- 36.Papermaster DS. Methods Enzymol. 1982;81:48 –52. doi: 10.1016/s0076-6879(82)81010-0. [DOI] [PubMed] [Google Scholar]
- 37.Otto-Bruc A, Buczylko J, Surgucheva I, Subbaraya I, Rudnicka-Nawrot M, Crabb JW, Arendt A, Hargrave PA, Baehr W, Palczewski K. Biochemistry. 1997;36:4295–4302. doi: 10.1021/bi963000d. [DOI] [PubMed] [Google Scholar]
- 38.Schoenmakers TJ, Visser GJ, Flik G, Theuvenet AP. BioTechniques. 1992;12:870 –874. [PubMed] [Google Scholar]
- 39.Bradford MM. Anal Biochem. 1976;72:248 –254. doi: 10.1016/0003-2697(76)90527-3. [DOI] [PubMed] [Google Scholar]
- 40.Froncisz W, Hyde JS. J Magn Reson. 1982;47:515–521. [Google Scholar]
- 41.Hubbell WL, Froncisz W, Hyde JS. Rev Sci Instrum. 1987;58:1879 –1886. [Google Scholar]
- 42.Altenbach C, Flitsch SL, Khorana HG, Hubbell WL. Biochemistry. 1989;28:7806 –7812. doi: 10.1021/bi00445a042. [DOI] [PubMed] [Google Scholar]
- 43.Semple-Rowland SL, Gorczyca WA, Buczylko J, Helekar BS, Ruiz CC, Subbaraya I, Palczewski K, Baehr W. FEBS Lett. 1996;385:47 –52. doi: 10.1016/0014-5793(96)00345-6. [DOI] [PubMed] [Google Scholar]
- 44.Duda T, Goraczniak R, Surgucheva I, Rudnicka-Nawrot M, Gorczyca WA, Palczewski K, Sitaramayya A, Baehr W, Sharma RK. Biochemistry. 1996;35:8478 –8482. doi: 10.1021/bi960752z. [DOI] [PubMed] [Google Scholar]
- 45.Gasteiger J, Marsili M. Tetrahedron. 1980;36:3219 –3222. [Google Scholar]
- 46.Surguchov A, Bronson JD, Banerjee P, Knowles JA, Ruiz C, Subbaraya I, Palczewski K, Baehr W. Genomics. 1997;39:312–322. doi: 10.1006/geno.1996.4513. [DOI] [PubMed] [Google Scholar]
- 47.Sokal I, Haeseleer F, Arendt A, Adman ET, Hargrave PA, Palczewski K. Biochemistry. 1999;38:1387–1393. doi: 10.1021/bi982512k. [DOI] [PubMed] [Google Scholar]
- 48.Haeseleer F, Sokal I, Li N, Pettenati M, Rao N, Bronson D, Wechter R, Baehr W, Palczewski K. J Biol Chem. 1999;274:6526 –6535. doi: 10.1074/jbc.274.10.6526. [DOI] [PubMed] [Google Scholar]
- 49.Sokal I, Li N, Verlinde CL, Haeseleer F, Baehr W, Palczewski K. Biochim Biophys Acta. 2000;1498:233–251. doi: 10.1016/s0167-4889(00)00099-9. [DOI] [PubMed] [Google Scholar]
- 50.Otto-Bruc A, Fariss RN, Haeseleer F, Huang J, Buczylko J, Surgucheva I, Baehr W, Milam AH, Palczewski K. Proc Natl Acad Sci U S A. 1997;94:4727–4732. doi: 10.1073/pnas.94.9.4727. [DOI] [PMC free article] [PubMed] [Google Scholar]
- 51.Moon C, Jaberi P, Otto-Bruc A, Baehr W, Palczewski K, Ronnett GV. J Neurosci. 1998;18:3195–3205. doi: 10.1523/JNEUROSCI.18-09-03195.1998. [DOI] [PMC free article] [PubMed] [Google Scholar]
- 52.Rajarathnam K, Hochman J, Schindler M, Ferguson-Miller S. Biochemistry. 1989;28:3168 –3176. doi: 10.1021/bi00434a009. [DOI] [PubMed] [Google Scholar]
- 53.Phan BC, Cheung P, Stafford WF, Reisler E. Biophys Chem. 1996;59:341–349. doi: 10.1016/0301-4622(95)00127-1. [DOI] [PubMed] [Google Scholar]
- 54.Park HS, Kim IS, Park JW. Biochem Biophys Res Commun. 1999;259:38 –42. doi: 10.1006/bbrc.1999.0721. [DOI] [PubMed] [Google Scholar]
- 55.Miki M, Wahl P. Biochim Biophys Acta. 1984;790:275–283. doi: 10.1016/0167-4838(84)90032-3. [DOI] [PubMed] [Google Scholar]
- 56.Park HS, Park JW. Arch Biochem Biophys. 1998;360:165–172. doi: 10.1006/abbi.1998.0938. [DOI] [PubMed] [Google Scholar]
- 57.Liang JN. Curr Eye Res. 1987;6:351–355. doi: 10.3109/02713688709025187. [DOI] [PubMed] [Google Scholar]
- 58.Kojima K, Kitada S, Ogishima T, Ito A. J Biol Chem. 2001;276:2115–2121. doi: 10.1074/jbc.M003111200. [DOI] [PubMed] [Google Scholar]
- 59.Liang JN, Pelletier MR. Exp Eye Res. 1987;45:197–206. doi: 10.1016/s0014-4835(87)80143-4. [DOI] [PubMed] [Google Scholar]
- 60.Jensen AD, Guarnieri F, Rasmussen SG, Asmar F, Ballesteros JA, Gether U. J Biol Chem. 2001;276:9279 –9290. doi: 10.1074/jbc.M004871200. [DOI] [PubMed] [Google Scholar]
- 61.Greene LE. J Biol Chem. 1986;261:1279 –1285. [PubMed] [Google Scholar]
- 62.Gordon AM, Qian Y, Luo Z, Wang CK, Mondares RL, Martyn DA. J Muscle Res Cell Motil. 1997;18:643–653. doi: 10.1023/a:1018631806182. [DOI] [PubMed] [Google Scholar]
- 63.Gether U, Lin S, Ghanouni P, Ballesteros JA, Weinstein H, Kobilka BK. EMBO J. 1997;16:6737–6747. doi: 10.1093/emboj/16.22.6737. [DOI] [PMC free article] [PubMed] [Google Scholar]
- 64.Gilardi G, Zhou LQ, Hibbert L, Cass AE. Anal Chem. 1994;66:3840 –3847. doi: 10.1021/ac00093a047. [DOI] [PubMed] [Google Scholar]
- 65.Gether U, Lin S, Kobilka BK. J Biol Chem. 1995;270:28268 –28275. doi: 10.1074/jbc.270.47.28268. [DOI] [PubMed] [Google Scholar]
- 66.Dunn SM, Conti-Tronconi BM, Raftery MA. Biochemistry. 1983;22:2512–2518. doi: 10.1021/bi00279a031. [DOI] [PubMed] [Google Scholar]
- 67.Dunn SM, Raftery MA. Biochemistry. 1993;32:8608 –8615. doi: 10.1021/bi00084a031. [DOI] [PubMed] [Google Scholar]
- 68.Brenner B, Chalovich JM. Biophys J. 1999;77:2692–2708. doi: 10.1016/S0006-3495(99)77103-1. [DOI] [PMC free article] [PubMed] [Google Scholar]
- 69.Brenner B, Kraft T, Yu LC, Chalovich JM. Biophys J. 1999;77:2677–2691. doi: 10.1016/S0006-3495(99)77102-X. [DOI] [PMC free article] [PubMed] [Google Scholar]
- 70.Bobkova EA, Bobkov AA, Levitsky DI, Reisler E. Biophys J. 1999;76:1001–1007. doi: 10.1016/S0006-3495(99)77264-4. [DOI] [PMC free article] [PubMed] [Google Scholar]
- 71.Allen DJ, Benkovic SJ. Biochemistry. 1989;28:9586 –9593. doi: 10.1021/bi00451a006. [DOI] [PubMed] [Google Scholar]
- 72.Andley UP, Chapman SF, Chylack LT. Curr Eye Res. 1985;4:831–842. doi: 10.3109/02713688509095249. [DOI] [PubMed] [Google Scholar]
- 73.Ajtai K, Burghardt TP. Biochemistry. 1989;28:2204 –2210. doi: 10.1021/bi00431a035. [DOI] [PubMed] [Google Scholar]
- 74.Mchaourab HS, Lietzow MA, Hideg K, Hubbell WL. Biochemistry. 1996;35:7692–7704. doi: 10.1021/bi960482k. [DOI] [PubMed] [Google Scholar]
- 75.Lewit-Bentley A, Rety S. Curr Opin Struct Biol. 2000;10:637–643. doi: 10.1016/s0959-440x(00)00142-1. [DOI] [PubMed] [Google Scholar]
- 76.Kawasaki H, Nakayama S, Kretsinger RH. Biometals. 1998;11:277–295. doi: 10.1023/a:1009282307967. [DOI] [PubMed] [Google Scholar]
- 77.Yap KL, Ames JB, Swindells MB, Ikura M. Proteins. 1999;37:499 –507. doi: 10.1002/(sici)1097-0134(19991115)37:3<499::aid-prot17>3.0.co;2-y. [DOI] [PubMed] [Google Scholar]
- 78.Dizhoor AM. Cell Signal. 2000;12:711–719. doi: 10.1016/s0898-6568(00)00134-0. [DOI] [PubMed] [Google Scholar]
- 79.Lucas KA, Pitari GM, Kazerounian S, Ruiz-Stewart I, Park J, Schulz S, Chepenik KP, Waldman SA. Pharmacol Rev. 2000;52:375–414. [PubMed] [Google Scholar]
- 80.Shepard LA, Heuck AP, Hamman BD, Rossjohn J, Parker MW, Ryan KR, Johnson AE, Tweten RK. Biochemistry. 1998;37:14563–14574. doi: 10.1021/bi981452f. [DOI] [PubMed] [Google Scholar]
- 81.Li, N., Sokal, I., Branson, J. D., Palczewski, K., and Baehr, W. (2001) Biol. Chem., in press [DOI] [PubMed]
- 82.Heizmann CW, Cox JA. Biometals. 1998;11:383–397. doi: 10.1023/a:1009212521172. [DOI] [PubMed] [Google Scholar]
- 83.Olshevskaya EV, Hughes RE, Hurley JB, Dizhoor AM. J Biol Chem. 1997;272:14327–14333. doi: 10.1074/jbc.272.22.14327. [DOI] [PubMed] [Google Scholar]
- 84.Kataoka M, Mihara K, Tokunaga F. J Biochem (Tokyo) 1993;114:535–540. doi: 10.1093/oxfordjournals.jbchem.a124212. [DOI] [PubMed] [Google Scholar]
- 85.Olshevskaya EV, Ermilov AN, Dizhoor AM. J Biol Chem. 1999;274:25583–25587. doi: 10.1074/jbc.274.36.25583. [DOI] [PubMed] [Google Scholar]
- 86.Maple JR, Huang MJ, Stockfisch TP, Dinur U, Waldman M, Ewig CS, Hagler AT. J Comput Chem. 1994;15:162–171. [Google Scholar]
- 87.Huang MJ, Stockfisch TP, Hagler AT. J Am Chem Soc. 1994;116:2515–2518. [Google Scholar]


