Abstract
Ira Hirsh was among the first to recognize that the auditory system does not deal with temporal information in a unitary way across the continuum of time intervals involved in speech processing. He identified the short range (extending from 1 to 20 milliseconds) as that of phase perception, the range between 20 and 100 milliseconds as that in which auditory patterns emerge, and the long range from 100 milliseconds and longer as that of separate auditory events. Furthermore, he also was among the first to recognize that auditory time perception heavily depended on spectral context. A study of the perception of sequences representing different temporal orders of three tones, by Hirsh and the author (e.g., Divenyi and Hirsh, 1978) demonstrated the dependence of auditory sequence perception on both time range and spectral context, and provided a bridge between Hirsh's view of auditory time and Bregman's view of stream segregation. A subsequent search by the author for psychophysical underpinnings of the cocktail-party phenomenon (e.g., Divenyi and Haupt, 1997) suggests that segregation of simultaneous streams of speech might rely on the ability to follow spectral changes in the demisyllabic-to-syllabic (100 to 200 milliseconds) range (i.e., Hirsh's long range).
Learning Outcomes: As a result of this activity, the participant will be able to (1) describe the importance of temporal processing in hearing; and (2) identify time ranges where the auditory system will spontaneously adopt different analysis techniques.
Keywords: Auditory time perception, multiple time ranges, peripheral versus central auditory processes, temporal order, stream segregation
Undoubtedly, one of the most widely cited papers in psychoacoustics history is Hirsh's 1959 article on auditory temporal order.1 The message this paper is most recognized for is the magic 20-millisecond (actually 17-millisecond) minimum interval between the onsets of two auditory events at which their temporal order can be accurately perceived. Nevertheless, the information conveyed by the article goes quite a distance beyond the 20-millisecond rule: it represents one of the earliest summary statements of the effect of temporal separation on the perception of two auditory stimuli, starting from phase effects in the microsecond range (affecting the perceived sound quality) up to the 20-millisecond limit (at which temporal order becomes discriminable) passing through the intermediate range (∼2 milliseconds, at which a fusion gives way to separation; i.e., the “oneness” versus “twoness” boundary). The article also predicts that it is this latter boundary that corresponds to the limit of auditory acuity—the ability to distinguish two objects on the basis of a qualitative difference along a given attribute continuum. As such, his prediction just barely underestimated temporal resolution limits obtained a decade or so later by way of computer-synthesized stimuli,2,3 which was unavailable in the late 1950s. Thus, the main finding of Hirsh's 1959 article was that a temporal separation between two stimuli that could lead to identifying them as two (whether or not one perceived the precise difference between them) was about one order of magnitude shy of the temporal separation needed for recognizing the temporal order of their appearance. The auditory system he postulated had to have multiple time windows—a term introduced much later—depending on the stimulus presented as well as on the task the listener is required to perform.
Of interest in retrospect, speaking from the viewpoint of someone from a scientific generation younger than Hirsh's, is that his concern for the perceptual translation of the dimension of auditory time led his thinking toward the temporal range of intervals above (rather than below) the temporal order threshold of two-event sequences. In the intervening time, research has firmly established the primary role of the auditory periphery in the resolution of time intervals under 20 milliseconds; had Hirsh decided to study perception of sounds involving this shorter temporal range, he would have remained close to his very earliest interests in the ear and hearing also with regard to temporal analysis. However, our everyday acoustic environment abounds in sequences of auditory events, two classes of which—speech and music—were always high on the list of Hirsh's preoccupations. To recognize, identify, and classify these sequences, the auditory system must resort to analyzer mechanisms having time windows that are orders of magnitude longer than those found at the auditory periphery, and those mechanisms can only be located in the cortex. In fact, the integration time observed in the primary auditory cortex of the cat is in the order of 100 milliseconds,4 a structure also found to process sequences consisting of tones of up to 100 milliseconds.5 Another proof for the central location of these mechanisms was offered by Swisher and Hirsh,6 who demonstrated that a temporal lobe lesion, especially if it is accompanied by receptive aphasia, can lead to dramatically higher two-tone temporal order thresholds. Efron,7 using a deductive approach to determine what he referred to as the duration of auditory perception, arrived at a similar conclusion and a very similar duration (120 to 140 milliseconds).
The notion that sequences of sounds will generate different perceptual experiences as a function of the duration of the sounds was perhaps best enunciated by Hirsh in an unfortunately little-known chapter.8 In that chapter, Hirsh identified three time regions. The short temporal range encompasses events of 20 milliseconds and shorter; in this range changing the order of the component events will change the quality of the percept, due in most likelihood to the complex frequency-time interactions that occur at the peripheral stage of auditory analysis. Consisting of components of 100 milliseconds and longer, the long range permits the listener to hear the sequence as a series of clearly discernible separate events, such as syllable- or half-syllable-length speech sounds or distinct notes and chords in music, processed in most likelihood by cortical mechanisms. The intermediate region between the two extremes is one in which the sequence is perceived as a gestalt pattern that will change when the order of components is changed, such as consonant-vowel transitions in speech and arpeggios or vocal ornaments in music, falling possibly within the combined domains of peripheral and central auditory processing.
Although Hirsh presented the three temporal ranges in the context of temporal order perception, there is no logical need to restrict their use solely for that purpose. To the contrary, much research on, or related to, the psychology and the physiology of auditory time perception conducted over the last two decades has produced results reinforcing the notion that, for the processing of temporally complex acoustic stimuli, more than one mechanism must exist. Moreover, there is accumulating evidence to show that the borderlines between the temporal regions handled by the different mechanisms are identical, or at least very close, to the 20-millisecond/100-millisecond boundaries proposed by Hirsh. The aim of this article is to interpret some old and present some recent data showing the validity of Hirsh's temporal regions.
TEMPORAL ORDER OF THREE TONES IN A LONGER SEQUENCE: REVISITED
Identification of the pattern generated by the permutation of three pure tones was studied in a series of experiments.9 In one of the experiments, the three tones had the frequencies 891, 1000, and 1120 Hz (i.e., the notes “do-re-mi” encompassing a one-third-octave [major third] range centered at 1 kHz). Permutation patterns of these three tones were embedded in an eight-tone sequence in which the target tones were always temporally contiguous and the background tones were randomly selected from a two-third-octave range at each trial. Results showed that identification performance depended on two major factors: (1) the temporal position of the three-tone pattern within the eight-tone sequence, and (2) the distance between the frequency range of the pattern (i.e., 1 kHz) and that of the background. The duration of each tone, pattern, and background, was held constant within each block of trials. All tones were presented at the same clearly audible level of 75 dB sound pressure level (SPL). Identification data were collected for four experienced listeners at different tone durations. From the data, psychometric functions were constructed to estimate, by interpolation, the duration at which identification performance corresponded to either the d″ = 1.0 (corresponding to a performance level that leaves listeners frustrated) or the d′ = 2.0 level (a more satisfactory performance level).
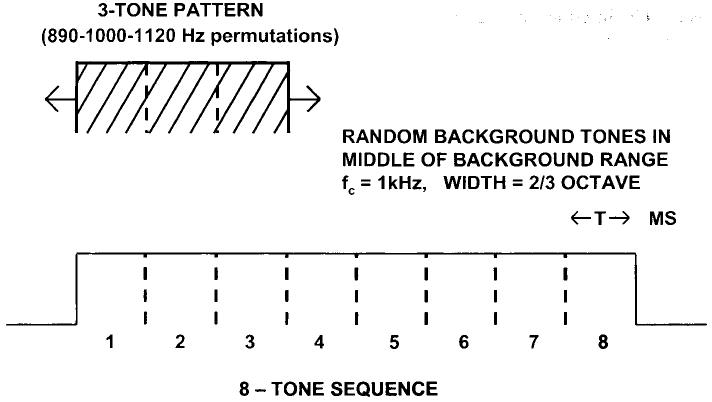
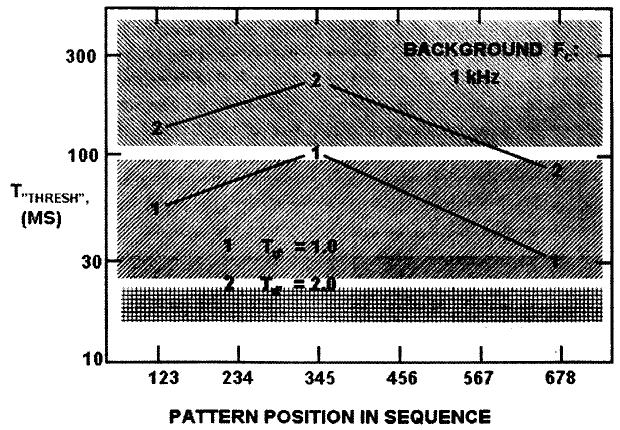
In one experiment, the background frequency range also was centered at 1 kHz (i.e., the frequency range of the pattern was situated in the middle of that of the background) thereby making the identification of the pattern most difficult. As illustrated in Figure 1, the temporal position of the pattern changed from condition to condition. Actually, we investigated only three such positions, with the pattern at the very beginning (positions 1-2-3), the very end (positions 6-7-8), and in the middle (positions 3-4-5) in the sequence of eight tones. Averaged results for the four listeners (i.e., tone durations to achieve a d′ = 1.0 or d′ = 2.0 performance) as a function of pattern temporal position are shown in Figure 2, with the three differently shaded rectangles indicating the three time ranges of Hirsh. As expected, the condition in which the pattern was in the temporal middle of the sequence necessitated the longest tonal component durations: 100 milliseconds per tone for the d′ = 1.0 and ∼250 milliseconds (i.e., syllable length) for the d′ = 2.0 level. Both durations fall into Hirsh's long range—the listeners were able to identify the pattern only when they could hear each of the eight tones separately. However, when the pattern was at the end of the sequence—the easiest condition because of our strongly enhanced memory for most recent events—the pattern was identifiable for durations that fall into Hirsh's intermediate range, suggesting that the subjects based their decision on melodic contour (i.e., a gestalt). The same decision strategy also was evident for the condition where the pattern was at the beginning of the sequence, apparently easier to identify because of our somewhat enhanced memory for the first in a series of events, although only for the lower d′ = 1.0 performance criterion. For the higher performance level, subjects needed to hear each tone separately because the duration per component fell, again, into Hirsh's long range.
Figure 1.
Schematic time diagram of the stimulus presented in the first experiment. The sequence of eight tones, each having a duration of T ms, contain the three-tone pattern that is represented by one of the permutations of the three frequencies 891, 1000, and 1120 Hz. The frequency of the remaining five tones is randomly selected from a two-thirds-octave frequency range also centered at 1 kHz. The temporal position of the pattern varies from condition to condition.
Figure 2.
Results of the first experiment: average data of four experienced listeners. The abscissa indicates the temporal position of the three-tone pattern inside the eight-tone sequence; the ordinate is the estimated duration necessary to identify the pattern at either a d′ = 1.0 or a d′ = 2.0 performance level. The three shaded areas correspond to Hirsh's three time ranges.
The pattern could not be placed in any temporal position within the sequence to have the subjects identify it at durations short enough to fall into the shortest range, suggesting that when the frequency ranges of the pattern and the interfering background completely overlap, sound quality alone provides insufficient information for identifying the permutation pattern. It should be emphasized that this experiment used the least favorable spectral configuration: one in which the frequency ranges of the pattern and the background maximally overlapped. Other experiments showed that separating the two frequency ranges improved performance (i.e., it was possible to achieve pattern identification at shorter tone durations for all temporal positions of the pattern within the sequence).
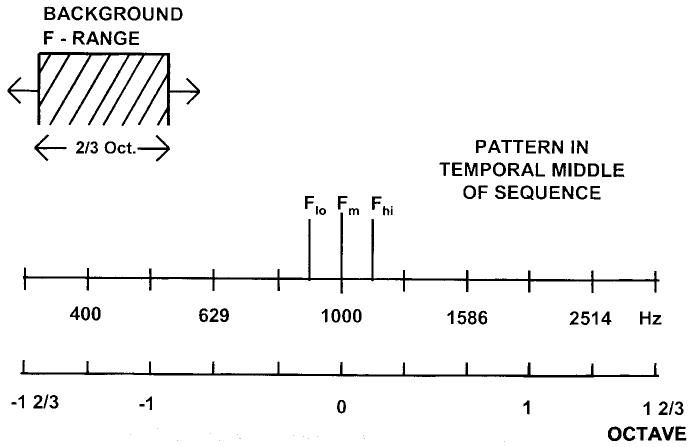
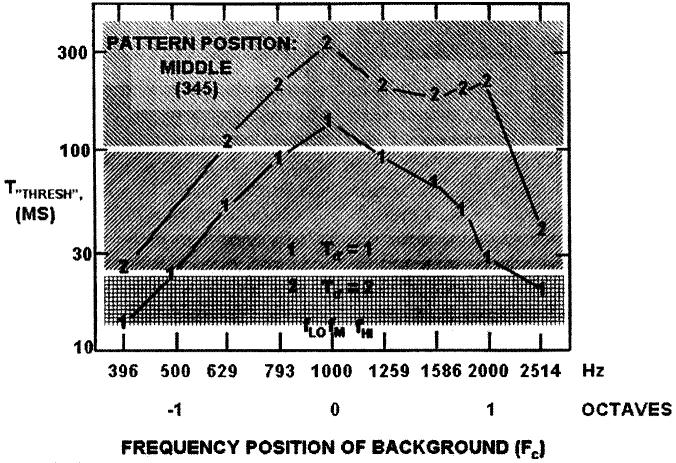
In another experiment, the three-tone pattern was always placed in the most difficult temporal position (tones 3, 4, and 5 in the sequence of eight) and the position of the two-thirds-octave range of background tones was moved on the frequency axis from condition to condition, as illustrated in Figure 3. In the two most extreme conditions, the background center frequency was 1 2/3 octaves above or below the 1-kHz pattern center frequency. The average duration per tonal component that allowed the four listeners to identify the pattern at the d′ = 1.0 and d′ = 2.0 performance levels is illustrated as a function of the center frequency of the background in Figure 4. Again, the three time regions of Hirsh are marked as three differently shaded areas. The results indicate that, when the background center frequency also is 1 kHz, component durations must be in the long range to achieve either performance criterion. To operate at the d′ = 2.0 level, durations must exceed the 100-millisecond boundary as long as the background frequency range is near that of the pattern. This effect persists for larger pattern-background separations when the background is above rather than when it is below the pattern frequency range. Contrary to energetic masking, higher-frequency tones in a sequence are more salient than lower-frequency tones.10 When the background range moves farther away from the pattern range, the duration necessary to reach the criterion levels fall into the intermediate range, suggesting that listeners are able to extract gestalt properties of the sequence. At extreme spectral positions of the background above or below the pattern, listeners were able to perform at the d′ = 1.0 level when the component durations were in the short range (i.e., below 20 milliseconds). At such extreme frequency distances, the background ceased to interfere with the perceived quality of the pattern that was characteristic to any given three-tone permutation. Again, we wish to emphasize that this experiment used the least favorable temporal configuration: one in which the pattern was in the very middle of the sequence. Other experiments showed that placing the pattern either at the start or at the end of the sequence improved performance: It was possible to achieve pattern identification at shorter tone durations for all spectral separations between pattern and background.
Figure 3.
Schematic frequency diagram of the stimulus presented in the second experiment. The three pattern tone frequencies (891, 1000, 1120 Hz) are shown in the middle of the frequency scale (in log Hz and octaves), above which the two-thirds-octave wide background frequency range is shown. The position of the background range frequency scale varies from condition to condition. The temporal position of the pattern is in the middle of the eight-tone sequence.
Figure 4.
Results of the second experiment: average data of four experienced listeners. The abscissa indicates the center frequency of the background; the ordinate is the estimated duration necessary to identify the pattern at either a d′ = 1.0 or a d′ = 2.0 performance level. The three shaded areas correspond to Hirsh's three time ranges.
In sum, identification of the permutation of three tones (subsuming a frequency range barely larger than a critical band) embedded in an eight-tone sequence is maximally compromised when the three-tone pattern is in the temporal middle of the sequence and when the frequency ranges of the pattern and the background even partially overlap. In such cases identification of the pattern is possible only when the duration of each component tone is sufficiently long for the listener to hear the tone as an individual event. Separating the frequency ranges and/or placing the pattern at the beginning or, preferably, the end of the sequence allows identification even at durations at which gestalt properties of the pattern, or of the pattern within the background, are recognizable. Identification of the pattern at component durations at which phase effects will introduce qualitative changes is possible only when spectral and temporal overlap between the pattern and the background are eliminated.
PERCEPTUAL SEGREGATION OF TWO SPEECH-LIKE SOUNDS WITH ASYNCHRONOUS FORMANT TRANSITIONS
In an attempt to isolate some of the processes responsible for the cocktail-party effect (i.e., the ability to understand speech of a target speaker in a background of speech by several other speakers), we have been conducting experiments to find out how listeners are able to perceptually segregate two simultaneously presented sounds with certain speech-like features. One set of experiments investigated segregation of pairs of sinusoidal complexes, each having a particular fundamental frequency (f0) and a single formant peak generated by passing each complex through a 6-dB/octave bandpass filter having a particular center frequency (F). The f0 of the lower sound was 107 Hz (an average male voice pitch) and that of the other was either 136 Hz (a relatively high male voice, about a major third higher than the lower f0) or 189 Hz (a female voice pitch, about a minor seventh higher); their mixed ensemble formed two streams that were identifiable on the basis of their respective pitch as well as the particular formant. In both sounds, harmonic components outside the 500- to 3500-Hz range were eliminated. Subjects were instructed to attend to one of the streams and report the way the formant of that stream changed in the two intervals of a two-interval forced-choice trial. The formant peaks in the two streams had different frequencies, FLow and FHigh, in both presentation intervals; however, the stream with the low formant frequency in the first interval was given the high formant frequency in the second, and vice versa. According to our definition, a correct decision was only possible if the formant frequency and the fundamental frequency were correctly associated, which in turn was only possible if the two streams were perceptually segregated. The experiment's goal was to determine the minimum formant frequency difference for stream segregation 79% of the time.
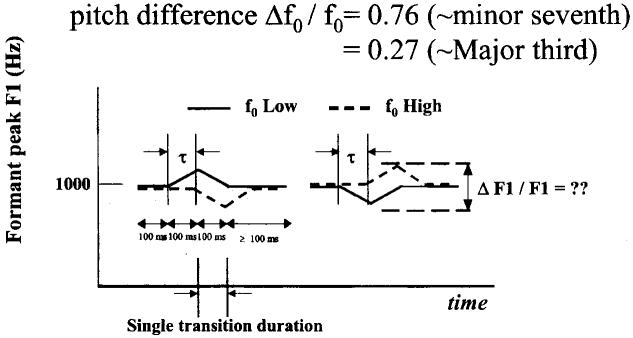
In one earlier experiment,11 it was observed that introduction of a 200-millisecond up-down or down-up transition in the formant F in the middle of 400-millisecond streams improved their segregation. However, since formant transitions of multiple speakers in a true cocktail party setting rarely if ever occur in simultaneity, in the experiment reported below we assessed segregation of two streams for conditions in which the transition pattern in one of the streams was delayed between 25 and 200 milliseconds with respect to the transition pattern in the other stream. The measure of segregation in this experiment is the distance between the formant peaks in the two streams, at the point at which their excursion is the largest. The diagram of the stimulus is illustrated in Figure 5.
Figure 5.
Schematic spectrogram-type diagram of the two observation intervals of the stimulus in the third experiment. The continuous lines represent formant peak contours of the two streams: the low-fundamental frequency stream is shown as a solid and the high as a dashed line. In both intervals the formants of the two streams start with no difference. In one stream, after 100 milliseconds at the initial formant frequency, a 100-millisecond upward transition is followed by a 100-millisecond downward transition back to the initial frequency for another 100 milliseconds plus a variable interval τ. At the same time, the other stream has the same initial formant frequency for 100 milliseconds plus a variable delay τ (the asynchrony) followed by a 100-millisecond downward transition followed by a 100-millisecond upward transition back to the initial formant peak for a final 100-millisecond transition. The direction of transitions in the second observation interval is reversed in both streams. The stream in which the delay occurs is randomly chosen at each trial. The frequency excursion in the two streams is adaptively varied during a block of trial, to determine the excursion at which the transition pattern (up-down or down-up) can be correctly associated with a given stream (low- or high-fundamental frequency); that is, the two streams can be segregated, at the 79% correct threshold level.
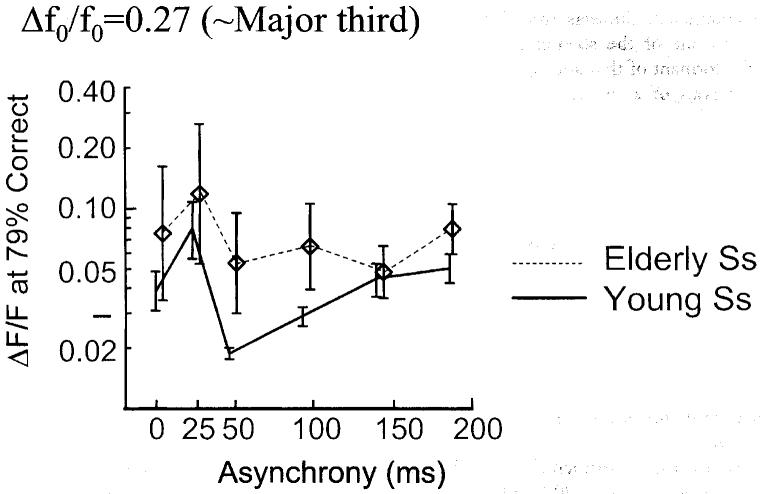
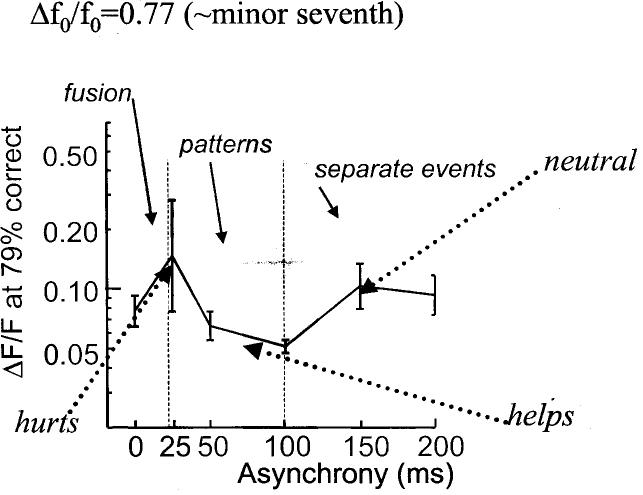
Average formant-swing separations at segregation threshold for six experienced young and five elderly listeners in the conditions with the pitch in the two streams a major third apart are shown as a function of formant transition asynchrony, τ, in Figure 6. Similar results are shown for the same listeners in conditions, with the pitch in the two streams a minor seventh apart in Figure 7. All data should be considered in comparison with the no-asynchrony (τ = 0) condition at the leftmost point in each figure. The interesting observation, and the take-home message, in both figures is the similar and almost identical course of the segregation threshold curves. The points of inflection are highlighted by the arrows. They suggest that small (25 milliseconds) asynchronies degrade the performance, possibly because peripheral temporal integration in Hirsh's short range takes away the spectral-temporal identity of the transitions in the two streams. On the other hand, asynchronies in Hirsh's intermediate range (i.e., between 50 and 100 milliseconds), improve segregation performance as compared with the synchronous condition, in most likelihood due to a gestalt pattern that may emerge from the transitions in each stream or in the ensemble of the two streams. Finally, at asynchronies longer than 100 milliseconds performance returns to a level comparable to the synchronous transition condition, suggesting that in Hirsh's long range at least the leading 100-millisecond transition is heard alone. Thus, despite the nonoptimal choices of asynchrony values (i.e., no asynchronies shorter than 25, between 50 and 100, or between 100 and 150 milliseconds were used), the inflections in the asynchrony curves are in more than just qualitative agreement with the boundaries between Hirsh's three time ranges.
Figure 6.
Average results of six experienced young listeners (solid lines) in the third experiment, with the two streams having a 27% (i.e., about a major third) fundamental frequency difference. The abscissa denotes the asynchrony between transition onsets of the two streams, whereas the ordinate stands for the peak-to-peak formant frequency swing at segregation threshold. In addition to the young subjects' data, results of five elderly listeners also are shown (broken lines and diamond symbols).
Figure 7.
Similar results for the conditions where the fundamental frequency difference between the two streams is 77% (i.e., about a minor seventh). The dotted lines with the arrows point to the effect of asynchrony with respect to the no-asynchrony condition. The boundaries between Hirsh's three time ranges (fusion, patterns, and separate events) also are indicated (at 20 and 100 milliseconds).
DISCUSSION
We have shown that the three time ranges, originally suggested by Hirsh8 to explain human perception of auditory temporal order, are an effective tool to analyze our old data on the identification of three-tone permutations embedded in a sequence of random-frequency tones. However, we have shown that the same three-region classification also is validated by data where complex temporal relationship between complex mixtures of complex sounds are substituted for temporal order of pure tones. We would like to propose that Hirsh's three temporal regions offer a logical and convenient way of looking at auditory temporal processing and their mechanisms in general: The auditory periphery is assigned the responsibility for short-range (20 milliseconds and below) temporal analysis, whereas the central auditory system, quite probably including cortical structures beyond the primary auditory cortex, processes temporal information of stimuli having durations of 100 milliseconds and longer. Bridging these two ranges, there is a third that translates auditory time between 20 and 100 milliseconds into the language of patterns, governed by gestalt principles. The mechanisms involved in processing signals in this range are likely to be both peripheral and central, but it also is possible that they could constitute the domain of brainstem and other subcortical structures.
The experimental data presented in the preceding paragraphs compels the reader to make the observation that results of the Divenyi and Hirsh (1978) article9 and those12 shown in Figures 5, 6, and 7 are in apparent contradiction. The temporal order judgments of three tone patterns embedded in an eight-tone sequence shown in Figures 2 and 4 suggest that the three regions seamlessly blend into one another. In fact, the sole indication that there are different time ranges involved in solving the task, depending on the duration of the tones, comes from observing that the duration needed in the most difficult condition (when the pattern sits in the temporal and spectral middle of the background) is clearly in long range (as reported by Warren et al13), whereas those needed in the easiest condition (when the background frequency range is far away from that of the pattern, especially when the pattern is also at the very end of the sequence) is clearly in the short range. The smooth transition of the necessary durations from one range to another suggests that temporal processing in the perception of tone sequences will simultaneously use a weighted sum of both the peripheral and the central mechanisms, with the weight reflecting the efficiency of each. Simultaneous effects of the two mechanisms are present in the intermediate range, in which gestalt qualities of the sequences can be extracted. The fact that elderly listeners often require markedly elevated durations for the perception of temporal order14-16 suggests an age-related decrease of the ability to extract gestalt-based patterns from auditory sequences.
In contrast, perception of the formant FM-transition patterns in the two harmonic-complex streams shows a nonmonotonic course of performance as a function of the degree of asynchrony of the formant patterns (Figs. 6 and 7). Performance at large asynchronies (150 and 200 milliseconds) is about the same as with no asynchrony, suggesting that in both cases listeners were able to follow each 100-millisecond up- or down-trajectory of the formants separately (Fig. 5). More interesting is the worsening of performance at the shortest asynchrony tested (25 milliseconds) and a marked improvement between 50 and 100 milliseconds. The elevated FM-swing threshold at the 25-millisecond asynchrony can only signify that when the formant frequencies change almost, but not quite, simultaneously in the two streams, their trajectories interfere with each other because they are integrated by the same peripheral time window. In other words, the information that could distinguish the high- and the low-f0 streams is processed by time windows with large overlapping areas, resulting in mutual masking of the formant patterns. When the asynchrony is in the intermediate range, listeners do better than in the zero-asynchrony condition because they can extract the gestalt represented by the combined formant-contour temporal patterns of the two streams. Results of the elderly listeners in Figure 6 indicate no performance improvement in this range, suggesting that they may not be able to extract the gestalts from the two streams.
Some might say that the three-range classification is overly simplistic, given that there is much evidence that the earliest physiological responses to sound, as demonstrated by the buildup and decay of neural adaptation,l7 are themselves composite. Similarly, it is also difficult to specify an upper limit to the long range. Recent electrophysiological studies in human subjects have uncovered differentiated cortical responses for different melodic sequences as long as 32 seconds (Scott Makeig, personal communication, 1998). But incomplete as it may be, the three-range classification has an the enormous explanatory power that extends far beyond that for which it was intended.
Many of Hirsh's data and ideas that grew out of an extraordinarily rich and long scientific career have become standards, norms, household words, or much-quoted pieces of wisdom. Thus, it would not be surprising if the three time ranges identified by him were to become generally adopted as a simple way to analyze and understand auditory phenomena of all sorts—in the laboratory as well as in the real world of people speaking or playing music, two- and four-legged animals communicating, and gadgets producing sounds that, like or dislike, we have to live with.
ACKNOWLEDGMENTS
Preparation of the manuscript and the research on which it was based was supported by the National Institute of Neurological Diseases and Stroke, the National Institute on Aging and the Veterans Affairs Medical Research. Parts of the data have been presented at the 17th International Congress on Acoustics in Rome, in September 2001, and at the 143rd Meeting of the Acoustical Society of America in Pittsburgh, PA, in June 2002. The author wishes to thank Drs. Judith Lauter and Brian Gygi for their inspiring comments on an earlier version of the this article.
REFERENCES
- 1.Hirsh IJ. Auditory perception of temporal order. J Acoust Soc Am. 1959;31:759–767. [Google Scholar]
- 2.Patterson JH, Green DM. Discrimination of transient signals having identical energy spectra. J Acoust Soc Am. 1970;48:894–905. doi: 10.1121/1.1912229. [DOI] [PubMed] [Google Scholar]
- 3.Green DM. Temporal auditory acuity. Psychol Rev. 1971;78:540–551. doi: 10.1037/h0031798. [DOI] [PubMed] [Google Scholar]
- 4.Schreiner CE, Urbas RV. Representation of amplitude modulation in the auditory cortex of the cat. I. The anterior auditory field (AAF) Hear Res. 1986;21:227–241. doi: 10.1016/0378-5955(86)90221-2. [DOI] [PubMed] [Google Scholar]
- 5.Brosch M, Schreiner CE. Sequence sensitivity of neurons in cat primaly auditory cortex. Cereb Cortex. 2000;10:1155–1167. doi: 10.1093/cercor/10.12.1155. [DOI] [PubMed] [Google Scholar]
- 6.Swisher LP, Hirsh IJ. Brain damage and the ordering of two temporally successive stimuli. Neuropsychologia. 1972;10:137–152. doi: 10.1016/0028-3932(72)90053-x. [DOI] [PubMed] [Google Scholar]
- 7.Efron R. The minimum duration of a perception. Neuropsychologia. 1970;8:57–63. doi: 10.1016/0028-3932(70)90025-4. [DOI] [PubMed] [Google Scholar]
- 8.Hirsh IJ. Temporal order and auditory perception. In: Moskowitz HR, Scharf B, Stevens JC, editors. Sensation and Measurement: Papers in Honor of S. S. Steven. D. Reidel; Dordrecht, The Netherlands: 1974. pp. 251–258. [Google Scholar]
- 9.Divenyi PL, Hirsh IJ. Some figural properties of auditory patterns. J Acoust Soc Am. 1978;64:1369–1385. doi: 10.1121/1.382103. [DOI] [PubMed] [Google Scholar]
- 10.Watson CS. Factors in the discrimination of word-length auditory sequences. In: Hirsh SR, Eldredge DH, Hirsh IJ, Silverman SR, editors. Hearing and Davis: Essays Honoring Hallowell Davis. Washington University Press; St. Louis, MO: 1976. pp. 175–189. [Google Scholar]
- 11.Divenyi PL, Carré R, Algazi AP. Auditory segregation of vowel-like sounds with static and dynamic spectral properties. In: Ellis DPW, editor. IEEE Mohonk Mountain Workshop on Applications of Signal Processing to Audio and Acoustics. Vol. 14. IEEE; New Paltz, NY: 1997. pp. 1–4. [Google Scholar]
- 12.Divenyi PL. Book of Abstracts, 17th International Congress on Acoustics. Rivist Ital Acust; Rome, Italy: 2001. Auditory segregation of streams with asynchronous single-formant transitions; p. 255. [Google Scholar]
- 13.Warren RM, Obusek CJ, Farmer RM, Warren RP. Auditory sequences: confusion of patterns other than speech and music. Science. 1969;164:586–587. doi: 10.1126/science.164.3879.586. [DOI] [PubMed] [Google Scholar]
- 14.Divenyi PL, Haupt KM. Audiological correlates of speech understanding deficits in elderly listeners with mild-to-moderate hearing loss. I. Age and laterality effects. Ear Hear. 1997;18:42–61. doi: 10.1097/00003446-199702000-00005. [DOI] [PubMed] [Google Scholar]
- 15.Divenyi PL. Beyond presbyacusis: non-hearing loss-related temporal processing deficits in the elderly. J Acoust Soc Am. 2000;107:2796–2797. [Google Scholar]
- 16.Fitzgibbons PJ, Gordon-Salant S. Auditory temporal processing in elderly listeners. J Am Acad Audiol. 1996;7:183–189. [PubMed] [Google Scholar]
- 17.Smith RL, Brachman ML, Goodman DA. Adaptation in the auditory periphery. Ann N Y Acad Sci. 1983;405:79–93. doi: 10.1111/j.1749-6632.1983.tb31621.x. [DOI] [PubMed] [Google Scholar]


