

Abstract
In this work we present a new method for investigating local energy minima on a protein energy landscape. The CABS (CAlpha, CBeta and the center of mass of the Side chain) method was employed for generating protein models, but any other method could be used instead. Cα traces from an ensemble of models are hierarchical clustered with the HCPM (Hierarchical Clustering of Protein Models) method. The efficiency of this method for sampling and analyzing energy landscapes is shown.
Keywords: hierarchical clustering, protein folding, protein lattice model, Monte Carlo sampling, homology modeling, energy landscape
1. Introduction
In last decades many methods have been designed for protein simulations. These methods cover a wide range in accuracy and computational efficiency. Thanks to simple lattice models it is possible to investigate protein kinetics and thermodynamics1. Full atom models allows one to accurately sample around a given protein conformation. High resolution lattice models2 are the tradeoff between computational costs and the quality of resulting models. For instance, it has been shown that the CABS3 model is able to produce very good results in comparative modeling as well as in ab initio case4.
In protein simulations many obstacles must be handled. Current energy functions are inaccurate and the correct identification of native-like structure remains a challenging task. Force fields used in protein simulations usually reflect only energy terms, neglecting the entropy. The idea behind clustering of protein structures is to take those entropic effects into account5. Since the native fold lies rarely in the global minimum, a sampling method should report not only the global but also local minima of comparably low energy. The problem of local minima in conformational space is closely related to generating protein decoys. Libraries containing many (usually several thousands) conformations6,7 of the same protein are useful in force field tuning and testing folding hypothesis. There is however a trade-off between the variety of decoys in such a library and the number of stored models. One wants to keep all conformations that can compete with the native state while at the same time keeping the library reasonably sized.
In this paper we show that clustering of protein structures can help in dealing with this problem. We generate a large number of protein conformations using the CABS modeling tool. In the next step we select those structures whose energy and gyration radius are close enough to the native state. Neither energy nor radius of gyration are able to distinguish between native and non-native conformations, but they allow one to exclude structures representing un-interesting local minima. The remaining structures are then clustered with the HCPM8 method.
2. Methods:
2.1. CABS as a sampling tool
CABS is a high-resolution lattice model. Each amino acid is represented by four interaction centers - Cα̣(CA), Cβ(B), the center of mass of the side chain (S) and the center of the peptide bond. Positions of alpha carbons are restricted to the simple cubic lattice with lattice spacing equal to 0.61Ǻ. There are 800 possible Cα - Cα vectors which prevents adverse lattice effects such as anisotropy. Beta carbons are located off-lattice and their positions are defined by the position of alpha carbons (three consecutive alpha carbons determine the location of the central beta carbon). The position of the center of mass of the side chain depends on the local secondary structure (compact or expanded). An additional “atom” is placed in the center of the virtual Cα - Cα bond and is used in hydrogen bonds definition.
The force field for the CABS model consists of several elements. A detailed description is given elsewere3. Here, we only give a brief summary.
Generic short range interactions are used to reduce the conformational space and distinguish the protein model from a generic flexible polymer. Sequence dependent short range sequence potential terms derived from the PDB database control the r(i,i+2), r(i,i+3) and r(i,i+4) distances between Cα atoms.
Sequence dependent pairwise long-range interactions between the side-groups are context-dependent and take into account the identity of interacting groups, their spatial separation, mutual orientation and the geometry of corresponding fragments of the main chain. In that way complex multibody effects are accounted for in an implicit way.
In this work we are interested in sampling substantial parts of the energy landscape. A sampling scheme should visit as many local minima - all of them competing with the native structure - as possible. Therefore we used parallel tempering9,10, known also as Replica Exchange Monte Carlo11. This algorithm increases sampling of low-energy configuration by enforcing a random walk in temperature. At high temperatures the system can easily overcome energy barriers and new minima can be found when the replica moves back to low temperatures.
2.2 Hierarchical clustering
Clustering procedures12 combine elements into groups, according to a defined distance measure. These methods have already been used in context of protein structures5,13.
In the hierarchical clustering a binary tree is created that reflects the spatial proximity between structures. At beginning each structure forms a separate cluster. In the elemental step of an iterative procedure, the pair of closest clusters is found and combined into a new cluster. The distance between the two merged clusters is called the ‘merging distance’ and denoted as r. With the progress of the clustering, the average size of clusters increases and the number of clusters decreases. The procedure is stopped at a threshold value of r, say rC, provided by the user. The HCPM program8 however conducts the clustering procedure until a single cluster remains i.e. there is no critical value of rC used. The user retrieves clusters for any rC value without any addition computational cost since the binary tree is stored in an external file.
For each cluster, HCPM provides a single structure representing it. Such a representative is defined as a structure which is the closest to the average distance map of the cluster. The map is calculated by averaging corresponding inter-atomic distances in a cluster. The representative structure is created only as an output in the final stage of the algorithm. The distance between two clusters (which must be computed at every clustering step) is defined as the smallest distance (crmsd) between any member of the first cluster and any member of the second cluster. That value is checked in a look-up table. Before the clustering procedure starts, crmsd between any two structures are computed and stored in a computers’ memory. This step takes approximately 60% of all calculations.
The program is free for academic uses and can be downloaded from our website (http://biocomp.chem.uw.edu.pl/HCPM). A detailed description of HCPM can be found on this website as well as in Ref. 8.
3. Results
For this work we have selected for our test set five proteins, 1ten, 2gb1, 4mba 256bA (See Table 1), which reflect major architectures observed in proteins.
TABLE 1.
Proteins used in simulation
| Protein PDB code | Number of residues | Protein type | Name |
|---|---|---|---|
| 1ten | 89 | beta | tenascin |
| 256bA | 106 | alpha | cytochrom b562 |
| 2fdx | 131 | alpha/beta | flavodoxin |
| 2gb1 | 56 | alpha/beta | protein G, domain B1 |
| 4mba | 146 | alpha | myoglobin |
For each of the proteins we perform a long simulation according to the parallel tempering protocol. Our simulations use 15 replicas, with 300 000 Monte Carlo steps for each replica. Temperatures for replicas are adjusted after short initial trial simulations to maximize the flux14 of conformations between replicas and obtain the fastest sampling. We use that the optimal flux is achieved when the frequency of replicas-swapping is constant for each pair of adjacent replicas. Replicas are exchanged every 100 steps. For each protein 45 000 conformations have been saved in the final run. No homology information (any template structure) is used during the simulations.
Only a fraction of the conformations is subjected to clustering as our algorithm is based on spatial similarity. Partially, or even fully unfolded conformations are very diverse. They usually come from high temperature replicas, where sampling is fast and conformations differ strongly one from each other. Hence, they do not form any clusters. Consequently, for the further analysis we took only the collapsed configurations. For each protein we have calculated the distribution of the square radius of gyration. Structures that lay outside the peak of the distribution are filtered out. Approximately, half of the structures remain after this step and are subject to the final clustering. As an example, Figure 1 presents a cluster containing 101 conformations of protein 2gb1. The average value of the crmsd distance between centroid and the cluster members is 1.5Å. The distance between the native structure and the centroid is equal to 3.4Å. In this work we use an automatic method for selecting the rC value which is implemented in the HCPM program. The heuristics is based on the observation that in most cases the merging distance plotted as a function of a clustering step has a sigmoid shape. The clustering process is stopped at the center of the plateau region of this plot.
Figure 1:

Example cluster for 2gb1 protein. All cluster members are superimposed on the cluster centroid.
The five parts of Figure 2. correspond to the five proteins used in simulations (1ten, 256bA, 2fdx, 2gb1, 4mba respectively). Each part shows histograms of the crmsd (coordinate root-mean-square deviation) distribution: within clusters (A), between cluster’s centroids (B), and between structures remaining outside any cluster (C). Distribution (A) is composed of only one sharp peak. This reflects a high density of clusters. The average crmsd distance between any two structures belonging to the same cluster varies from 1.5Å (2gb1) to 2.5Å (4mba). This value depends mostly on the size of protein, and correlates well with a number of residues. Fitting to a linear function, we find that: (crmsd) = a × (number of residues) + b with a=0.0096, b=0.961, and the correlation coefficient = 0.92. The true dependence between crmsd and protein size is of course more complicated than linear. Several approaches to crmsd normalization have been proposed - for instance using radius of gyration computed for a random protein structure13 as a reference value. In our case however, crmsd values within a cluster are expected to be small. This is due to the idea and assumptions of clustering itself and therefore justifies our linear approximation. The crmsd distance between centroids of clusters (curves B) is much broader. Several maxima result from the variety of distinct fold topologies that have been visited during the simulations. The plots for all five proteins are similar to each other. This shows, that HCPM is able to find higher density areas in the configurational space of a sampled system.
Figure 2:
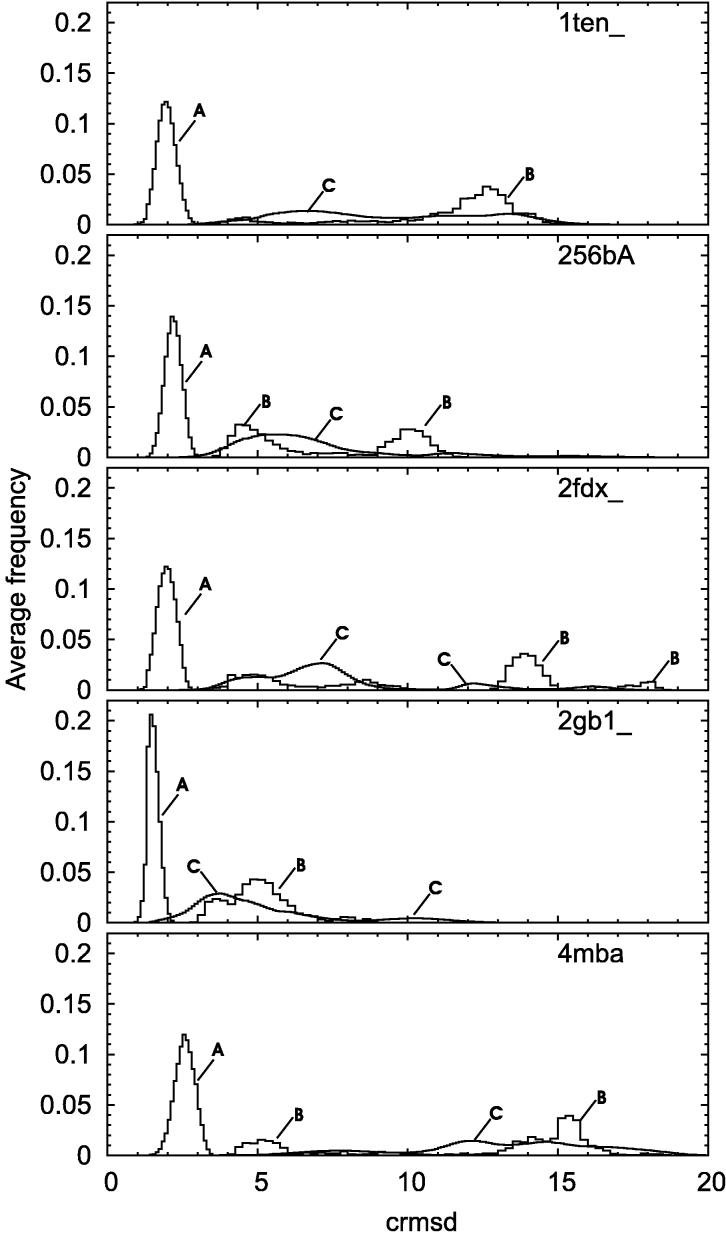
Histograms of crmsd distribution for one of the five proteins used in simulations: within clusters (A), between cluster’s centroids (B), and between structures remaining outside any cluster (C).
Figure 3. shows the energy versus crmsd dependence for two clusters as an example. Cluster members are denoted by black circles. Open circles stand for structures which do not belong to the cluster of interest, but are closer that 6Å from the centroid. The crmsd is measured from the centroid of the cluster (leftmost black circle). A representative structure for the cluster shown in the section A of the figure is 3.2Å from the native structure. The average distance between structures within the cluster is 1.9Å. Section B shows a cluster 11Å from native structure with 1.8Å average distance between its members. In both cases cluster members form a dense group of relatively lower energy than other structures outside the cluster. However, in the case B there are much fewer structures in a range of 6Å than in the case A. We conclude that local energy minima in the neighborhood of the native state are much closer to each other than the local minima located further away from the native structure. A huge ensemble of decoys, composed of many clusters starts from about 3Å. Moreover, it can be concluded from the data presented in Figure 2, that a close- to-native minimum is sharper than a minimum corresponding to structures that are distant from the native. We examined several other minima of both types (close and remote from native) and our data (not shown) confirm this conclusion. Although our reasoning is based only on one similarity measure the crmsd is the most popular one, and commonly recognized as a standard. Other function used for structural comparisons are more complicated, and in many cases it is impossible to prove that they satisfy even the triangle inequality.
Figure 3:
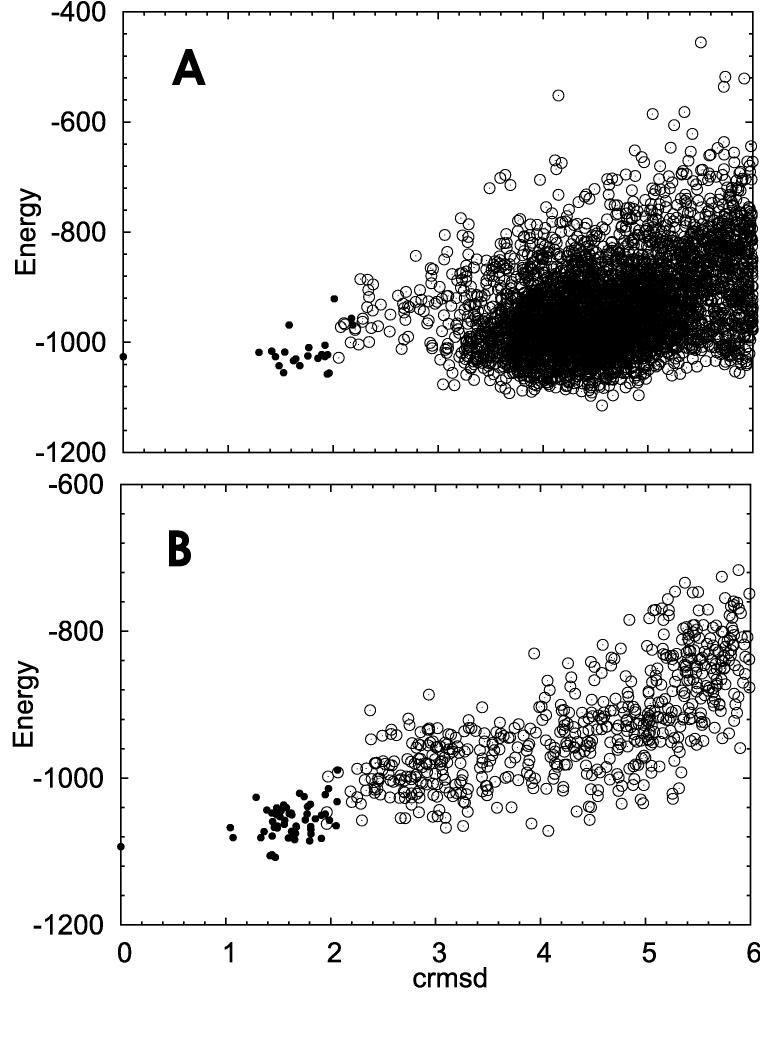
Energy versus crmsd dependence for two example clusters. The crmsd values were measured from the centroid of the cluster. Cluster members were denoted by black circles. Open circles stand for structures which do not belong to this cluster, but are closer that 6Å from the centroid. See details in the text.
Local minima for a very wide range of crmsd from the native structure often have comparable energy. This makes the clustering procedure an important step in protein modeling - a simple ranking according to the energy of decoys does not allow one to identify the best model. On the other hand, clustering enables selection of several structures corresponding to the local energy minima. Left afterwards with only several tens of structures, one can use more reliable (but also more computationally expensive) methods of the protein model evaluation based on complex geometrical criteria15 or on a all-atom force field.
4. Conclusions
We show that our clustering procedure is able to recognize these areas in the conformational space of a protein that feature a high density of states. All configurations belonging to a certain cluster are very close to each other and have on average lower energy than neighboring structures. Thus, each cluster corresponds to a certain local minima on the energy landscape. For the purpose of composing a structural library they can be replaced by a single representative. While the spectrum of distances between cluster’s representatives is broad, they are well separated one from each other. The corresponding structures reflect the manifold of distinct topologies sampled during the simulations. Hence, our clustering procedure allows for creating libraries of decoys, containing a wide variety of low energy structures.
Acknowledgments
This work was partially supported by a research grant from the National Institutes of Health (GM062838) and by Polish Ministry of Scientific Research and Information Technology (PBZ-KBN-088/P04/2003)
References
- Dill KA, Bromberg S, Yue K, Fiebig KM, Yee DP, Thomas PD, Chan HS. Prot. Sci. 1995;4:561–602. doi: 10.1002/pro.5560040401. [DOI] [PMC free article] [PubMed] [Google Scholar]
- Kolinski A, Skolnick J. Polymer. 2004;45:511–524. [Google Scholar]
- Kolinski A. Acta Biochimica Polonica. 2004;51:349–372. [PubMed] [Google Scholar]
- Kolinski A, Bujnicki JM.Proteins 2005(in press) [DOI] [PubMed]
- Shortle D, Simons KT, Baker D. Proc Natl Acad Sci U S A. 1998;95:11158–11162. doi: 10.1073/pnas.95.19.11158. [DOI] [PMC free article] [PubMed] [Google Scholar]
- Tsai J, Bonneau R, Morozov AV, Kuhlman B, Rohl CA, Baker D. Proteins. 2003;53:76–87. doi: 10.1002/prot.10454. [DOI] [PubMed] [Google Scholar]
- Park B, Levitt MJ. Mol. Biol. 1996;258:367–392. doi: 10.1006/jmbi.1996.0256. [DOI] [PubMed] [Google Scholar]
- Gront D, Kolinski A.Bioinformatics 2005(in press, published on-line)
- Hukushima K, Nemoto KJ. Phys. Soc. Jpn. 1996;65:1604. [Google Scholar]
- Geyer GJ. Stat. Sci. 1992;7:473–383. [Google Scholar]
- Gront D, Kolinski A, Skolnick JJ. Chem. Phys. 2000;113:5065–5071. [Google Scholar]
- Jain AK, Murty MN, Flynn PJ. ACM Comput. Surv. 1999;31:264–323. [Google Scholar]
- Betancourt MR, Skolnick JJ. Comp. Chem. 2001;22:339–353. [Google Scholar]
- Rathore N, Chopra M, de Pablo JJ. J. Comp. Chem. 2005;122:1–8. doi: 10.1063/1.1831273. [DOI] [PubMed] [Google Scholar]
- Sippl MJ. Proteins. 1993;17:355–362. doi: 10.1002/prot.340170404. [DOI] [PubMed] [Google Scholar]