Abstract
Solid phase amplification (SPA), a new method to amplify DNA, is characterized by the use of surface-bound primers. This limits the amplification to two-dimensional surfaces and therefore allows the easy parallelization of DNA amplification in a single system. SPA leads to the formation of small but dense DNA brushes, called DNA colonies. For a molecule to successfully duplicate itself, it needs to bend so that its free end can find a matching primer, located on the surface. We used Brownian dynamics simulations (with a united-atom model) to model the basic kinetics of an SPA experiment. The simulations mimic the temperature cycles and the molecule duplication process found in SPA. Our results indicate that the steric interaction between molecules leads to a decreased duplication probability for molecules in the center of a colony and to an outward leaning for the molecules on the perimeter. These effects result in slower amplification (compared to solution PCR) and indicate that steric interaction alone can explain the loss of the exponential growth (characteristic of solution PCR) of the number of molecules in an SPA experiment. Furthermore, the growth of the colony as a function of the number of thermal cycles is found to be similar to the one obtained with a simple Monte Carlo simulation.
INTRODUCTION
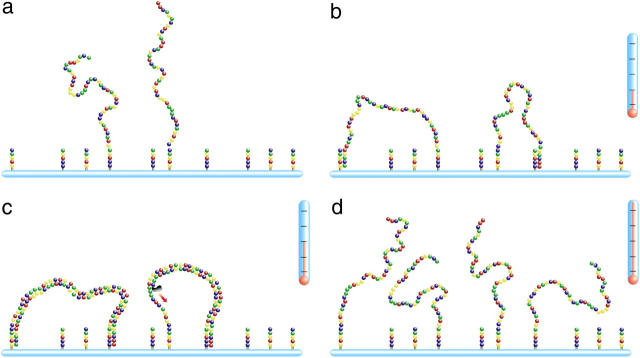
Solid phase amplification (SPA) is a new type of DNA amplification that has recently been introduced by two different groups: Adessi et al. (1) and Bing et al. (2). The central idea of this novel method is to attach the primers (via their 5′ end) to a solid surface (silica, polystyrene beads, …). Using a chemical mixture (containing the nucleotides and the polymerase) and temperature cycles similar to the ones used in polymerase chain reaction (PCR), it is possible to amplify the DNA template using these primers. Contrary to PCR, however, the copy is grafted to the two-dimensional surface and is always in the immediate vicinity of the original molecule (see Fig. 1). When used in an iterative manner, the amplification leads to the growth of a very dense but rather small DNA brush, i.e., a DNA colony. A detailed explanation of the SPA process and its differences with solution PCR can be found in Mercier et al. (3).
FIGURE 1.
Representation of one cycle of the solid phase amplification process. The solution is first heated to break the molecule into its two complementary fragments (a). The solution is then cooled down to allow the template to bind to the complementary grafted primers (b). Finally the solution is reheated to allow the polymerase to add nucleotides at the end of the primers and eventually make a complete complementary copy of the template (c). The solution is then reheated and a new thermal cycle is started (d). Those three steps are respectively called denaturation, annealing, and extension. SPA results in a spatially located ssDNA colony. Note that since a molecule always generates its complementary sequence in a thermal cycle, the two complementary branches will be present in the colony and two different types of primers have to be attached to the surface.
Polymer brushes have been extensively studied using theoretical approaches (4–7), scaling concepts (7–17), computer models (15,16,18–29), and experiments (30–37). However, most of those studies examined essentially infinite brushes (e.g., simulations use periodic boundary conditions, experiments use macroscopically large brushes, etc. …) and they focused almost exclusively on obtaining quantities such as the layer thickness and the density profile of the monomers. In the SPA context, the most relevant feature is the dynamics of the free end of the DNA molecule. Indeed, to duplicate successfully a molecule needs to bend so that its free end can find a matching primer before the next thermal cycle. Many effects can prevent a molecule's duplicating, thereby limiting the density of a colony. Electrostatic interactions, the finite size of the polymerase, the local concentration of polymerase and nucleotides, and primer rarefication can all prevent a molecule from duplicating. However, we believe that steric interactions between molecules would be the dominating effect limiting the density of a colony in SPA (3). In this article we will directly investigate the role of steric interactions in SPA. The most complete study of polymer free ends in a brush was made by Netz and Seidel (13,27–29), who used both molecular dynamics simulations and self-consistent field analysis. Not surprisingly, their study showed that the free end of a polymer in a brush is less likely to come close to the surface when the polymer surface concentration (often referred to as σ) is high (13,27–29).
Another important aspect of SPA is that the fringing molecules (i.e., the molecules on the perimeter) of the colony play a crucial role, because most of the growth of the brush occurs at its perimeter (the molecules at the center of the brush are less likely to bend). Few studies (38–40) have examined the dynamics of the molecules on the perimeter of a brush. Vilgis et al. (40) studied the edge effect in grafted polymer layers under compression using a Flory type approach (this problem is reminiscent of the end-tethered polymer compressed by an obstacle such as an AFM tip; see Refs. 41–43). They found that the length of the outward splay and the penetration depth of the edge effects are of a characteristic lengthscale ξ. For an uncompressed semi-infinite brush, ξ is found to be roughly the height of the brush. For smaller brushes of diameter  the splay is found to be weaker, whereas the edge effects were felt over the whole brush. Similar results are expected for the DNA colony found in SPA. However, SPA is a dynamical process where both the density and the size of the brush constantly change. Furthermore, the density of grafted molecules can be highly inhomogeneous (the center of the colony will tend to be denser than the perimeter). Note that in this article, the small brushes found in SPA will be called DNA colonies and a brush will always refer to a large brush, with a constant density over large distances.
Our first effort to model SPA consisted of a simple lattice Monte Carlo (MC) system, in which a given lattice site can either be occupied by one DNA molecule or left empty (we later refined our model to let many particles occupy the same site) (3). Using this model, we studied the growth, stability, and morphology of isolated DNA colonies under various conditions (including non-ideal effects such as the presence of sterile molecules and the random detachment of molecules). Our results indicated that, in most cases, SPA is characterized by a geometric growth and a rather sharp size distribution (in comparison with an exponential growth, and a very broad distribution for solution PCR) and we were unable to discriminate between many versions of it. Our MC algorithm was based on many educated assumptions lacking a solid foundation. The present article aims at testing some of those assumptions, estimating realistic values for some parameters of our MC model, and discriminating between the many versions of our MC model. Those tasks require a more microscopic approach (a molecular model) to the problem than the one we used for our MC model. We use the following strategies to address those issues. In Single Grafted Molecules and Small Regular Colonies, we successively study the dynamics of a single polymer and of small symmetric colonies using the algorithm presented in Method: Brownian Dynamics Simulations. We look at the average time that molecules spend close to the surface (when they are assumed to make contact with primers), and the average spatial distribution of those contacts, as a function of the chain density and distribution. In SPA Modeling, we look at the growth process of both DNA colonies and brushes (to model the uniform density over large distances, we use periodic boundary conditions). We find that the dynamics of molecules in a colony significantly differs from that found in brushes. Furthermore we find that the early growth of a colony cannot be described by either an exponential (like in solution PCR) or a geometrical growth (predicted by most of our MC models). In Monte Carlo Versus Brownian Dynamics, we use our results to optimize our previous Monte Carlo model and find very good agreement between the two models.
Note that SPA could also be compared to the clever “polony” technique developed by Mintra and Church (44–47). In this technique, one of the two primers is grafted to the fibers of a polyacrylamide gel film. The solution thus contains both free and grafted DNA templates and primers. However, because of the gel matrix, the diffusion of the free templates is very small, so the amplification remains spatially localized. After the amplification, typically consisting of 40 PCR cycles (44), each initial template is amplified to form a localized “polony” of up to 108 identical molecules (44). Like SPA, the “polony” technique leads to spatially located DNA amplification. However, the amplification mechanisms are different for the two techniques because of the three-dimensional and “diffusive” nature of the “polony” growth (i.e., a molecule does not have to bend to duplicate). When “polony” growth (number of molecules in a “polony” as a function of the number of PCR cycles) was modeled, an exponential growth for early amplification cycles, followed by a polynomial growth once most of the primers at the center of the “polony” were extended (neither the grafted nor the diffusing molecules can then reach the primers on the perimeter of the “polony”), was found (44). In SPA, the exponential growth phase is expected to be a lot shorter because of the strong steric interactions between neighboring molecules (3).
METHOD: BROWNIAN DYNAMICS SIMULATIONS
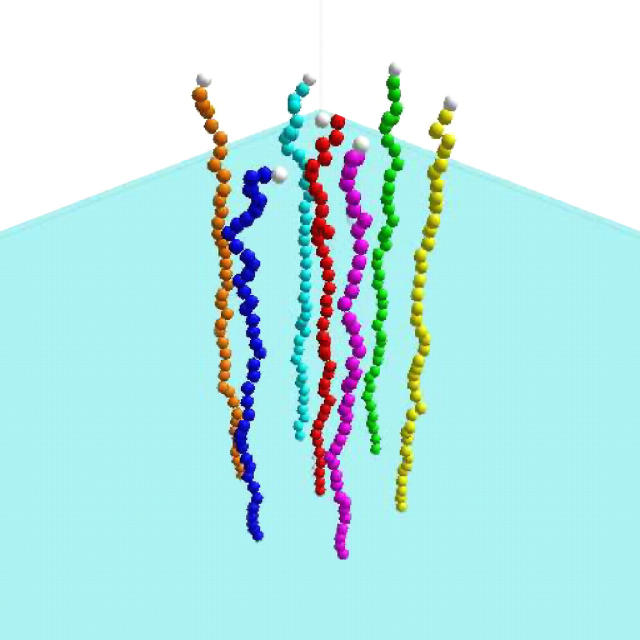
Our Brownian dynamics (BD) model is based on a bead-spring representation of an ssDNA molecule (see Fig. 2). This is a coarse-grained approach where the short-time dynamical effects, such as the vibrations of the C-H bonds, are neglected and where the effect of the solvent is modeled by a stochastic force fsto(t) and a friction coefficient ξ for each bead (48). The electrostatic and hydrodynamic interactions are also neglected. In this model, the equation of motion for a bead is reduced to the Langevin equation of motion,
 |
(1) |
where ξ is the friction coefficient and U the potential energy. Of course, this equation must reproduce the fluctuation-dissipation law Dξ = kBT (D is the diffusion constant and kBT the thermal energy); therefore the stochastic and frictional terms cannot be independent (48). Since we are interested in the long-time behavior, we can further simplify the model by working in the overdamped limit (accelerations are neglected). Equation 1 is thus reduced to
 |
(2) |
FIGURE 2.
Example of the system studied using our BD algorithm. The molecule is made of a series of beads (the monomers), linked with a FENE potential and interacting with a truncated Lennard-Jones potential. Each bead interacts with the grafting impenetrable wall (here in light blue) via the truncated Lennard-Jones. Here the system is a small regular brush made of a central molecule, surrounded by six others, regularly placed around the central one at a distance R = 7σ.
For a finite (but small) time step δt, Eq. 2 can be rewritten as
 |
(3) |
where  is the force applied on the bead and
  a random displacement due to collisions with the solvent molecules. Each component of
  is chosen independently from a Gaussian distribution of mean 0 and variance
To treat the polymer itself, we use a variation of the united atom model developed by Grest and Kremer (49), where a group of atoms is regrouped and replaced by a bead. A polymer is thus reduced to a series of beads linked to each other by springs. We use the finitely extensible nonlinear elastic (FENE) springs, and interacting via a truncated (we keep only the repulsive part) Lennard-Jones potential (49). The FENE potential energy for a spring connecting two consecutive beads reads
 |
(4) |
where LM is the maximum extension for the spring and kF the spring constant. For the Lennard-Jones potential, all beads interact with each other via the potential
 |
(5) |
when r < rc and 0 otherwise. Choosing rc = 21/6σ, the Lennard-Jones potential becomes purely repulsive (49). Furthermore, choosing LM = 1.5σ and kF = 30ε/σ2 ensures that bond crossing is prevented (49).
To perform dimensionless simulations, we use the fundamental units
 |
(6) |
All other necessary parameters are scaled and expressed in terms of the fundamental units described above.
SINGLE GRAFTED MOLECULES AND SMALL REGULAR COLONIES
In this section, we study an isolated grafted molecule and small regular colonies using the algorithm described in Method: Brownian Dynamics Simulations. Choosing the optimum ssDNA contour length for SPA is not trivial. Longer molecules will be able to hybridize much further from their grafting points and therefore delay the molecular crowding effects. Furthermore, the elongation phase (when a molecule is converted from a very flexible ssDNA to a fairly stiff dsDNA) would presumably be easier for longer molecules because such molecules suffer less from the internal stress building up as the dsDNA part grows. However, smaller molecules will tend to spend more time close to the surface (thus closer to the primers) and longer molecules have a greater chance of mishybridation on the primer. In this article, we chose to study the ssDNA length that was found to be experimentally optimum for SPA: ∼400 basepairs or ∼170 nm in contour length (1). However, it should be noted that unless the length is reduced below a critical value that prevents duplication, the kinetic is expected to remain similar for all lengths (only timescaling will change). Each DNA molecule is thus reduced to a polymer of Z = 39 beads (or monomers) and we use a time step of 0.0001 τ and kBT = ε. Since there is no explicit bending energy in our system, the persistence length is reduced to (approximately) the size of a single bead, σ. As a result, our molecule approximately corresponds to the ssDNA molecule of experimentally optimum (1) size of ∼400 basepairs or ∼170 nm (the persistent length of single-stranded DNA is ∼10 bases or ∼4 nm) (1).
The simulation itself starts with the molecule in a selected initial conformation (usually straight up). The first monomer of the molecule is grafted to an impenetrable surface. Each monomer interacts with the flat grafting surface (at z = 0) via the same truncated Lennard-Jones potential (Eq. 5). The simulation then follows Eq. 3 and the molecule relaxes. After a warmup time of TWU = 1000τ > trelax ≈ 140τ, whenever the free end of the molecule is close enough to the surface to touch a primer (i.e., if z < zmin = 2σ, approximately the size of a primer with ∼20 bases; see Ref. 1), the position of the last bead is recorded.
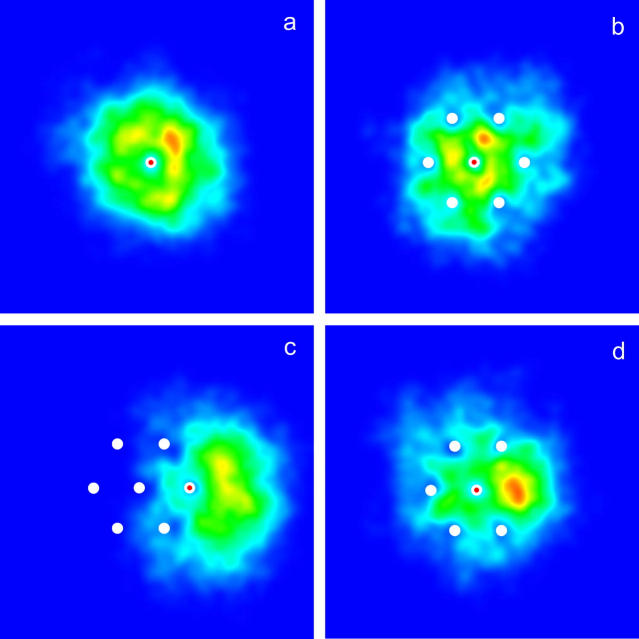
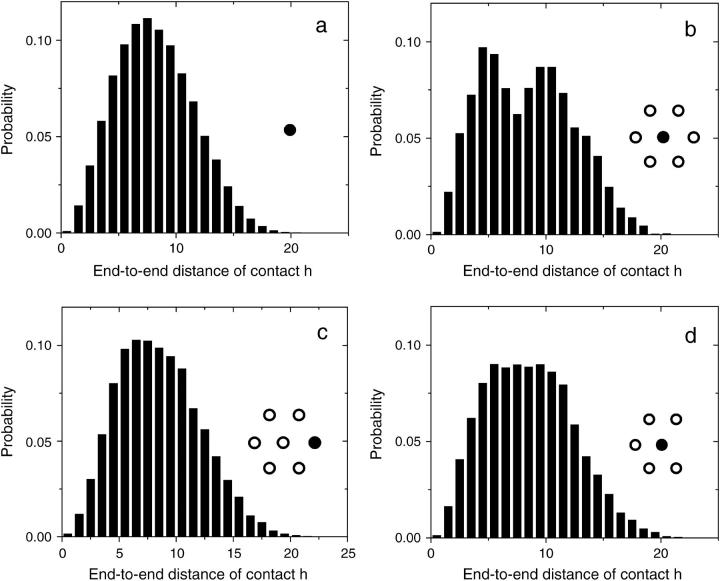
Using this algorithm, we study four different configurations. The first one is a single isolated molecule. Figs. 3 a and 4 a show a density plot and the corresponding distribution function for the end-to-end distances of the contacts (defined as the distance h, in the grafting plane, between the free end and the grafted monomer of a molecule,
 |
when zfree-end < zmin = 2). The average end-to-end distance of these contacts is 〈h〉 = 8.2(1). The free end of the molecule spends ∼3.35(5)% of its time in contact with the primers. When different lengths are considered, the time spent close to the surface decreases for longer chains. This can be understood by the increase in available space for longer molecules. The space available to a molecule is proportional to Rg3, whereas the available hybridization space near the surface only increases like Rg2. Therefore we expect the time spent close to the surface to decrease like 1/Rg ∼ N−ν, where N is the number of monomers and ν  is the Flory exponent. When contour lengths from 10σ to 250σ are considered (results not shown), an exponent of 0.66(9) is found, which is consistent with our scaling argument. These results explain why there is an optimum length for SPA and why longer molecules do not necessarily lead to a faster amplification.
FIGURE 3.
Density plot of the end-to-end distance (h) of the contacts of the free end of the molecules with the grafted primers for various configurations. The red and white dot represents the molecule being followed, whereas the white dots represent other grafted molecules. In a, a single molecule is considered. As expected the distribution is symmetric around the grafted monomer. In b and c, the central molecule and one of the molecules on the perimeter of the small symmetric brush (see Fig. 2) are considered. The effect of the other molecules can clearly be seen. In the case of the molecules on the perimeter, their free ends are pushed outwards, away from the other molecules. In d, the central molecule of a small brush missing one perimeter molecule is considered. The free end of the central molecule tends to occupy the space left empty by the missing molecule.
FIGURE 4.
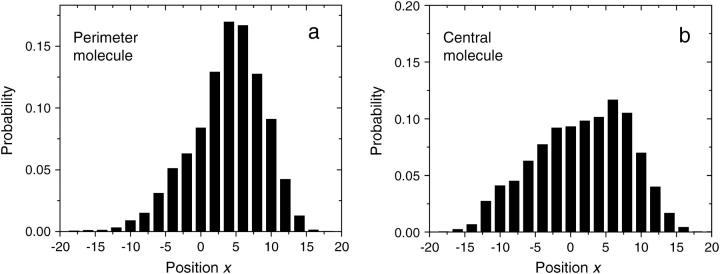
Probability distribution function for the end-to-end distance of contacts (h), for the molecules shown in Fig. 3, and has solid circles in the insets. (a) A single isolated molecule. (b) The center molecule of a small symmetric colony shows a dip at the radius corresponding to the other molecules. The distributions for both a molecule from the perimeter of a small symmetric colony (c) and the central molecule of a small symmetric colony missing one molecule (d) are flattened in comparison with the distribution found for an isolated molecule. The average contact distance is similar for all configurations: (a) 〈h〉 = 8.2(1); (b) 〈h〉 = 8.4(2); (c) 〈h〉 = 8.5(2); and (d) 〈h〉 = 8.5(1).
The second configuration considered is a small regular brush. In this system, a central molecule is surrounded by six others, regularly placed around it at a distance R = 7σ (see Fig. 2). Figs. 3 b and 4 b show the corresponding density plot and distribution function of the contacts for the central molecule. On both of these graphs, the effect of the surrounding molecules can clearly be seen. The free end of the central molecule avoids the location of its six neighbors. This leads to a decreased probability of contact at the radius where the neighboring molecules are grafted (see Fig. 4 b). Note that the average end-to-end distance of the contact is not much affected by the presence of the neighbors (〈h〉 = 8.4(2)) but the free end spends significantly less time, 2.5(2)%, in contact with the primers. As expected, the six molecules on the perimeter behave differently. As can be seen in Figs. 3 c and 4 c, the colony tends to push a perimeter molecule outwards. This is also obvious in Fig. 5 a, where the distribution of the x component of the end-to-end distance of contact (x = xfree-end − xgrafted) is plotted for one molecule of the perimeter. There is an obvious bias in the direction away from the center of the colony (located at x = −7σ in this case). The free end of a molecule on the perimeter of the colony spends less time, 3.0(1)%, in contact with the primers than an isolated molecule, but more than a molecule at the center of a colony.
FIGURE 5.
Probability distribution function for the x = xfree-end − xgrafted component of the end-to-end distance of contacts, for the two anisotropic cases (c and d) shown in Fig. 3. (a) A molecule on the perimeter gets pushed outwards (the center molecule is at x = −7σ). (b) The molecule at the center (x = 0)of an incomplete colony tends to occupy the space left by the missing molecule (at x = 7σ here).
We now look at a slight variation of the system described in the previous paragraph: one of the perimeter molecules is removed, whereas all the others are kept at the same positions. There is no significant difference in the behavior of the molecules on the perimeter of the two systems. However, the molecule at the center of the colony tends to fill the void left by the missing molecule. This can clearly be seen in Figs. 3 d and 5 b. Furthermore, the free end of the molecule at the center of the colony spends significantly less time, 2.5(1)%, in contact with the primers than a free isolated molecule. Note that the average contact distances are similar for all configurations (see Fig. 4).
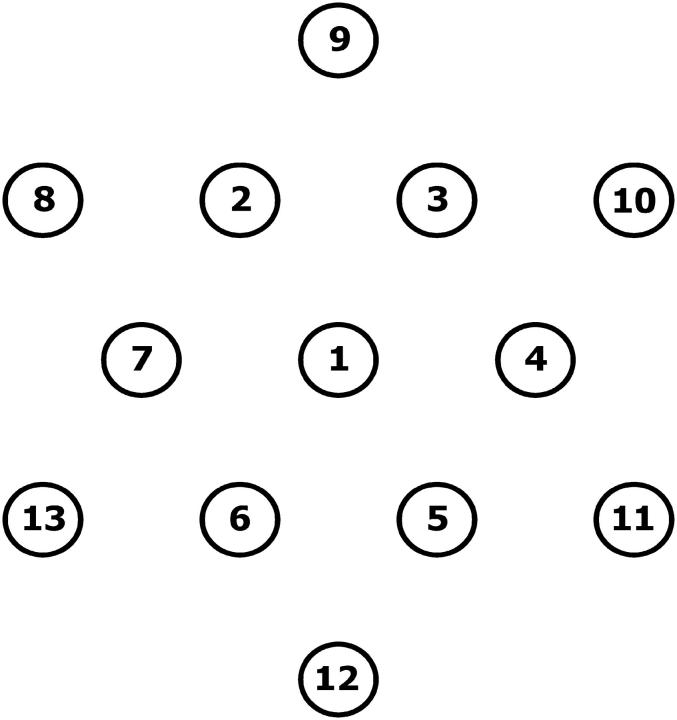
Finally, we look at a large colony where one outer layer of molecules is added to the small colony previously considered. The colony is thus made of 13 molecules (see Fig. 6), and the distance between two adjacent molecules remains 7σ. There are three types of molecule in the colony: the center one (No. 1 in Fig. 6), the “core” molecules (Nos. 2–7), and the molecules on the perimeter (Nos. 8–13). The behavior of the different molecules is consistent with the previous results: molecules at the perimeter are pushed outwards and “core” molecules tend to occupy the empty spots. Furthermore, the molecules at the center of the colony spend significantly less time in contact with the primers (1.6(2)%) than the “core” molecules (2.5(2)%) or the molecules on the perimeter (3.4(2)%). The average contact distances for perimeter (〈h〉 = 8.5(2)) and “core” (〈h〉 = 8.5(2)) molecules are similar and a little larger than the value found previously for an isolated molecule. However, the average contact distance for the center molecule, 〈h〉 = 7.3(2), is now significantly less, indicating that the molecule at the center of the colony tends to bend closer to its grafting point. Clearly, the probability of duplication during a thermal cycle is going to be inhomogeneous in a dense colony.
FIGURE 6.
Configuration of a small regular brush made of 13 molecules. The distance between two adjacent molecules is 7σ (i.e., position of No. 1 = (0, 0), No. 2 = (−3.5σ, 6.056σ), No. 10 = (10.5σ, 6.056σ), etc.). The time spent in contact with the primers is 1.6(2)% for the molecule at the center of the colony, 2.5(2)% for the “core” molecules (Nos. 2–7), and 3.4(2)% for the molecules on the perimeter (Nos. 8–13). The average contact distances are 〈h〉 = 7.3(2) for the central molecule, 〈h〉 = 8.5(2) for the “core” molecules, and 〈h〉 = 8.5(2) for the molecules on the perimeter.
SPA MODELING
In this section we use our Brownian dynamics algorithm to model the kinetics of an SPA experiment. To do so, some fairly drastic assumptions have to be made:
We neglect both hydrodynamic and electrostatic interactions.
The number of primers is assumed to be infinite, which is of course untrue (although the grafting density of primers is extremely high), so that as soon as a molecule come close enough to the surface, it is assumed to have found a primer.
Each molecule that finds the surface is assumed to successfully duplicate (make a copy), i.e., there is no shortage of polymerase or nucleotides and the new thermal cycle does not start before the copy process is finished. Also, the polymerase—which is a fairly large enzyme (comparable to the persistence length of ssDNA)—is able to operate even in a very dense environment, such as the center of the colony.
Although these assumptions may seem drastic, we suspect that the other effects will have a much smaller impact on SPA kinetic than the basic steric interaction. Furthermore, it is useful to realize that all these effects would only amplify the effects resulting from the steric interaction, i.e., that the molecules at the center of a colony are less likely to duplicate than those on the periphery.
It has both been predicted theoretically (50) and observed experimentally (51) that salt can efficiently shield the electrostatic interaction inside a brush. Therefore, brushes of polyelectrolytes (charged polymers) behave like neutral ones at high salt concentrations (typical conditions for SPA; see Ref. 1). Note that if the salt does not completely shield the electrostatic interaction, the latter tends to be stronger in the middle of the colony because of the reduction in the entropy of the ions in very dense brushes (50). Electrostatics thus tends to extend the molecules at the center of a colony, decreasing their probability to bend and find primers, and to push the molecules on the perimeter outward.
The concentration of primers is extremely high. The density is σ = ∼1011 primers per mm2 (1), which corresponds to a mean distance of the order of ∼5–10 nm between primers; note that this is a lot smaller than the contour length of the DNA molecule ∼170 nm and its corresponding radius of gyration Rg ∼15 – 20 nm. On first approximation we can therefore assume that primers are not a limiting factor in duplications. Furthermore since Rgσ ≫ 1, inhomogeneous primer distribution (between the two types) will not have any effect. If primers were to become limited, this effect would, again, prevent a molecule at the center of a colony from duplicating, and would not affect the duplication of a molecule on the perimeter that is bending outward.
In a similar manner, the finite size effect of the polymerase would tend to affect a molecule at the center of a colony more than one on its perimeter, simply because it is more difficult for this large enzyme to enter a dense brush than to operate on the perimeter of the colony. Incomplete elongation, which leads to sterile molecules, is also neglected in our simulation. This could be an important effect in an SPA experiment and, as we showed in our previous article, could strongly affect the growth of the colony (3). However, we showed that unless the concentration of sterile molecules reaches a critical threshold, the effect of sterile molecules is to slow the growth of the colony, but they do not affect the qualitative kinetic of the growth. With these assumptions it is possible to model SPA using our simple algorithm and without the introduction of ad hoc parameters. This allows us to better understand the role of the steric interaction in the SPA kinetic, and determine if the other processes need to be included.
As for the previous section, the DNA molecules are reduced to chains of Z = 39 beads (or monomers) and we use a time step of 0.0001 τ and kBT = ε. Again the Z = 39 beads molecule approximately corresponds to an ssDNA molecule of size ∼400 basepairs or ∼160 nm (the persistent length of single-stranded DNA is ∼10 bases or ∼4 nm), which is similar to the DNA template used in an SPA experiment (1). Choosing different lengths would leads to similar qualitative results although the specific growth rate would change. The simulation starts with a single molecule; its first monomer is grafted to an impenetrable surface. The simulation then follows Eq. 3 for one thermal cycle (Ttc = 1000τ). If at any time during the cycle, the free end of the molecule comes close enough to the surface to touch a primer (zfree-end < zmin = 2σ), it is assumed to have found a matching primer, and the free end stops moving for the rest of the thermal cycle (but the rest of the molecule is still free to move). At the end of the thermal cycle, a new molecule is placed at the location of the contact between the free end and the primers (there is no distinction between the two complementary strands). This process is repeated in an iterative manner for n temperature cycles and leads to a growing random DNA colony. To avoid any configurational (overlap) problem, all molecules are placed straight up at the beginning of each thermal cycle. The cycle time is much larger than the characteristic relaxation time of a straight molecule (trelax ≈ 140τ). Note that we did not include any warmup time at the beginning of each cycle. The reason is that the free end of the molecules will be far away from the surface during essentially the whole relaxation process (<1% of the molecules will touch the surface in the first 140τ).
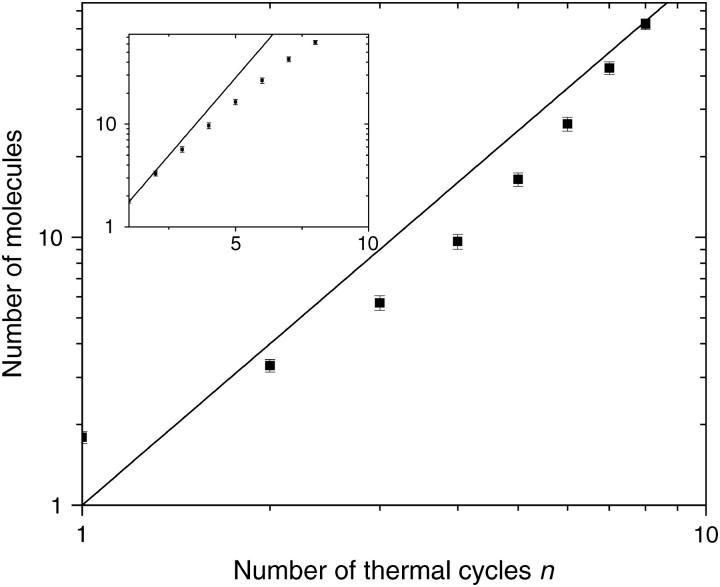
We performed 54 of those SPA growth simulations. Each simulation started with a single molecule and was left to evolve for eight thermal cycles. Fig. 7 shows the average size of a colony as a function of the number of cycles n. Our results indicate that at this early stage (n ≤ 8), the growth cannot be described by either an exponential (like in solution PCR; see Ref. 52) or a geometrical growth (predicted by a simple MC model; see Ref. 3).
FIGURE 7.
Average number of molecules in a colony as a function of the number of thermal cycles n for our BD simulations presented in log-log and semi-log (inset) formats. At this early stage, the growth cannot be described by an exponential growth (solid line, inset), as found in solution PCR; it cannot be described by a geometrical growth either (solid line, main graph), as predicted by a simple MC model.
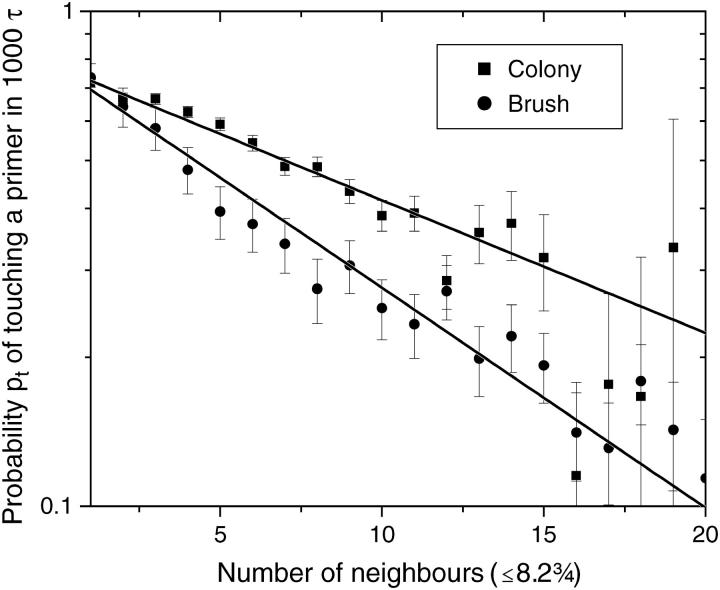
We then look at the probability (pt) that the free end of a molecule touches the grafting surface during these thermal cycles (of duration 1000τ each). For a single isolated molecule, we find pt = 0.77(1). Fig. 8 shows pt as a function of the number of close neighbors (defined as the number of molecules grafted within the average radius of contact 〈h〉 = 8.2σ; see Single Grafted Molecules and Small Regular Colonies). The data represent an average over all eight thermal cycles and 54 different simulations. For comparison, we also show the results obtained with a traditional brush. To mimic an infinite brush, we used the same growth algorithm but we used periodic boundary conditions with a square surface of size L = 20σ (this is the minimum length to ensure that a molecule does not interact with itself; see Fig. 4). Both the brush and the colony show a decrease of pt with the number of close neighbors, consistent with an exponential decay. Our results agree qualitatively with those reported by Seidel and Csajka (28), where a smaller probability for the free end to be close to the surface in a dense brush was observed for larger grafting densities. The crowding effect is less important for a colony than for a brush. This can be explained using the results of Single Grafted Molecules and Small Regular Colonies. In a colony, the local anisotropy plays a major role. The molecules on the perimeter tend to be pushed outward, where there is no molecule (hence, no steric constraint). This results in a large probability for the free end of the perimeter molecules to make contact in a cycle even when these molecules have a large number of neighbors. Furthermore, since the perimeter molecules are pushed outward, the molecules at the center of the colony have slightly more space to bend. In a brush, the density is uniform and no such effects are present.
FIGURE 8.
Probability pt that the free end of a molecule touches the grafting surface (zfree–end < zmin = 2) during one thermal cycle (t = 1000τ) as a function of the number of close neighbors Nneib (defined as the number of molecules grafted with the average distance of contact, 〈h〉 = 8.2σ) for both a colony and a brush. Both simulations used the algorithm described in the sections called Method: Brownian Dynamics Simulations and SPA Modeling, and were left to evolve for n = 8 thermal cycles. The difference comes from the periodic boundary conditions (L = 20) used to model the brush. In the case of the colony, an infinite plane was used. Both cases are well described by an exponential decay function. For a brush we find the best fit to be  and for a colony, we find
MONTE CARLO VERSUS BROWNIAN DYNAMICS
In this section we use our previously developed lattice Monte Carlo (MC) model (3) and optimize its parameters to match the results obtained in the current study using our BD model. In our MC model, the system is reduced to a lattice where a given site can either be occupied by one (or many) ssDNA molecules or left empty. Monte Carlo techniques are then used to simulate the amplification process, i.e., the growth of the colony. The main assumptions of this model are that the duplicated molecules are always approximately at the same distance from the original molecule and that once a molecule is surrounded, its free end mostly remains away from the surface so that it can no longer duplicate (or else does so more slowly). The model also assumes that molecules prefer empty space, i.e., if a molecule is surrounded by some empty neighboring lattice sites, it will fill one of them. Some of these assumptions were confirmed in this study (see Single Grafted Molecules and Small Regular Colonies).
The MC simulation algorithm goes as follows. A molecule is first positioned at the center of a square lattice. At each cycle, each molecule, chosen in a random order, makes one attempt to copy itself into one of its empty nearest-neighbor sites (if any). If more than one such site is available to a molecule, one of them is chosen randomly, but the molecule still has only one chance (per cycle) to make a copy. Each attempt has a probability pt = 0.77 of being successful (this value comes from the probability for an isolated molecule to make contact with the grafted primers in our BD simulations; see Single Grafted Molecules and Small Regular Colonies). When a molecule is completely surrounded by copies (i.e., when all of its nearest-neighbor sites are occupied), it tries to duplicate onto its own lattice site. The probability for the duplication of the molecule located at site (i,j) to be successful (pd(Nt)) depends on the total number Nt(i, j) of molecules on the site and on its nearest-neighbor sites,
 |
(7) |
where N(i, j), and
 |
(8) |
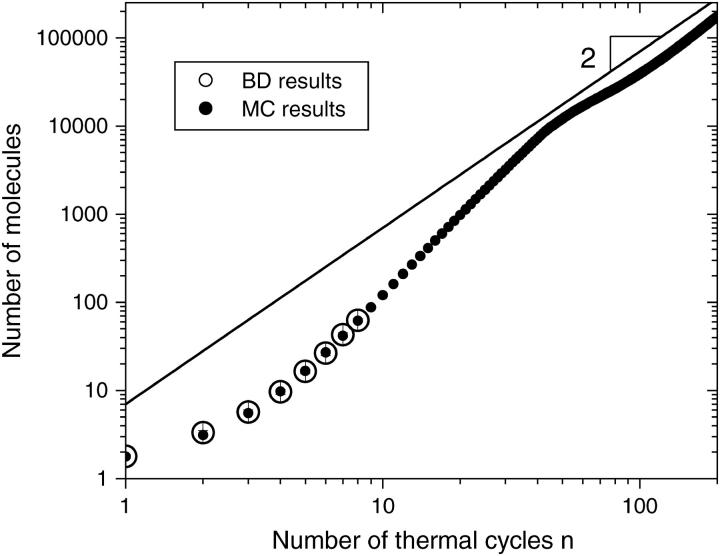
is the number of molecules on a given site and N0 regulates the strength of the local steric interactions. Since the geometry of the lattice is only a rough estimate of the real problem, we choose to let N0 be a free parameter. We found that a value of N0 = 7.1 provides the best agreement between the growth results of the two models. This value is close to the exponential decay coefficient for a brush (see Fig. 8). Simulations were performed using the MC algorithm for up to 200 thermal cycles and the results were averaged over 1000 colonies. Fig. 9 shows the average size of a colony as a function of the number of cycles n, for both our MC and BD models. For the available common data (the first eight cycles), the two models are in excellent agreement. In the case of the Monte Carlo model, which is far less computer-intensive, we eventually reach, after a very long transition time, a geometric growth (∝ n2). The transition occurs when the sites at the center of the colony are completely saturated (Nt ≫ N0). At this point, the growth can only take place from the perimeter. Since the radius of the colony can only increase by one unit every cycle, it follows that the number of molecules in the colony, which is proportional to the colony surface area, increases like n2.
FIGURE 9.
Average number of molecules in a colony as a function of the number of thermal cycles n, for both BD (large open circles) and MC (small solid circles) simulations. The uncertainty is smaller than the size of the circles. In the case of the MC simulations, after a very long transition time, the growth becomes geometric. The solid line has a slope of 2. The MC simulations used a duplication probability of pt = 0.77 per cycle, a steric interaction strength parameter of N0 = 7.1 (see Eq. 7), and the results were averaged over 1000 colonies.
CONCLUSIONS
In this article we used Brownian dynamics simulations to model the growth kinetics of the DNA colonies (small inhomogeneous brushes) found in an SPA experiment. We first considered simple systems such as an isolated molecule and a small symmetric brush. We found that the mean distance (between a chain free end and its grafted monomer) of contact with the primers remains similar for all systems studied. This finding suggests that a lattice model of SPA might be able to capture the main features of the kinetics of growth. Our results also indicate that molecules tend to be pushed toward empty space, i.e., molecules from the perimeter and central molecules with an empty neighbor will tend to duplicate into the empty space. Furthermore, surrounded molecules tend to duplicate less (their free ends spend less time touching the grafting surface) and the probability of contact decreases exponentially with the local density of molecules.
Those results, obtained with a BD model, are consistent with the assumptions made previously to develop our simple Monte Carlo model of SPA colonies (3). We thus used our BD results to find the values of the MC parameters and to discriminate between many variations of our MC model. When the size of an SPA colony was calculated as a function of the number of cycles, the two models agreed nicely (see Fig. 9). Since our BD simulations are very computer-intensive, we were only able to model the first few (eight) cycles of an SPA experiment. At that very early stage, the growth cannot be described either by an exponential (∝ 2n) or a geometrical (∝ n2) growth. Our MC model predicts that the growth will eventually become geometric, but the transition time is so large for these parameters (∼90 thermal cycles) that this regime is possibly beyond what is possible experimentally.
Our results also indicate that the probability of duplication in a given cycle decreases exponentially with the density of grafted chains. Nevertheless, if only steric forces were involved, SPA experiments would lead to very high grafting densities (see Fig. 7). For example, a molecule surrounded by 10 neighbors within a radius of 8.2σ, still has an 18% probability of duplication per cycle. When the density of grafted chains increases, other effects, not considered in this study, can play an important role. Among those effects are:
Electrostatic forces. Single-stranded DNA has a large electric charge per unit length. At low density, counterions shield most of the electrostatic interactions, but when the grafting density is very high, electrostatic interactions could increase the repulsion between molecules, and stretch the molecules upward (29), preventing the free end from reaching the surface.
The finite number of primers. In this study, we assumed that as soon as a molecule comes close enough to the grafting surface to touch a primer, it duplicates. In reality, the density of primers is ∼1011 primers per mm2 (1), which corresponds to a mean distance of the order of ∼5–10 nm (∼2σ) between primers. This is a very high concentration, which corresponds to ∼30 primers for an 8.2σ radius (in our model, a molecule still has a 1% chance to duplicate when it has 30 neighbors). Once all the primers have been used, no molecule can duplicate.
Polymerase and nucleotide availability. In SPA, finding a matching primer is only the first step of the duplication process. Polymerase then needs to add the nucleotides and complete the double-stranded DNA molecule. Polymerase and nucleotide shortage could play a role. Also, polymerase is a fairly large enzyme (comparable to the persistence length of ssDNA). How such a big, charged molecule will behave in a dense brush is unclear.
Sterile molecules. If a thermal cycle finishes before the polymerase has completely copied the complementary DNA strand, the resulting molecule is sterile. Such a molecule is unable to produce new copies because the DNA sequence at its free end does not correspond to the primer sequences on the surface. However, a sterile molecule still occupies space; therefore, it does impose steric constraints upon its neighbors. We previously showed that, unless the concentration of those molecules reaches a critical threshold, they do not qualitatively affect the long-term colony growth (but it can slow it down considerably; see Ref. 3).
DNA stiffness. A double-stranded DNA is ∼10 times stiffer than a single-stranded one. Therefore, when the polymerase completes the double-stranded molecule, the molecule becomes a lot stiffer. How this added stiffness will affect the duplication probability in such a dense environment is unclear.
All these effects play a role in the SPA growth process and should be considered for a complete understanding of SPA. Furthermore, they presumably would all amplify the basic results of steric interaction: The molecules at the center of a colony are less likely to duplicate than the ones on the periphery, therefore reducing the maximum density of a colony. However, any molecular model, like the one presented in this article, is likely to remain too computer-intensive to track more than the first few thermal cycles. Including any of the other effects would only make matters worse, and it is not trivial to include them without arbitrary processes and parameters. The good news is that the BD study presented in this article has clearly demonstrated that a simple MC lattice model can capture the essential features of the kinetics of an SPA process. Such a model thus presents the best hope to understand the various effects, neglected in the BD study.
Acknowledgments
The authors thank Pascal Mayer for useful discussions and the High Performance Computing Virtual Laboratory consortium for computing resources.
This work was supported by a Discovery Grant from the Natural Science and Engineering Research Council of Canada to G.W.S. and by scholarships from the Ontario Graduate Scholarship in Science and Technology Program, Fonds pour la Formation des Chercheurs et l'Aide à la Recherche (Québec), the University of Ottawa, and Manteia Predictive Medicine S.A. to J.-F.M.
References
- 1.Adessi, C., G. Matton, G. Ayala, G. Turcatti, J.-J. Mermod, P. Mayer, and E. Kawashima. 2000. Solid phase amplification: characterisation of primer attachment and amplification mechanisms. Nucleic Acids Res. 28:e87. [DOI] [PMC free article] [PubMed] [Google Scholar]
- 2.Bing, D. H., C. Boles, F. N. Rehman, M. Audeh, M. Belmarsh, B. Kelley, and C. P. Adams. 1996. Bridge amplification: a solid phase PCR system for the amplification and detection of allelic differences in single copy genes. In Genetic Identity Conference Proceedings, Seventh International Symposium on Human Identification. Http://www.promega.com/geneticidproc/ussymp7proc/0726.html.
- 3.Mercier, J. F., G. W. Slater, and P. Mayer. 2003. Solid phase DNA amplification: a simple Monte Carlo lattice model. Biophys. J. 85:2075–2086. [DOI] [PMC free article] [PubMed] [Google Scholar]
- 4.Alexander, S. 1977. Adsorption of chain molecules with a polar head: a scaling description. J. Phys. E. 38:983–987. [Google Scholar]
- 5.Degennes, P. G. 1980. Conformations of polymers attached to an interface. Macromolecules. 13:1069–1075. [Google Scholar]
- 6.Kuznetsov, D. V., and Z. Y. Chen. 1998. Semiflexible polymer brushes: a scaling theory. J. Chem. Phys. 109:7017–7027. [Google Scholar]
- 7.Binder, K. 2002. Scaling concepts for polymer brushes and their test with computer simulation. Eur. Phys. J. E. 9:293–298. [DOI] [PubMed] [Google Scholar]
- 8.Milner, S. T., T. A. Witten, and M. E. Cates. 1988. Theory of the grafted polymer brush. Macromolecules. 21:2610–2619. [Google Scholar]
- 9.Whitmore, M. D., and J. Noolandi. 1990. Theory of adsorbed block copolymers. Macromolecules. 23:3321–3339. [Google Scholar]
- 10.Laradji, M., H. Guo, and M. J. Zuckermann. 1994. Off-lattice Monte Carlo simulation of polymer brushes in good solvents. Phys. Rev. E. 49:3199–3206. [DOI] [PubMed] [Google Scholar]
- 11.Baranowski, R., and M. D. Whitmore. 1995. Theory of the structure of adsorbed block-copolymers—detailed comparison with experiment. J. Chem. Phys. 103:2343–2353. [Google Scholar]
- 12.Baranowski, R., and M. D. Whitmore. 1998. Numerical self-consistent field study of tethered chains in theta solvent. J. Chem. Phys. 108:9885–9892. [Google Scholar]
- 13.Netz, R. R., and M. Schick. 1997. Classical theory of polymer brushes. Europhys. Lett. 38:37–42. [Google Scholar]
- 14.Netz, R. R., and M. Schick. 1998. Polymer brushes: from self-consistent field theory to classical theory. Macromolecules. 31:5105–5122. [DOI] [PubMed] [Google Scholar]
- 15.Pepin, M. P., and M. D. Whitmore. 1999. Monte Carlo and numerical self-consistent field study of end-tethered polymers in good solvent. J. Chem. Phys. 111:10381–10388. [Google Scholar]
- 16.Pepin, M. P., and M. D. Whitmore. 2001. Monte Carlo and numerical self-consistent field study of systems with end-grafted and free polymers in good solvent. J. Chem. Phys. 114:8181–8195. [Google Scholar]
- 17.Naji, A., R. R. Netz, and C. Seidel. 2003. Non-linear osmotic brush regime: simulations and mean-field theory. Eur. Phys. J. E. 12:223–237. [DOI] [PubMed] [Google Scholar]
- 18.Hilhorst, H. J., and J. M. Deutch. 1975. Analysis of Monte Carlo results on kinetics of lattice polymer chains with excluded volume. J. Chem. Phys. 63:5153–5161. [Google Scholar]
- 19.Gurler, M. T., C. C. Crabb, D. M. Dahlin, and J. Kovac. 1983. Effect of bead movement rules on the relaxation of cubic lattice models of polymer chains. Macromolecules. 16:398–403. [Google Scholar]
- 20.Murat, M., and G. S. Grest. 1989. Structure of a grafted polymer brush—a molecular-dynamics simulation. Macromolecules. 22:4054–4059. [Google Scholar]
- 21.Chakrabarti, A., and R. Toral. 1990. Density profile of terminally anchored polymer chains—a Monte Carlo study. Macromolecules. 23:2016–2021. [Google Scholar]
- 22.Lai, P. Y., and K. Binder. 1991. Structure and dynamics of grafted polymer layers—a Monte Carlo simulation. J. Chem. Phys. 95:9288–9299. [Google Scholar]
- 23.Wijmans, C. M., J. M. H. M. Scheutjens, and E. B. Zhulina. 1992. Self-consistent field-theories for polymer brushes—lattice calculations and an asymptotic analytical description. Macromolecules. 25:2657–2665. [Google Scholar]
- 24.Grest, G. S., and M. Murat. 1993. Structure of grafted polymeric brushes in solvents of varying quality—a molecular-dynamics study. Macromolecules. 26:3108–3117. [Google Scholar]
- 25.Grest, G. S. 1994. Grafted polymer brushes—a constant surface pressure molecular-dynamics simulation. Macromolecules. 27:418–426. [Google Scholar]
- 26.Vongoeler, F., and M. Muthukumar. 1995. Polyelectrolyte brush density profiles. Macromolecules. 28:6608–6617. [Google Scholar]
- 27.Seidel, C., and R. R. Netz. 2000. Individual polymer paths and end-point stretching in polymer brushes. Macromolecules. 33:634–640. [Google Scholar]
- 28.Seidel, C., and F. S. Csajka. 2000. Strongly charged polyelectrolyte brushes: a molecular dynamics study. Macromolecules. 33:2728–2739. [Google Scholar]
- 29.Seidel, C. 2003. Strongly stretched polyelectrolyte brushes. Macromolecules. 36:2536–2543. [Google Scholar]
- 30.Kent, M. S., J. Majewski, G. S. Smith, L. T. Lee, and S. Satija. 1998. Tethered chains in θ-solvent conditions: an experimental study involving Langmuir diblock copolymer monolayers. J. Chem. Phys. 108:5635–5645. [Google Scholar]
- 31.Kent, M. S., L. T. Lee, B. J. Factor, F. Rondelez, and G. S. Smith. 1995. Tethered chains in good solvent conditions—an experimental study involving Langmuir diblock copolymer monolayers. J. Chem. Phys. 103:2320–2342. [Google Scholar]
- 32.Kent, M. S., L. T. Lee, B. Farnoux, and F. Rondelez. 1992. Characterization of diblock copolymer monolayers at the liquid air interface by neutron reflectivity and surface-tension measurements. Macromolecules. 25:6240–6247. [Google Scholar]
- 33.Field, J. B., C. Toprakcioglu, R. C. Ball, H. B. Stanley, L. Dai, W. Barford, J. Penfold, G. Smith, and W. Hamilton. 1992. Determination of end-adsorbed polymer density profiles by neutron reflectometry. Macromolecules. 25:434–439. [Google Scholar]
- 34.Auroy, P., L. Auvray, and L. Leger. 1991. Characterization of the brush regime for grafted polymer layers at the solid-liquid interface. Phys. Rev. Lett. 66:719–722. [DOI] [PubMed] [Google Scholar]
- 35.Cosgrove, T., T. G. Heath, J. S. Phipps, and R. M. Richardson. 1991. Neutron reflectivity studies of polymers adsorbed on mica from solution. Macromolecules. 24:94–98. [Google Scholar]
- 36.Koutsos, V., E. W. van der Vegte, and G. Hadziioannou. 1999. Direct view of structural regimes of end-grafted polymer monolayers: a scanning force microscopy study. Macromolecules. 32:1233–1236. [Google Scholar]
- 37.Currie, E. P. K., M. Wagemaker, M. A. C. Stuart, and A. A. van Well. 2000. Structure of grafted polymers, investigated with neutron reflectometry. Phys. B. (Amsterdam). 283:17–21. [Google Scholar]
- 38.Raphael, E., and P. G. Degennes. 1992. Aggregation of flexible-rigid-flexible triblock copolymers. Makromol. Chemie Macromol. Symp. 62:1–17. [Google Scholar]
- 39.Xi, H. W., and S. T. Milner. 1996. Surface waves on polymer brushes. Macromolecules. 29:4772–4776. [Google Scholar]
- 40.Vilgis, T. A., A. Johner, and J. F. Joanny. 1999. Compression of finite size polymer brushes. Phys. Chem. Chem. Phys. 1:2077–2081. [Google Scholar]
- 41.Sevick, E. M. 2000. Compression and escape of a star polymer. Macromolecules. 33:5743–5746. [Google Scholar]
- 42.Milchev, A., V. Yamakov, and K. Binder. 1999. Escape transition of a compressed polymer mushroom under good solvent conditions. Europhys. Lett. 47:675–680. [Google Scholar]
- 43.Ennis, J., E. M. Sevick, and D. R. M. Williams. 1999. Compression of a polymer chain by a small obstacle: the effect of fluctuations on the escape transition. Phys, Rev, E. 60:6906–6918. [DOI] [PubMed] [Google Scholar]
- 44.Mitra, R. D., and G. M. Church. 1999. In situ localized amplification and contact replication of many individual DNA molecules. Nucleic Acids Res. 27:e34. [DOI] [PMC free article] [PubMed] [Google Scholar]
- 45.Mitra, R. D., V. L. Butty, J. Shendure, B. R. Williams, D. E. Housman, and G. M. Church. 2003. Digital genotyping and haplotyping with polymerase colonies. Proc. Natl. Acad. Sci. USA. 100:5926–5931. [DOI] [PMC free article] [PubMed] [Google Scholar]
- 46.Zhu, J., J. Shendure, R. D. Mitra, and G. M. Church. 2003. Single molecule profiling of alternative pre-mRNA splicing. Science. 301:836–838. [DOI] [PubMed] [Google Scholar]
- 47.Mitra, R. D., J. Shendure, J. Olejnik, E. Krzymanska-Olejnik, and G. M. Church. 2003. Fluorescent in situ sequencing on polymerase colonies. Analytical Biochemistry. 320:55–65. [DOI] [PubMed] [Google Scholar]
- 48.Ermak, D. L., and J. A. McCammon. 1978. Brownian dynamics with hydrodynamic interactions. J. Chem. Phys. 69:1352–1360. [Google Scholar]
- 49.Grest, G. S., and K. Kremer. 1986. Molecular dynamics simulation for polymers in the presence of a heat bath. Phys. Rev. A. 33:3628–3631. [DOI] [PubMed] [Google Scholar]
- 50.Zhulina, E. B., O. V. Borisov, and T. M. Birshtein. 1992. Structure of grafted polyelectrolyte layer. J. Phys. II. 2:63–74. [Google Scholar]
- 51.Romet-Lemoinne, G., J. Daillant, P. Guenou, and J. Y. J. W. Mays. 2004. Thickness and density profiles of polyelectrolyte brushes: dependence on grafting density and salt concentration. Phys. Rev. Lett. 93:148301. [DOI] [PubMed] [Google Scholar]
- 52.Peccoud, J., and C. Jacob. 1996. Theoretical uncertainty of measurements using quantitative polymerase chain reaction. Biophys. J. 71:101–118. [DOI] [PMC free article] [PubMed] [Google Scholar]


