

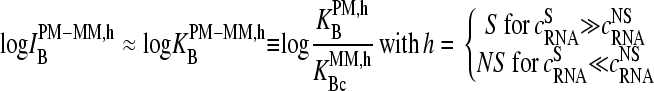
Abstract
Gene expression analysis by means of microarrays is based on the sequence-specific binding of RNA to DNA oligonucleotide probes and its measurement using fluorescent labels. The binding of RNA fragments involving sequences other than the intended target is problematic because it adds a chemical background to the signal, which is not related to the expression degree of the target gene. The article presents a molecular signature of specific and nonspecific hybridization with potential consequences for gene expression analysis. We analyzed the signal intensities of perfect match (PM) and mismatch (MM) probes of GeneChip microarrays to specify the effect of specific and nonspecific hybridization. We found that these events give rise to different relations between the PM and MM intensities as function of the middle base of the PM, namely a triplet-like (C > G ≈ T > A > 0) and a duplet-like (C ≈ T > 0 > G ≈ A) pattern of the PM-MM log-intensity difference upon binding of specific and nonspecific RNA fragments, respectively. The systematic behavior of the intensity difference can be rationalized on the level of basepairings of DNA/RNA oligonucleotide duplexes in the middle of the probe sequence. Nonspecific binding is characterized by the reversal of the central Watson-Crick (WC) pairing for each PM/MM probe pair, whereas specific binding refers to the combination of a WC and a self-complementary (SC) pairing in PM and MM probes, respectively. The Gibbs free energy contribution of WC pairs to duplex stability is asymmetric for purines and pyrimidines of the PM and decreases according to C > G ≈ T > A. SC pairings on the average only weakly contribute to duplex stability. The intensity of complementary MM introduces a systematic source of variation which decreases the precision of expression measures based on the MM intensities.
INTRODUCTION
Understanding of factors affecting the transcription of genetic information into the proteome level is one of the major challenges in the context of systems biology and molecular medicine. It requires new high-throughput techniques to analyze the activity of a large number of potentially important genes. The high-density-oligo-nucleotide-array technology enables us to estimate the expression degree of thousands of genes in particular cells or tissues at once by the measurement of the abundance of the respective messenger RNA (1). This method is based on both the sequence-specific binding (hybridization) of the target RNA to complementary DNA oligonucleotide probes, and the fluorescence labeling and detection of probe-bound RNA transcripts. For example, up to 1,000,000 probes of different sequences referring to 20,000–45,000 different genes are attached to typical microarrays of the GeneChip type in spots of about one μm2 per probe (2).
The integral fluorescence intensity per probe array is directly related to the amount of bound RNA, which in turn serves as a measure of the target RNA concentration in the studied sample solution. It represents a mixture of RNA fragments with a wide distribution of different sequences. A considerable amount of RNA fragments consequently involve sequences other than the intended target of a selected probe. Unfortunately, these nonspecific transcripts can also possess a non-negligible affinity for duplex formation with the probes. In other words, duplex formation between RNA transcripts and the DNA probes partially lacks specificity in terms of complementary Watson-Crick (WC) basepairings. This nonspecific hybridization is problematic for chip analysis because it adds a chemical background intensity, which is not related to the expression degree of the target gene.
One experimental option to deal with this problem is the pairwise design of each probe sequence on Affymetrix GeneChip microarrays (3). The sequence of the 25-meric so-called perfect match (PM) probe is taken from the target gene, and thus it is complementary to a sequence length of 25 nucleotide bases in the transcribed target RNA. On the other hand, the so-called mismatch probe (MM) is identical with the PM probe except the base in the middle of the sequence, which is replaced by its complement to prevent specific hybridization, i.e., the binding of the target RNA. This way, the MM probe intends to measure the amount of nonspecific hybridization, and thus to provide a correction of the PM intensity for the chemical background. In addition, a certain number (usually 11–20) of PM/MM probe pairs taken from different regions of the same gene form a so-called probe set to get several estimates of its expression degree and thus to improve the reliability of the method.
The idea behind the correction using mismatches is based on the assumption that nonspecific binding is identical for PM and MM probes, i.e., nonspecific transcripts do not see the letter change in the middle of the sequence. It is further assumed in accordance with conventional hybridization theory that the mismatch strongly reduces the affinity of target binding to the MM, and thus specific transcripts see the change of the middle letter (4,5). These assumptions predict a systematically equal or higher intensity of the PM compared with that of the MM, IPM ≥ IMM, given that the fluorescence response per bound transcript is identical for PM and MM and for specific and nonspecific hybridization as well.
Chip analyses, however, show that a fair number of MM probes possess a larger fluorescence intensity than their PM counterpart (6). It was concluded that conventional hybridization theory is simply inadequate, and particularly, that the basic mechanism of MM hybridization is not understood yet. As a consequence, many algorithms of gene expression analysis simply ignore MM intensity data (see, e.g., references 7 and 8 for an overview) or the MM probes are considered in an empirical fashion to exclude bad probes from the analysis (3,9). Other publications discuss nonlinearities in the probe responses and sequence effects in the behavior of matched and mismatched probes showing that the hybridization on microarrays is apparently a complex phenomenon, which is governed by an intricate interplay between several effects such as the stability of RNA/DNA duplexes, binding and saturation, surface electrostatics, and diffusion, fluorescence emission, and non-equilibrium thermodynamics (6,10–19).
The “riddle of bright MM” was apparently solved by Naef and Magnasco (17), who showed that the difference between the PM and MM intensities strongly correlates with the middle base at position k = 13 of the 25-meric probe. For probe pairs with double-ringed pyrimidines (C, T) in the middle of the PM sequence, one finds a preference for “bright” PM, IPM > IMM. In contrast, for purines (G, A) the relation reverses with the tendency for “bright” MM. The interpretation in terms of probe-target duplexes suggests that single-ringed pyrimidines form stronger self-complementary (SC) basepairings (i.e., C·c* and T·u*; lower-case letters refer to the RNA, the asterisk denotes fluorescent labeling, and mismatched basepairings are underlined) compared with the respective WC pairs (C·g and T·a) owing to steric effects and labeling (17).
On the other hand, it is well accepted that SC pairs between oligonucleotides in solution are considerably weaker than WC pairs (20,21). Studies on the hybridization of mismatched probes on different microarray types reveal agreement with solution data (22,23). Hence, the postulated SC basepair interactions on GeneChip microarrays contradict conventional hybridization properties of oligonucleotides in solution and also on microarrays. The fundamentally different behavior of GeneChip probes (the so-called “riddle of bright MM”) is intriguing but also strange, because it seems to violate conventional hybridization rules.
The accurate interpretation of microarray intensity data in terms of the expression degree remains a significant challenge, which requires the understanding of the hybridization behavior on the level of basepair interactions. The present publication aims at examining the validity of the basic rules of DNA/RNA hybridization in solution for hybridization on high-density-oligo-nucleotide-array microarrays and at extracting a molecular signature to discriminate specific and nonspecific hybridization on the level of basepairings in DNA/RNA duplexes.
CHIP DATA
The classification of the probes according to perfect-matched and mismatched pairings of the middle base refers to specific duplexes of the PM and MM probes with the complementary sequence of the respective target RNA. Consequently the interpretation of MM intensity data in terms of SC basepairings assumes exclusively specific hybridization of the MM probes, a condition which is usually not realized. The present study therefore separates specific and nonspecific hybridization using a special calibration data set to analyze the PM and MM probe intensities in terms of basepair interactions in RNA/DNA duplexes on microarrays.
Particularly, the microarray intensity data of PM and MM probes,  and
and  (p is the probe number), respectively, are taken from the Affymetrix human genome HG U133 Latin Square (HG U133-LS) data set (available at http://www.affymetrix.com/support/technical/sample_data/datasets.affx). The HG U133-LS experiment considers transcripts of 42 genes (42 × 11 = 462 different probes). They are titrated (i.e., spiked) onto 14 different arrays at 14 concentrations corresponding to all cyclic permutations in a complex human background extracted from a HeLa cell line not containing the spikes. This way one gets the relation between the probe intensities and the respective (i.e., spiked-in) concentration of specific RNA. Each condition was realized in triplicate. PM and MM intensities are background-corrected using the algorithm provided by MAS 5.0 (3,9).
RESULTS
The effect of bright MM probe intensities is related to nonspecific hybridization
More than 30% of all probe pairs of Affymetrix GeneChips are characterized by bright mismatched MM probes, which show a higher intensity and thus a stronger affinity for duplex formation with RNA fragments than the respective PM probes, although the middle base in the MM does not match the target sequence in terms of Watson-Crick (WC) pairs (6). To analyze this effect as a function of the relative amount of specific transcripts we plot the log-intensity difference,  of all spiked-in probes pairs at all available concentrations of specific transcripts
  as function of the set-averaged mean log intensity,
  which serves as an empirical measure of the concentration of specific transcript (24) (see Fig. 1). Note that the 11 probes of each set refer to one target gene and thus to specific RNA fragments of one concentration.
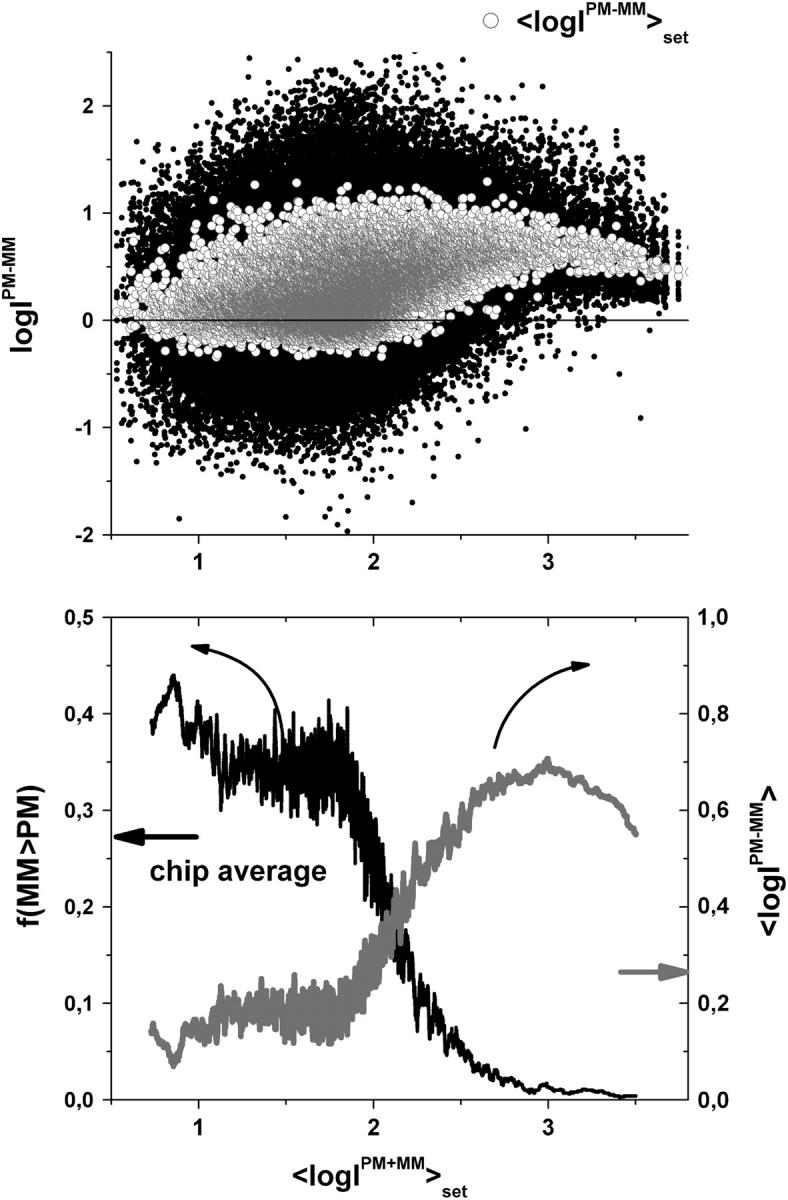
FIGURE 1.

Log-intensity difference, logIPM−MM = logIPM − logIMM, of the spiked-in probes taken from the LS experiment as a function of the mean set averaged intensity, 〈logIPM+MM〉set = 0.5〈(logIPM + logIMM)〉set, which serves as an approximate measure of the specific transcript concentration. Intensity averages over the probe sets are shown by open circles. The lower panel shows the log-differences for three selected spiked-in concentrations. Each concentration spans a range of ∼δ〈logIPM+MM〉 ≈ ±0.5 as indicated by the lines between the two panels. Note that the log-intensity difference shifts upwards with increasing 〈logIPM+MM〉set indicating the progressive decrease of the fraction of bright MM with increasing amounts of specific transcripts.
We used this simple parameter instead of other estimates of the relative transcript concentration (see 17 for an overview) because 1), it can be calculated for single chips, i.e., it is not based on the comparison of the probe intensities of several chips; 2), the computation of  is rather simple; and 3), it includes no correction for the chemical background, the identification of which is one goal of the present work. The
  data are separately replotted for three selected spiked-in concentrations in the lower panel of Fig. 1. It shows that the concentration of specific transcripts correlates well with
  —which, however, spreads with an uncertainty of
  for each spiked-in concentration.
The lower part of Fig. 1 clearly reveals that the PM-MM log-intensity difference increases with increasing amounts of specific transcripts. In particular, the cloud of the  data markedly shifts upwards with increasing
  The parallel increase of the mean intensity difference averaged over all spiked-in probes of one concentration,
  clearly reflects this trend (see Fig. 2). The onset of saturation gives rise to a maximum of the averaged log-intensity difference at higher concentrations and the decrease of
  with further increasing
  The set-averaged intensity difference,
  (open symbols in Fig. 1), and especially the mean log-intensity difference of all probes of one spiked-in concentration,
  (Fig. 2, upper panel), more clearly indicate this trend.
FIGURE 2.

The fraction of bright MM, f(MM > PM) (lower panel) and the mean log-intensity difference, 〈logIPM-MM〉sp-in (upper panel), of the spiked-in probes taken from the LS experiment strongly correlate with the concentration of specific transcripts. The respective fraction of probe sets, fset(MM > PM), meeting the condition 〈logIPM-MM〉set < 0 is shown by triangles in the lower panel. The data can be well explained by the probability that >n(min) = 6–7 individual probe pairs of the set independently possesses bright MM using the Binominal distribution (see lines denoted by 6 and 7, respectively).
For a more detailed analysis we also calculated the fraction of probe pairs with bright MM,  (see Fig. 2, lower panel;
  is the total number of spiked-in probes and N(MM > PM)c=const is the number of probes meeting the condition of bright MM,
  ) for each spiked-in concentration to characterize the intensity relation between the PM and MM as a function of
  the concentration of specific spiked-in transcripts. The fraction of probe pairs with bright MM decreases from f(MM > PM) ≈ 0.43 in the absence of specific transcripts to values smaller than 0.05 at
  Hence the intensity of almost all 462 PM probes referring to the spiked-in transcripts exceeds the intensity of the respective MM if the RNA binding is dominated by specific hybridization.
In the absence of specific hybridization nearly one-half of all spiked-in probe pairs gives rise to bright MM. Owing to this effect more than 20% of the spiked-in probe sets are characterized by a larger set-averaged MM intensity compared with the respective PM value (i.e.,  see also the open circles in Fig. 1, which show the set-averaged log-intensity differences of the spiked-in probes). The respective fraction of probe sets of bright MM, fset(MM > PM), more steeply decreases with increasing concentration of specific transcripts than the overall fraction of single bright MM probes, f(MM > PM) (see triangles in the lower panel of Fig. 2). This difference can be simply explained by means of the binominal distribution
 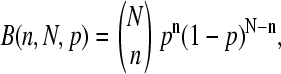 where p = f(MM > PM) is the probability to find a probe pair with bright MM. It predicts the probability that n = N(MM > PM) probe pairs meet the condition IMM > IPM within an independent set of N = Nset probe pairs, if one assumes that the sequence-specific affinities of the probes are randomly distributed among the probe sets (see below) and that the PM and MM log-intensities are equally distributed around the set averages. Then, the fraction of bright MM probe sets is, to a good approximation, given by the probability that more than 50% of the probe pairs of the set possess bright MM, i.e.,
 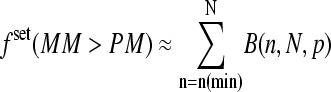 with n(min) ≈ 0.5 · Nset. Fig. 2 shows that the experimental data are well compatible with n(min) = 6–7 (compare the triangles with curves 6 and 7) in agreement with the prediction.
To generalize these results we calculate the fraction of bright MM and the mean log-intensity difference for all 250,000 probes of an HG U133 chip (see Fig. 3). The respective running averages of f(MM > PM) and of  show virtually the same features as the respective curves of the spiked-in genes (compare with Fig. 2). Note that the x axes in both figures, the concentration in Fig. 2, and mean intensity in Fig. 3, scale nonlinearly each to another. For example, the plateau of f(MM > PM) and of
  at small intensity values
  (see Fig. 3) can be mainly attributed to nonspecifically hybridized probes referring to the smallest concentration values,
  in Fig. 2. We conclude that the scaling of the probes with the set-averaged mean log-intensities indeed reflects essential properties of the concentration dependence as suggested previously (24).
FIGURE 3.
Log-intensity difference between PM and MM probes of the whole data set of ∼250,000 probes of an HG U133 chip (upper panel), fraction of bright MM (lower panel, left ordinate) and mean log-intensity difference (lower panel, right ordinate) as a function of the mean set averaged intensity. The fraction of bright MM and the mean difference were calculated as running averages over 1000 subsequent probes along the abscissa. Note the agreement with the respective data obtained from the spiked-in data set (Figs. 1 and 2). It shows that the dependence of the probe intensities on the concentration of specific transcripts applies to the whole set of probes of the chip.
The effect of bright MM probe intensities is related to the middle base
It was previously found that the effect of bright MM and thus the difference between the PM and MM intensities strongly correlates with the middle base at position k = 13 of the 25-meric probe, if one considers all probes of the chip (17). For probe pairs with double-ringed pyrimidines (C, T) in the middle of the PM sequence one finds a preference for bright PM, IPM > IMM. In contrast, for purines (G, A) the relation reverses with the tendency for bright MM. The analysis in terms of probe sensitivities (see below) reveals a similar result (24,25).
To shed light into the effect of specific and nonspecific hybridization on the observed bias, due to the middle base we separately plot the intensity difference,  for all probe pairs of the chip possessing a common middle base B = A, T, G, and C of the PM probe (see the upper panels of Figs. 4 and 5). The respective data cloud systematically shifts upwards for pyrimidines, B = C and T, and downwards for purines, B = G and A, as expected. The respective fraction of bright MM, fB(MM > PM), and the mean log-intensity difference,
 |
(1) |
of probes with middle bases B = A, T, G, C (PM) and its complementary base Bc = T, A, C, G (MM) considerably deviate from the overall mean over all probes (compare lower panels of Figs. 4 and 5 with Fig. 3). In probe pairs with B = A, G more than 60% of the MM are bright in the plateau region of fB(MM > PM), which refers to hybridization with a dominating fraction of nonspecific transcripts. In contrast, only about 20% of the probe pairs possess bright MM for B = T, C in the respective range of small mean intensities.
FIGURE 4.

The figure shows the same type of data as in Fig. 3; however, only probe pairs with a G and a C in the middle of the PM sequence are selected (see the figure for assignments). The data referring to the pyrimidine and purine middle base are shifted in vertical direction to each other. Compare with Fig. 5 and see also legend of Fig. 3.
FIGURE 5.

The figure shows the same type of data as in Fig. 3; however, only probe pairs with a T and an A in the middle of the PM sequence are selected (see the figure for assignments). Compare with Fig. 4 and see also legend of Fig. 3.
In Figs. 6 and 7 we plot the middle-base specific fraction of bright MM, fB(MM > PM) (lower panel), and the respective mean PM-MM difference,  (upper panel), for comparison of the chip averages (Fig. 6) with the respective averages over the spiked-in probes (Fig. 7). Both kinds of data show essentially identical properties indicating, 1), that the whole ensemble of probes behaves similarly compared with the reduced ensemble of spiked-in probes; and 2), that the concentration dependence of the specific transcripts transforms into the scale of the set-averaged intensity to a good approximation (see above).
FIGURE 6.
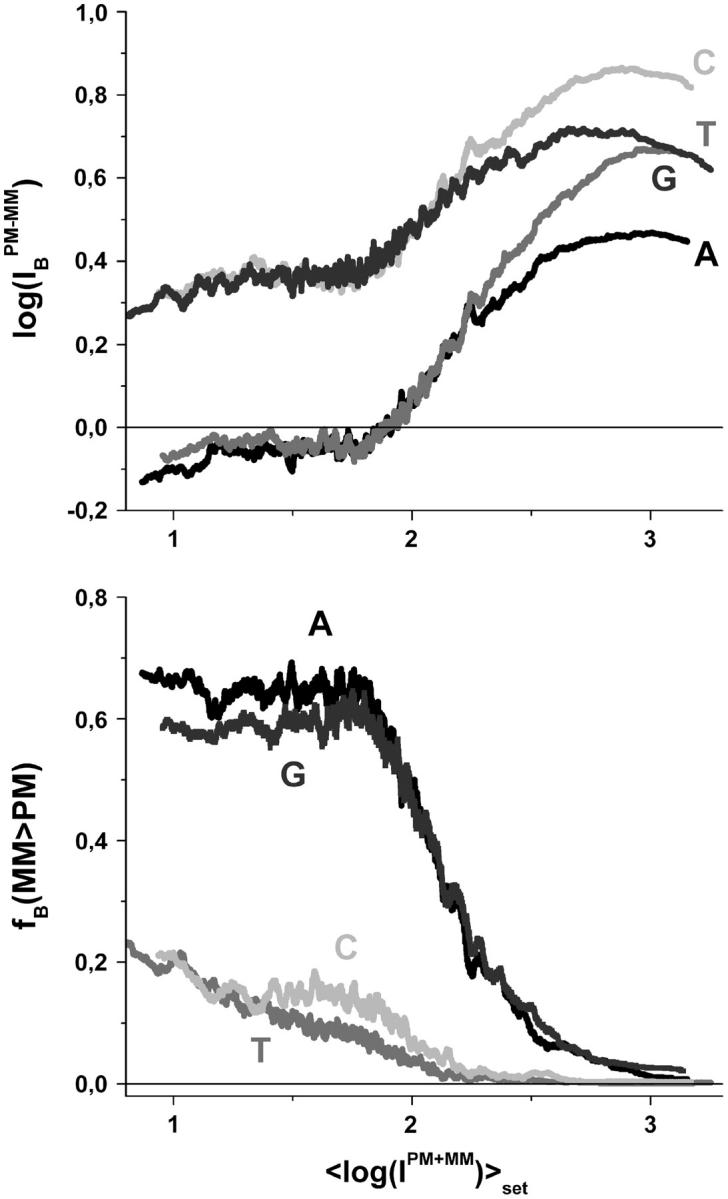
Fraction of bright MM (lower panel) and mean log-intensity difference (upper panel) for probe pairs with a B = A, T, G, C in the middle of the PM sequence (see the figure for assignments) as a function of the mean set averaged intensity. The data were replotted from Figs. 4 and 5 (see the respective legends for details). The data refer to the whole data set of ∼250,000 probes of a HG U133 chip. Note that the log-intensity differences split in to a duplet-like pattern at small abscissa values referring to nonspecific hybridization and into a triplet-like pattern at high abscissa values referring to specific hybridization (see upper panel).
FIGURE 7.
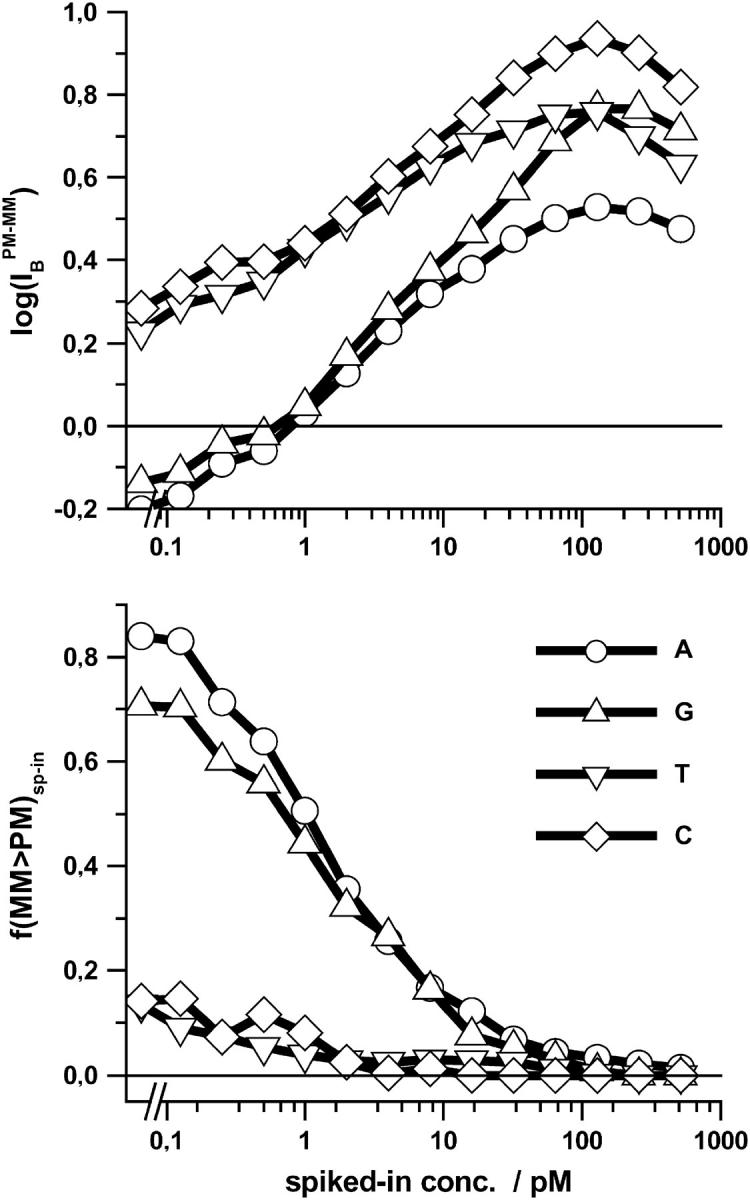
Fraction of bright MM (lower panel) and mean log-intensity difference (upper panel) for probe pairs with B = A, T, G, C in the middle of the PM sequence (see the figure for assignments) as a function of the concentration of specific transcripts. The data refer to the spiked-in data set of 462 different probes. Compare with Fig. 6. Both Figs. 6 and 7 show essential identical properties for the spiked-in and the full set of probes.
The mean difference of log intensities,  is negative for the middle bases B = A and G and clearly positive for T and C with values, which obey a duplet-like pattern according to the relation C ≈ T > 0 > G ≈ A in the limit of nonspecific hybridization. The
  -curves split into four different courses in the intermediate intensity range according to C > T > G > A > 0, and finally the G and T curves merge together giving rise to a triplet-like pattern with C > T ≈ G > A > 0 at high mean intensities—i.e., in the limit of dominating specific hybridization. Hence, the systematic shift between the PM-MM log-intensity differences is clearly affected by the relative amount of specific hybridization, indicating that specific and nonspecific transcripts bind differently to probes with a certain middle base.
The slightly smaller fraction of bright MM for B = A, G in the full data set compared with the spiked-in set at small abscissa values can be attributed to the fact that a small amount of specific transcripts also contributes to the respective averages in the limit of small abscissa-values of the mean intensity.
Middle-base averaged probe sensitivity
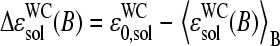
In a next step we transform the log-intensity difference referring to one middle base into a relative scale with respect to the total mean over all spiked-in probes of one concentration (〈…〉c=const) by means of
 |
(2) |
Equation 2 defines the middle-base related sensitivity difference between perfect matched and mismatched oligonucleotide probes. Note that the sensitivity characterizes the ability of a probe to detect a certain amount of RNA (25). It depends on the binding affinity (i.e., the binding strength for duplex formation with the target) and on the fluorescence yield (which is related to the intensity per bound transcript, i.e., to the number of fluorescence labels attached to the RNA sequence) of the relevant RNA transcripts. The middle-base related sensitivity given by Eq. 2 is expected to filter out the systematic effect of the respective middle base on the PM-MM log-intensity difference. Fig. 8 shows the respective sensitivity data that are derived from the Latin square experiment as a function of the specific transcript concentration of the spiked-in probes,  (see also Fig. 7).
FIGURE 8.

Middle-base related sensitivity of probe pairs with B = A, T, G, C in the middle of the PM sequence (see the figure for assignments and Eq. 2) as a function of the concentration of specific transcripts. The concentration ranges of dominating nonspecific (NS) and of specific (S) hybridization are indicated by vertical dotted lines. The duplet in the limit of nonspecific hybridization transforms into a triplet-like pattern in the limit of specific hybridization. The sensitivity provides a measure of the base-specific contribution to the free energy of RNA/DNA duplex stability.
In the limit of dominating nonspecific hybridization (superscript NS) at small  values one obtains a duplet-like relation between the data,
  With increasing
  the absolute sensitivity values for B = G, T progressively decrease and virtually merge in the limit of dominating specific hybridization revealing a triplet-like pattern according to
  The slight decrease of the absolute values of
  and of
  with increasing specific transcript concentrations
  presumably reflects saturation (see Fig. 8, this article; and reference 25).
Positional dependent single-base (SB) model
To further specify the effect of each single base along the probe sequences on the observed sensitivity difference we used a simple model, which approximates the sensitivity of P = PM, MM probes,
 |
(3) |
by a sum of base- and positional-dependent sensitivity terms,
 |
(4) |
The considered probes (index p) were taken from a subset of all probes on the chip, Σh, which refers predominantly to nonspecifically (h = NS) and specifically (h = S) hybridized probes (i.e., p∈Σh). We chose all probe sets which meet the condition  for the subset ΣNS and
  for the subset ΣS according to the correlation between the set-averaged log-intensities and the spiked-in concentration established above. The symbol δ denotes the Kronecker delta (δ(x,y) = 1 if x = y and δ(x,y) = 0 if x ≠ y) and
  is the fraction of base B at position k in the considered ensemble of probes, Σh. The nucleotide base at position k along the sequence of probe number p is denoted by
  . The values of the positional dependent sensitivity terms for each base,
  , were estimated by multiple linear regression of the experimental and theoretical sensitivities,
  and
and  respectively, using singular value decomposition for solving the obtained system of linear equations (see reference 26 for details).
The sensitivity profiles of the PM probes of both subsets, ΣS and ΣNS, and of the nonspecifically hybridized MM probes are very similar, i.e.,  (see Fig. 9, upper panels). In particular, the profiles for B = C, A show the typical parabola-like shape being maximum and minimum in the middle of the sequence, respectively, whereas the sensitivity terms for B = T, G change almost monotonously along the sequence with their minimum and maximum values at k = 1, respectively (see also 17,26–28).
FIGURE 9.

Positional dependent single-base sensitivity profile of the PM (symbols) and MM (lines) probes in the limit of nonspecific (left) and specific (right) hybridization. The two lower panels show the respective PM-MM difference profiles (see Eq. 5). Note that the PM-MM difference of the middle base considerably exceeds the contributions of the bases at the remaining positions along the sequence.
The sensitivity profiles of specifically hybridized MM probes distinctly differ in the middle of the sequence from the other considered profiles for B = A, C. Namely, the absolute values of  and
and  markedly drop to values near zero, giving rise to a dentlike shape of the respective curves. Note that also the sensitivity profiles of B = G, T adopt only tiny values at k = 13. One can therefore assume
  for all bases B = A, T, G, C to a good approximation. In other words, there is, on the average, only a weak base-specific contribution from the mismatched middle base of the MM probes to the respective probe intensities in the limit of specific hybridization. On the other hand, the matched bases at the remaining sequence positions k ≠ 13 give rise to similar sensitivity profiles of the PM and MM probes in the limit of specific and nonspecific hybridization as well, i.e.,
  for k ≠ 13 and h = N, NS.
For the further discussion of the positional effect on the PM-MM sensitivity difference let us rewrite the SB model for each PM-MM pair:
 |
(5) |
Equation 5 takes into account that the sequences of the PM and MM probes of each pair are identical for all positions k ≠ 13 but complementary for the middle bases at k = 13. The lower panel of Fig. 9 shows the respective difference profiles. The  values virtually vanish for k ≠ 13, as expected. On the other hand, the sensitivity difference of the middle base considerably differs from zero. The
  values change in a similar fashion as the middle-base related sensitivity differences
  with increasing amount of specific transcripts (see Fig. 8 and previous section). Namely, the difference of the sensitivity terms split into a duplet,
  in the limit of nonspecific hybridization, and into a triplet,
  in the limit of specific hybridization in correspondence with the behavior of
  The analysis of the spiked-in probes in terms of the SB model provides similar results (not shown here; see reference 26).
The parallel behavior of the SB sensitivity difference of the middle base (see Eq. 5 and Fig. 9, lower panel) and of the middle-base averaged mean sensitivity difference (Eq. 2, see Fig. 8) is plausible because the averaging to a high degree reduces the specific effect of the bases at positions k = 1–12 and 14–25. In other words, the observed variation of  can be mainly attributed to the middle base, i.e.,
 |
(6) |
Note that  and
and  are the results of independent analyses where the former one simply averages out the effect of the bases at positions k ≠ 13 in contrast to the latter method, which explicitly considers the mean effect of each base at each position.
DISCUSSION
The affinity of DNA oligonucleotide probes for RNA binding
Essentially four multiplicative factors affect the signal intensity of microarray probes:
The binding affinity of the particular probe for duplex formation with RNA fragments.
The fluorescence yield of probe-bound RNA fragments depending on the number of labeled nucleotides in their sequence.
The relative abundance of RNA fragments which potentially bind to the probe in the sample solution.
A proportionality constant which considers effects due to chip fabrication (e.g., the surface density of probes), sample preparation (e.g., the total RNA concentration in the sample solution), and imaging (e.g., the sensitivity of the scanner) (24).
Effects 3 and 4 are common for a given gene and chip, respectively, and, thus they largely cancel out in the log-intensity difference,  of each PM-MM probe pair. The sequences of the PM and MM probes differ only with respect to their middle base. Consequently, sequence-specific effects 1 and 2 are reduced in the log-intensity difference,
  compared with the individual intensity values,
  and
and  In particular, the amount of labeling is either equal or it differs on the average by only one labeled base if one compares the specific and nonspecific duplexes of the PM with that of the MM probes, respectively. We therefore neglect the effect of labeling in the following considerations. Finally, the averaging over all probe pairs with a certain middle base according to Eq. 1 largely decreases sequence-specific effects due to base positions k = 1…12 and 14…25 of the 25-meric probes (24).
Hence the middle-base related log-intensity difference of a PM-MM probe pair (Eq. 1) is expected to reflect the mean effect of changing base B by its complementary base Bc in the middle of oligonucleotide probes upon hybridization on GeneChip microarrays. Note that the log-intensity difference is given to a good approximation by (see 24,25),
 |
(7) |
where  denotes the effective binding constant of the P = PM (and MM) probe with middle letter B (and Bc) for association with specific (h = S) and nonspecific transcripts (h = NS), respectively (see also text that follows). Note that the
  are effective, i.e., mean values averaged over the respective ensemble of PM/MM probe pairs. The concentrations of the specific and of all nonspecific RNA fragments referring to the selected probe are
  and
and  respectively. The second term in Eq. 7 describes progressive saturation of the probe with bound transcripts upon increasing RNA concentration according to a Langmuir isotherm.
Let us neglect saturation for sake of simplicity  . Then one obtains, in the limit of high and small fractions of specific transcripts,
 |
(8) |
In other words, the middle-base related log-intensity difference provides a measure of the affinity difference between complementary bases in DNA/RNA duplexes with specific and nonspecific transcripts in terms of their binding constants.
Basepairings in specific duplexes of PM and MM probes
The sequence of a specific RNA target,  is complementary compared with the sequence of the respective PM probe,
  Consequently, the binding constant of specific hybridization of the PM,
 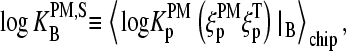 defines the mean affinity of PM/target duplexes with the central WC pair
  , base at position k = 13 of the PM sequence), whereas the binding constant of the MM,
 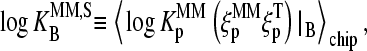 specifies the meanaffinity of MM/target duplexes with the central SC pair
  Fig. 10 illustrates this situation for B = G.
FIGURE 10.

Schematic illustration of the basepairing in the middle of the sequence of PM (left) and MM (right) probes upon duplex formation with specific (upper panel) and nonspecific (lower panel) transcripts. The example shows a probe pair with middle-bases G and C of the PM and MM probes, respectively. Upper-case letters refer to the DNA probes and lower-case letters to the RNA transcripts (asterisk indicates labeling). The middle base effectively forms Watson-Crick pairings in the nonspecific duplexes of the PM as well in the nonspecific duplexes of the MM (i.e., C·g and G·c* in the chosen example, respectively). It also forms a Watson-Crick pair in the specific duplexes of the PM probes but a self-complementary pair in the specific duplexes of the MM probes (i.e., C·g for the PM and G·g for the MM). Note that the remaining positions along the probe sequences are partly mismatched in the nonspecific duplexes.
Let us split the middle-base related binding constant of specific hybridization into two factors according to
 |
(9) |
where  is the mean effective binding constant due to the middle-base B (P = PM, MM), and
  is the mean binding constant referring to the bases of the remaining sequence at base positions k = 1–12 and 14–25 of the sequence.
The effective binding constants of the middle base of a PM/MM probe pair can be transformed into the scale of reduced Gibbs free energy of duplex formation according to
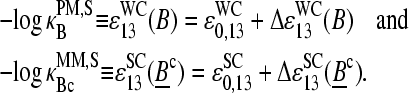 |
(10) |
Here, 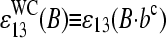 denotes the mean effective free energy (in units of the thermal energy RT) due to the formation of the WC pairs B·bc at position 13 of the probe sequence in DNA/RNA oligonucleotide duplexes on the microarray. The respective free energy of the SC pair Bc·bc is
 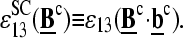 We decomposed the free energies into a base-independent mean contribution,
 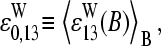 and a base-dependent incremental contribution,
  (W = WC, SC).
It seems safe to assume  because the sequences of the PM and MM probes of one pair are identical except the middle base. With this approximation and making use of Eqs. 9 and 10, one obtains for the log-difference of the middle-base related binding constants of specific hybridization
 |
(11) |
It consequently provides the mean free energy difference of specific duplex formation for all PM-MM probe pairs of the chip possessing PM with middle-base B owing to the replacement of a SC by a WC pair, Bc·bc → B·bc.
Basepairings in nonspecific duplexes of PM and MM probes
By nonspecific binding we imply the ensemble of lower affinity mismatched duplexes involving sequences other than the intended target. Hence, the effective binding constant of nonspecific hybridization includes averaging over all relevant RNA fragments which only partly match the considered probes by WC pairs (see 25,26). It consequently represents the concentration-weighted average over the binding constants of a cocktail of RNA sequences, ξ, that differ from the target sequence, ξT,
 |
(12) |
Let us split the binding constant of nonspecific hybridization in the effective binding constants due to the middle-base at position k = 13,  and due to the bases at the remaining base positions k = 1–12 and 14–25 of the probe sequence,
  in analogy with the approximation used in the limiting case of specific hybridization (see Eq. 9). The effective binding constant of the middle-base B is given by the weighted average over the Boltzmann factor of the WC and non-WC basepairings in nonspecific DNA-probe/RNA dimers,
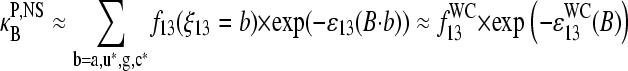 |
(13) |
Here ɛ13(B·b) denotes the reduced free energy of the basepairing B·b (b = a,u*,g,c*). The weighting factor, f13(ξ13 = b), is the probability of occurrence of base b in B·b pairings.
The right-hand side of Eq. 13 assumes that only WC pairings significantly contribute to the stability of nonspecific duplexes at this position. This assumption is justified, at least in a simple approach, because the interaction free energy of the strongest non-WC pair, T·g, is considerably weaker by >2–3 × RT (i.e., >4–7 kJ/mol) than the free energy of the respective WC pairs, T·a and C·g (21; see also 20,29,30). The stability of non-WC pairs further decreases according to T·g ≫ G·u ≈ G·g > G·a ≈ A·g ≈ C·a > A·a ≈ T·u ≈ C·u > A·c ≈ T·c (30).
The logarithm of Eq. 13 shows that the binding constant in nonspecific duplexes provides an effective free energy contribution which is apparently reduced by the term  compared with the free energy of the WC basepairing,
 |
(14) |
where  is the fraction of WC pairings of B in the nonspecific duplexes,
  (N denotes the number of the respective pairings). Note that Eq. 14 refers to the binding of nonspecific RNA fragments to P = PM and MM probes as well (see Fig. 10 for B = G). After rearrangement of Eq. 14 and making use of Eq. 10, we obtain
 |
(15) |
With  (see previous section), one gets, for the log-difference between the binding constants of PM and MM probes in the limit of nonspecific hybridization,
 |
(16) |
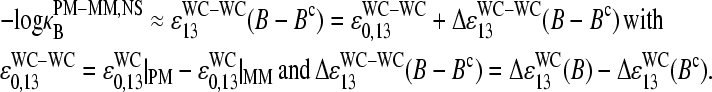
Here, ɛWC-WC(B−Bc) denotes the mean free energy difference between DNA/RNA oligonucleotide duplexes with the WC pairs B·bc and Bc·b at position k = 13 of the 25-meric DNA probe, which is averaged over all PM-MM probe pairs of the chip. The middle-base related log-difference of the binding constants of the PM and MM for nonspecific hybridization consequently describes the change of free energy upon the reversal of the WC pair, B·bc → Bc·b (see Fig. 10 for illustration).
The mean free energy difference between WC and SC pairings
The PM-MM differences of the log-intensity data,  , and the derived sensitivities,
  and
and  , are directly related to the free energy of basepairings due to DNA/RNA duplex formation on the microarray. Fig. 11 illustrates the base-specific free energy contributions and the respective differences together with the relevant experimental intensity and sensitivity data in terms of an energy level diagram. The lower panel (Fig. 11 a) shows the differences between the effective free energy of complementary middle bases in DNA oligonucleotide probes upon duplex formation with nonspecific (left) and specific (right) RNA fragments. The respective values of
 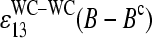 and
and  were estimated by means of the log-intensity difference between PM and MM probes (see Eqs. 1, 3, 11, and 16 and also the upper panels in Figs. 6 and 7).
FIGURE 11.

Schematic energy level diagram of the Gibbs free energy of basepairings and their differences at the central position of PM and MM probes in the limit of nonspecific (left) and specific (right) hybridization. (a) Difference of the respective total free energy contribution of complementary bases (see Eqs. 11 and 16); (b) difference of the base-specific incremental contribution; and (c) base-specific incremental free energy contribution. The free energy terms were estimated using the log-intensity difference,  (a, compare with Figs. 3–5), the sensitivity differences
  and
and  (b, compare with Fig. 8) and the single-base sensitivity terms,
  and
and  (compare with Fig. 9). See text.
For equally hybridized PM and MM one expects a fraction of bright MM of f(PM < MM) ≈ 0.5 and a middle-base related mean PM-MM log-intensity difference of  , in contrast to the results. Note that the middle-base related mean PM-MM log-intensity difference,
  , and the respective fraction of bright MM, fB(MM < PM), asymmetrically distribute around the expected values at vanishing amounts of specific transcripts (see Figs. 7 and 8). As a consequence, the mean free energy difference between WC pairings in PM and MM probes,
  , significantly deviates from zero (see lower panel in Fig. 3 and dashed line in Fig. 11 a for illustration). One expects, however, for
  a vanishing value (see Eq. 16) because the PM and MM on the average possess an equal affinity for WC pairings with the nonspecific RNA fragments. The nonrandom probability distribution of the middle base among the PM probes on the HG-U133 Affymetrix chip with a slightly higher fraction of C and T (23% and 31%, respectively) compared with G and A (22% and 24%) partly, but not fully, explains the significant deviation of the observed from the expected value. Possibly also a nonrandom base distribution of the PM and MM probes at k ≠ 13 and of the relevant nonspecific RNA fragments give rise to the observed effect because it potentially introduces an asymmetric relation between the PM and MM intensities.
The mean free energy difference considerably changes to 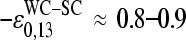 in the limit of specific hybridization (see lower panel in Fig. 3 and dashed line in Fig. 11 a for illustration). It provides the mean free energy difference between a WC and an SC pair in RNA-target/DNA-probe duplexes on the microarray. Interestingly the obtained value of
  well agrees with the mean reduced free energy of a WC pair in RNA/DNA oligonucleotide duplexes in solution,
 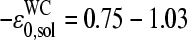 , which was estimated by means of
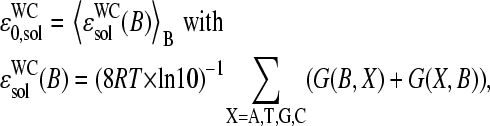 |
(17) |
using the respective nearest-neighbor free energy terms, G(BB′); B, B′ = A, T, G, C (29,31). The agreement between  and
and  can be rationalized if the strengths of basepair interactions are similar in RNA/DNA oligonucleotide duplexes in solution and on microarrays and if the mean free energy of the SC pairs is much weaker than that of the WC pairs,
 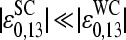 .
.
Base-specific interactions: the purine/pyrimidine asymmetry
Fig. 11 b illustrates the middle-base specific incremental contribution to the free energy differences between complementary bases in WC pairs (left), and complementary bases in WC and SC pairings (right), which were extracted from the middle-base related PM-MM sensitivity difference and the single-base model (see Eqs. 5 and 6 and Figs. 8 and 9). The duplet-like relation between the  -values in the limit of dominating nonspecific hybridization can be explained by the formation of WC pairings between the middle base of the probes with the bound RNA fragments and an asymmetry of basepair interactions upon reversal of the type B·bc → Bc·b as illustrated in Fig. 11 c (left panel, see also Fig. 10 for B = G). The common binding strength for the same base in PM and MM probes and the fact that a pyrimidine (Y = C, T) in the DNA-probe forms a stronger WC pair (C·g and T·a) than the complementary purine (R = G, A; G·c*, A·u*) give rise to the duplet-like relation
 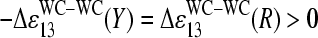 as indicated by the sensitivity differences
  and
and  .
.
The duplet transforms into a triplet-like pattern of the incremental contributions,  , in the limit of high specific transcript concentration (see Fig. 11 b, right panel and Fig. 8). This relation between the sensitivities can be rationalized if the middle base of the PM probe forms a WC pair whereas the complementary middle base of the MM probe faces itself in a SC basepair with the RNA target (see Fig. 10 for illustration). The triplet-like relation between the data is compatible with the assumption that the SC pairs on the average only weakly contribute to duplex stability as stated above, i.e.,
 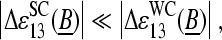 and with the pyrimidine-purine asymmetry of WC pairings,
  (see Fig. 11 c, left panel). In this case the different basepairings, namely the WC pair B·bc of the PM and the SC pair Bc·bc of the respective MM give rise to
 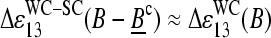 . In other words, the free energy change upon the replacement of a SC by a WC pairing, e.g., C·c* → G·c*, roughly reflects the strength of the WC pair (see Fig. 10). The respective PM-MM sensitivity differences consequently order according to the strengths of the WC pairings in DNA/RNA oligo duplexes, C > G ≈ T > A.
Note that the reduced Gibbs free energy of basepairings in DNA/RNA oligonucleotide duplexes in solution,
 |
(see Eq. 17), decreases in a similar order according to C > G > T > A. Hence, the basepair interactions derived from solution data also show a purine/pyrimidine asymmetry. It can be specified by the asymmetry parameter, which characterizes the relative gain of free energy upon the reversal of the bond direction according to R·y → Y·r,  and
and  . The respective asymmetry increases to
  for the pairings of the middle base of microarrays oligo probes (24). Note that the WC basepairings of the purines on the microarray, G·c* and A·u*, carry the biotinyl and the fluorescent labels. Hence, the higher purine/pyrimidine asymmetry on the microarray can be attributed to the labeling of the RNA fragments, which potentially hampers binding (17,24).
The PM-MM asymmetry of probe intensities
Our interpretation of nonspecific hybridization on microarrays assumes that the hybridization solution contains a sufficient large number of different sequences, which partially match the probe sequences via WC pairings including their central bases. In other words, this cocktail of RNA fragments with a broad distribution of base compositions on the average enables WC pairings with the middle bases of the PM and with the complementary middle base of the respective MM as well. As a consequence, the base-related affinities are virtually equal for base B in both types of probes but different for the complementary couples of bases B and Bc of each PM-MM probe pair.
This asymmetric relation of basepair interactions in nonspecific duplexes gives rise to observed asymmetry of probe intensities, i.e., the tendency of bright PM for B = C, T, and, vice versa, of bright MM for B = G, A. The “riddle of bright MM” refers solely to nonspecific hybridization. It simply reflects the reversal of WC pairings with asymmetrical binding strength according to our interpretation. The results of previous analyses of the PM-MM intensity relation of all probe pairs of a series of GeneChips (6,17) can be understood if the overwhelming majority of the probes of the chips are nonspecifically hybridized.
In the special case of specific hybridization each probe is related to only one specific RNA-target sequence, which completely matches the sequence of the PM probe via WC pairings. The complementary middle base of the MM consequently mismatches the respective position of the target sequence via an SC pairing. Our analysis reveals that almost none of the analyzed 462 spiked-in probe pairs give rise to bright MM if specific transcripts dominate hybridization. This result strongly indicates a considerably reduced affinity of the mismatch, which causes the significantly reduced intensity of the MM compared with that of the PM.
Using a stochastic approach, Wu and Irizzary (32) claimed that the effect of bright MM is a consequence of the noisy character of the system and of the difference in the affinities for different sequences combined with the assumption that the MM do not measure specific signals. Our results, however, clearly indicate that the MM also bind specific transcripts in relevant amounts. Moreover, the analysis of chip data without differentiation between specific and nonspecific hybridization seems inappropriate, at least at small intensities, because the central base affects duplex formation in a letter-specific fashion.
Accuracy and precision of expression measures
The basic application of the GeneChip technology intends to estimate the level of differential gene expression in terms of the log-fold change of the RNA transcript concentration between different samples, 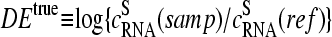 , for example, between the sample of interest and an appropriately chosen reference. The respective log-intensity ratio,
 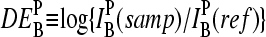 with P = PM, MM, provides a measure of the differential expression in the simplest approach. In the Appendix we show that
  , the apparent differential expression, additively decomposes into the true log-fold change of the RNA concentration and an incremental contribution
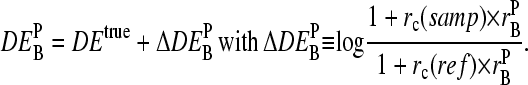 |
(18) |
The latter term is a function of the concentration ratio of nonspecific and specific RNA, 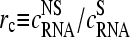 in the reference and the sample, and of the ratio of the respective binding constants,
 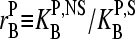 . It specifies the deviation of the apparent differential expression from its true value and thus it characterizes the accuracy of the estimated
  value. Fig. 12, a and b, shows
  for P = PM, MM as a function of DEtrue using the interaction parameters determined in this study (see the Appendix for details). The apparent values systematically underestimate the differential expression, owing to the nonspecific background intensity being unrelated to the concentration of the target RNA. Note that the MM-only estimates are less accurate compared with the PM-only values, i.e.,
  because the nonspecific background provides a larger contribution to the MM intensity on a relative scale.
FIGURE 12.

Apparent differential expression,  , as a function of the true log-fold change of the RNA-target concentration, DEtrue. The apparent values were calculated using the log-fold change of the probe intensities as described in the Appendix (see also Eq. 18). The PM-only (a) and MM-only (b) intensity data underestimate the true value whereas the PM-MM intensity difference provides an acceptable measure of DEtrue (c). Note that
  depends on the middle-base B = A, T, G, C for P = MM and PM-MM. Panels d and e show the mean values,
  , which are averaged over the four possible middle bases and the respective coefficient of variation,
  , respectively. The deviation of
  from DEtrue specifies the accuracy and
  is inversely related to the precision of the respective measure of gene expression (see text).
The MM probes were designed to estimate the amount of nonspecific hybridization and, in this way, to provide corrected intensities by means of the intensity difference of the probe pairs, Δ ≡ PM-MM (see Appendix). Indeed, the respective differential expression values on average provide a relative accurate result (see Fig. 12 c). The averages of the  over the four middle bases show that the accuracy of the intensity measures of the differential expression decrease according to true ≈ PM-MM > PM > MM (see Fig. 12 d).
Interestingly, the calculated  -data reveal a second effect. The PM-only estimates,
  , are independent of the middle base whereas the log-fold intensity changes of the MM and consequently also that of the PM-MM difference markedly vary as a function of B = A, T, G, C. This effect can be rationalized by the fact that the specific and nonspecific duplexes of the PM are both characterized by the same WC pairing in the middle of the sequence whereas the MM form an SC pair in the specific duplexes and a WC pair in the nonspecific ones (see Fig. 10). Consequently, the interaction- and also the intensity-characteristics vary in a similar fashion for all middle bases in the PM duplexes upon changing the concentration ratio rc, whereas the respective interactions in the MM duplexes vary differently.
The middle base of the probes consequently introduces a systematic source of variability to the apparent differential expression values,  , because microarray probes are usually designed without special attention to their middle base. Fig. 12 e shows the coefficient of variation of the apparent log-fold changes,
  (note that SD and 〈…〉 denote the standard deviation and the arithmetic average, respectively), as a measure of the variability upon changing B. It is inversely related to the precision (resolution) of the respective differential expression measures. The precision of the PM-only intensity measure clearly outperforms those of the two other estimates, i.e., PM > MM ≈ PM-MM.
Hence, the high accuracy of expression measures based on the PM-MM intensity difference is opposed by their relatively low precision. The latter effect depends in a systematic fashion on the middle base. Its explicit consideration and correction in sophisticated analysis algorithms that take the middle-base specific intensity characteristics into account is expected to improve the precision of PM-MM measures.
Hybridization on microarrays
Melting experiments on DNA oligonucleotide hybridization on microarrays have shown that surface-tethered DNA duplexes are less stable than hybrids formed in bulk solution, as indicated by the substantial reduction of the standard enthalpy change upon denaturation (33). These results suggest that the physical environment of hybrids formed at the solid interface is significantly different from that in solution owing to kinetic effects (11), equilibrium thermodynamics (10), and surface electrostatics (11,18). The latter effect causes, e.g., the Coulomb blockage of microarray hybridization with increasing coverage of the array probes (14,18,34).
On the other hand, the thermodynamic parameters of surface hybridization and thus the stability of the hybrids on microarrays display the same general trends with respect to changes of solution ionic strength and the presence of single mismatches as the duplexes formed in bulk solution (33). These results agree with our recent findings, which, on the one hand, indicate agreement between chip and solution data with respect to the specificity of basepair interactions, and, on the other hand, differences between both systems with respect to the absolute magnitude of the interactions' strength (24). In particular, we found that the base-specific nearest-neighbor free energies of WC basepairings in DNA/RNA duplexes on microarrays strongly correlate with that for hybridization in solution, while their magnitude is considerably decreased compared with the solution data.
Surface hybridization is obviously well compatible with hybridization in solution with respect to the relative stability of basepairings. The present study confirms this conventional view on microarray hybridization. It predicts that 1), nonspecific binding is on the average identical for PM and MM probes with systematic deviations owing to the pyrimidine/purine asymmetry of WC basepair interactions in RNA/DNA duplexes; and that 2), the mismatch reduces the affinity of specific target-binding to the MM due to the considerably weaker interactions of mismatched basepairings.
In this study we used two independent measures to estimate duplex stability as a function of the middle base, namely the positional dependent SB-sensitivities and the sensitivity-averages over probes with a common middle base. This simple description in terms of single-base related parameters to a large extent neglects cooperative effects of the whole sequence of the oligonucleotides. The explicit consideration of the adjacent bases in terms of nearest neighbor- and/or middle triple-related energy parameters is expected to refine the results (24). Moreover, the propensity of the probe and of the target for intramolecular folding (2), “zippering effects” (i.e., target/probe duplexes which look like a partly opened double-ended zipper, 35) and a certain fraction of shorter oligonucleotide lengths after imperfect photolithographic synthesis (36,37), also modify the duplex stability with possible consequences for the middle-base related interaction parameters.
Note that the positional dependent SB-sensitivity terms are effective parameters, which are averaged over all possible microscopic states of the respective duplexes. The contribution of each basepairing is weighted by its probability to occur in the individual DNA/RNA dimers. Consequently zippering effects and/or shorter probe lengths can explain the observed sensitivity gradient along the sequence (see upper panel in Fig. 9) because the probability of paired bases decreases in direction toward the ends in the zippered and/or truncated duplexes. On the other hand, these effects are minimum in the center of the sequence and, moreover, they affect the paired PM and MM in a similar fashion, leaving the PM-MM log-intensity difference, and thus the estimated middle-base related affinity parameters, virtually unaffected.
SUMMARY AND CONCLUSIONS
Specific and nonspecific hybridization give rise to different relations between the PM and MM intensities, namely a triplet-like pattern of the PM-MM log-intensity difference in the former case and a duplet-like split in the latter case. The analysis of intensity data without the careful separation between specific and nonspecific binding events can therefore lead to confusion about what RNA hybridizes the probes, and in consequence to the incorrect assignment of basepair interactions. This in turn affects the estimation of signal intensities in terms of gene expression and, in particular, the consideration of the MM intensities as a correction term for nonspecific hybridization of the PM.
It has been shown that relevant interaction parameters for estimating probe intensities can be derived from chip data, and, in particular, that the set-averaged probe intensity as a simple intensity-criterion allows us to discriminate between predominantly specifically and predominantly nonspecifically hybridized probes. Here we analyzed the PM and MM intensities in terms of simple single-base related parameters to establish the basic relations between the PM and MM data. A more detailed approach using nearest-neighbor interaction parameters is expected to refine the results.
The analysis indicates that the intensity of complementary MM introduces a systematic source of variation compared with the intensity of the respective PM probe. In consequence, the naive correction of the PM signal by subtracting the MM intensity decreases the precision of expression measures. Our results suggest improved algorithms of data analysis, which explicitly consider the middle-base related bias of the MM intensities to reduce their systematic effect. Moreover, the knowledge of the central basepairings in specific and nonspecific duplexes allows revision of mismatch-based strategies of chip design—for example, by testing alternative rules for predefined mismatches other than the complementary mismatches used on GeneChips.
Acknowledgments
We thank Prof. Markus Loeffler and Prof. Peter Stadler for support and discussion of aspects of the article.
The work was supported by the Deutsche Forschungsgemeinschaft under grant no. BIZ 6-1/2.
APPENDIX: DERIVATION OF EQ. 18
The middle-base averaged probe intensity can be approximated by the superposition of contributions due to specific and nonspecific hybridization,  , if one neglects saturation for sake of simplicity. The intensities of the specifically and nonspecifically hybridized probes are directly related to the concentrations and the binding constants of the respective RNA fragments, i.e.,
  (h = S, NS; and F is a constant). With Eq. 9 one obtains after some rearrangements
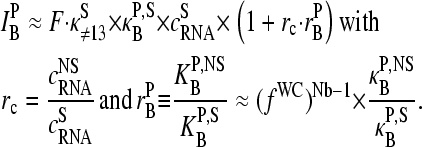 |
(A1) |
The latter equation assumes 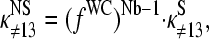 i.e., a constant and positional independent fraction of WC pairings of
  for each of the Nb = 25 sequence positions in the nonspecific duplexes in analogy with Eq. 13. The ratio of the binding constants can be further specified using Eq. 15,
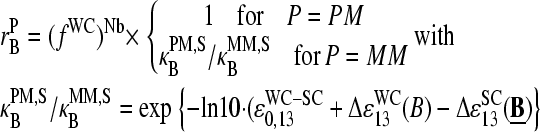 |
(A2) |
Analogous considerations lead to the result that Eq. A1 applies also to the intensity difference between PM and MM probes, 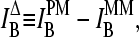 with the substitutions for P = Δ:
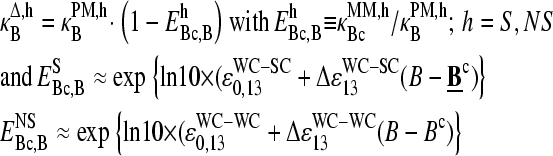 |
(A3) |
Equation 18 can be directly obtained by application of Eq. A1 for two transcript concentrations, a sample and the reference, and its insertion into  .
.
The incremental contribution,  was estimated using Eqs. A2 and A3 and the following parameters obtained in this study:
  and −0.25 (B = A,T,G,C); and
 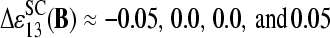 . The factor (fWC)Nb ≈ 10−2.5 was estimated previously (25). The spiked-in experiment used a common concentration level of nonspecific RNA fragments (cNS(samp) ≈ cNS(ref)), which gives rise to the following relation between the concentration ratios of the sample and the reference:
References
- 1.Lipshutz, R. J., S. P. A. Fodor, T. R. Gingeras, and D. J. Lockhart. 1999. High density synthetic oligonucleotide arrays. Nat. Genet. 21:20–24. [DOI] [PubMed] [Google Scholar]
- 2.Matveeva, O. V., S. A. Shabalina, V. A. Nemtsov, A. D. Tsodikov, R. F. Gesteland, and J. F. Atkins. 2003. Thermodynamic calculations and statistical correlations for oligo-probes design. Nucleic Acids. Res. 31:4211–4217. [DOI] [PMC free article] [PubMed] [Google Scholar]
- 3.Affymetrix. 2001. Affymetrix Microarray Suite 5.0. In User Guide. Affymetrix, Inc., Santa Clara, CA.
- 4.Li, C., and W. H. Wong. 2001. Model-based analysis of oligonucleotide arrays: expression index computation and outlier detection. Proc. Natl. Acad. Sci. USA. 98:31–36. [DOI] [PMC free article] [PubMed] [Google Scholar]
- 5.Li, C., and W. H. Wong. 2001. Model-based analysis of oligonucleotide arrays: model validation, design issues and standard error application. Genome Biol. 2:1–11. [DOI] [PMC free article] [PubMed] [Google Scholar]
- 6.Naef, F., D. A. Lim, N. Patil, and M. Magnasco. 2002. DNA hybridization to mismatched templates: a chip study. Phys. Rev. E. 65:4092–4096. [DOI] [PubMed] [Google Scholar]
- 7.Zhou, Y., and R. Abagyan. 2002. Match-only integral distribution (MOID) algorithm for high-density oligonucleotide array analysis. BMC Bioinf. 3:15. [DOI] [PMC free article] [PubMed] [Google Scholar]
- 8.Irizarry, R. A., B. M. Bolstad, F. Collin, L. M. Cope, B. Hobbs, and T. P. Speed. 2003. Summaries of Affymetrix GeneChip probe level data. Nucleic Acids. Res. 31:e15. [DOI] [PMC free article] [PubMed] [Google Scholar]
- 9.Affymetrix. 2001b. New Statistical Algorithms for Monitoring Gene Expression on GeneChip® Probe Arrays. Technical Note. Affymetrix, Inc., Santa Clara, CA.
- 10.Bhanot, G., Y. Louzoun, J. Zhu, and C. DeLisi. 2003. The importance of thermodynamic equilibrium for high throughput gene expression arrays. Biophys. J. 84:124–135. [DOI] [PMC free article] [PubMed] [Google Scholar]
- 11.Chan, V., D. Graves, and S. McKenzie. 1995. The biophysics of DNA hybridization with immobilized oligonucleotide probes. Biophys. J. 69:2243–2255. [DOI] [PMC free article] [PubMed] [Google Scholar]
- 12.Chudin, E., R. Walker, A. Kosaka, S. Wu, D. Rabert, T. Chang, and D. Kreder. 2001. Assessment of the relationship between signal intensities and transcript concentration for Affymetrix GeneChip® arrays. Genome Biol. 3:research0005.1–0005.10. [DOI] [PMC free article] [PubMed] [Google Scholar]
- 13.Dimitrov, R. A., and M. Zuker. 2004. Prediction of hybridization and melting for double-stranded nucleic acids. Biophys. J. 87:215–226. [DOI] [PMC free article] [PubMed] [Google Scholar]
- 14.Halperin, A., A. Buhot, and E. B. Zhulina. 2004. Sensitivity, specificity, and the hybridization isotherms of DNA Chips. Biophys. J. 86:718–730. [DOI] [PMC free article] [PubMed] [Google Scholar]
- 15.Hekstra, D., A. R. Taussig, M. Magnasco, and F. Naef. 2003. Absolute mRNA concentrations from sequence-specific calibration of oligonucleotide arrays. Nucleic Acids. Res. 31:1962–1968. [DOI] [PMC free article] [PubMed] [Google Scholar]
- 16.Held, G. A., G. Grinstein, and Y. Tu. 2003. Modeling of DNA microarray data by using physical properties of hybridization. Proc. Natl. Acad. Sci. USA. 100:7575–7580. [DOI] [PMC free article] [PubMed] [Google Scholar]
- 17.Naef, F., and M. O. Magnasco. 2003. Solving the riddle of the bright mismatches: hybridization in oligonucleotide arrays. Phys. Rev. E. 68:11906–11910. [DOI] [PubMed] [Google Scholar]
- 18.Vainrub, A., and B. M. Pettitt. 2002. Coulomb blockage of hybridization in two-dimensional DNA arrays. Phys. Rev. E 66:art. no. 041905. [DOI] [PubMed]
- 19.Zhang, L., M. F. Miles, and K. D. Aldape. 2003. A model of molecular interactions on short oligonucleotide microarrays. Nat. Biotechnol. 21:818–828. [DOI] [PubMed] [Google Scholar]
- 20.Peyret, N., P. A. Seneviratne, H. T. Allawi, and J. SantaLucia. 1999. Nearest-neighbor thermodynamics and NMR of DNA sequences with internal AA, CC, GG, and TT mismatches. Biochemistry. 38:3468–3477. [DOI] [PubMed] [Google Scholar]
- 21.Sugimoto, N., M. Nakano, and S. Nakano. 2000. Thermodynamics-structure relationship of single mismatches in RNA/DNA duplexes. Biochemistry. 39:11270–11281. [DOI] [PubMed] [Google Scholar]
- 22.Dorris, D. R., A. Nguyen, L. Gieser, R. Lockner, A. Lublinsky, M. Patterson, E. Touma, T. J. Sendera, R. Elghanian, and A. Mazumder. 2003. Oligodeoxyribonucleotide probe accessibility on a three-dimensional DNA microarray surface and the effect of hybridization time on the accuracy of expression ratios. BMC Biotechnol. 3:6. [DOI] [PMC free article] [PubMed] [Google Scholar]
- 23.Ramakrishnan, R., D. Dorris, A. Lublinsky, A. Nguyen, M. Domanus, A. Prokhorova, L. Gieser, E. Touma, R. Lockner, M. Tata, X. Zhu, M. Patterson, et al. 2002. An assessment of Motorola CodeLink™ microarray performance for gene expression profiling applications. Nucleic Acids. Res. 30:e30. [DOI] [PMC free article] [PubMed] [Google Scholar]
- 24.Binder, H., T. Kirsten, I. Hofacker, P. Stadler, and M. Loeffler. 2004. Interactions in oligonucleotide duplexes upon hybridisation of microarrays. J. Phys. Chem. B. 108:18015–18025. [Google Scholar]
- 25.Binder, H., T. Kirsten, M. Loeffler, and P. Stadler. 2004. The sensitivity of microarray oligonucleotide probes—variability and the effect of base composition. J. Phys. Chem. B. 108:18003–18014. [Google Scholar]
- 26.Binder, H., S. Preibisch, and T. Kirsten. 2005. Basepair interactions and hybridization isotherms of matched and mismatched oligonucleotide probes on microarrays. http://www.arvix.org/abs/q-bio.BM/0501008. [DOI] [PubMed]
- 27.Binder, H., T. Kirsten, M. Loeffler, and P. Stadler. 2003. Sequence specific sensitivity of oligonucleotide probes. Proc. German Bioinf. Conf. 2:145–147. [Google Scholar]
- 28.Mei, R., E. Hubbell, S. Bekiranov, M. Mittmann, F. C. Christians, M.-M. Shen, G. Lu, J. Fang, W.-M. Liu, T. Ryder, P. Kaplan, D. Kulp, et al. 2003. Probe selection for high-density oligonucleotide arrays. Proc. Natl. Acad. Sci. USA. 100:11237–11242. [DOI] [PMC free article] [PubMed] [Google Scholar]
- 29.Sugimoto, N., S. Nakano, M. Katoh, A. Matsumura, H. Nakamuta, T. Ohmichi, M. Yoneyama, and M. Sasaki. 1995. Thermodynamic parameters to predict stability of RNA/DNA hybrid duplexes. Biochemistry. 34:11211–11216. [DOI] [PubMed] [Google Scholar]
- 30.Kierzek, R., M. E. Burkard, and D. H. Turner. 1999. Thermodynamics of single mismatches in RNA duplexes. Biochemistry. 38:14214–14223. [DOI] [PubMed] [Google Scholar]
- 31.Wu, P., S. Nakano, and N. Sugimoto. 2002. Temperature dependence of thermodynamic properties for DNA/DNA and RNA/DNA duplex formation. Eur. J. Biochem. 269:2821–2830. [DOI] [PubMed] [Google Scholar]
- 32.Wu, Z., and R. A. Irizarry. 2004. Stochastic models inspired by hybridization theory for short oligonucleotide microarrays. Proc. RECOMB'04. San Diego, CA. [DOI] [PubMed]
- 33.Watterson, J. H., P. A. E. Piunno, C. C. Wust, and U. J. Krull. 2000. Effects of oligonucleotide immobilization density on selectivity of quantitative transduction of hybridization of immobilized DNA. Langmuir. 16:4984–4992. [Google Scholar]
- 34.Peterson, A. W., R. J. Heaton, and R. M. Georgiadis. 2001. The effect of surface probe density on DNA hybridization. Nucleic Acids. Res. 29:5163–5168. [DOI] [PMC free article] [PubMed] [Google Scholar]
- 35.Deutsch, J. M., S. Liang, and O. Narayan. 2004. Modeling of microarray data with zippering. arXiv:q-bio.BM/0406039 v1.
- 36.Jobs, M., S. Fredriksson, A. J. Brookes, and L. Ulf. 2002. Effect of oligonucleotide truncation on single-nucleotide distinction by solid-phase hybridization. Anal. Chem. 74:199–202. [DOI] [PubMed] [Google Scholar]
- 37.McGall, G. H., A. D. Barone, M. Diggelman, S. P. A. Fodor, E. Gentalen, and N. Ngo. 1997. The efficiency of light-directed synthesis of DNA arrays on glass substrates. J. Am. Chem. Soc. 119:5081–5090. [Google Scholar]